Graphing Inequalities on Number Line (original) (raw)
Last Updated : 7 Feb, 2026
An inequality is a mathematical statement that shows the relationship between two values where one value is either less than, greater than, less than or equal to or greater than or equal to the other. The common inequality symbols are:
- "<" (less than)
- ">" (greater than)
- "≤" (less than or equal to)
- "≥" (greater than or equal to)
- "≠" (not equal to)
Graphing inequalities on a number line means showing all the values that make an inequality true using points and shading on a number line.
How to Graph Inequalities on a Number Line
**Step 1: Start by drawing a horizontal line and marking the points corresponding to the critical values in the inequality.
**Step 2: Identify the Critical Point(s).
The critical point is where the inequality is centered. This could be a single value or multiple values depending on the inequality.
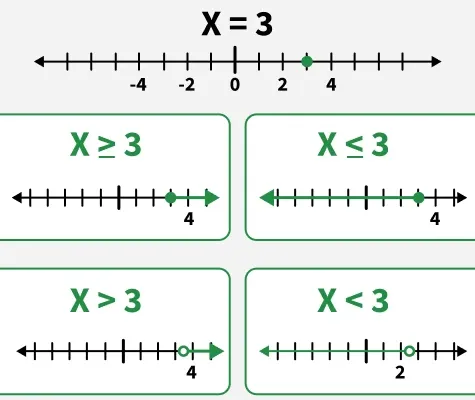
****Step 3:**Use Open or Closed Circles:
- Use an open circle if the inequality is "<" or ">".
- Use a closed circle if the inequality is "≤" or "≥".
**Step 4: Shade the Number Line:
- If the inequality is ">" or "≥" shade to the right of the critical point.
- If the inequality is "<" or "≤" shade to the left of the critical point.
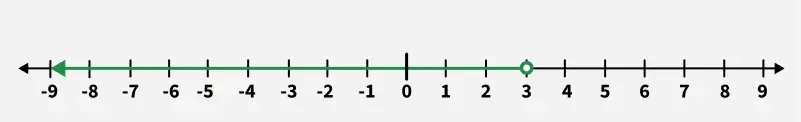
**Example : Graph x < 3 on number line.
**Solution:
Graph the inequality x < 3 on the number line:
- Draw a number line and mark the point 3.
- Use an open circle at 3.
- Shade the line to the left of the 3.
**Also Check
Solved Examples on Graphing Inequality on Number Line
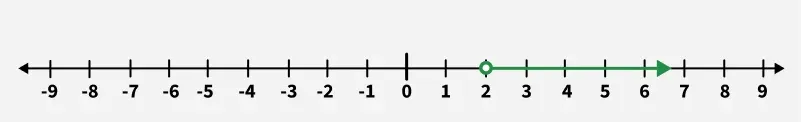
**Example 1: Graph the inequality x > 2
**Solution:
- Draw a number line.
- Place an open circle at 2.
- Shade to the right of 2.
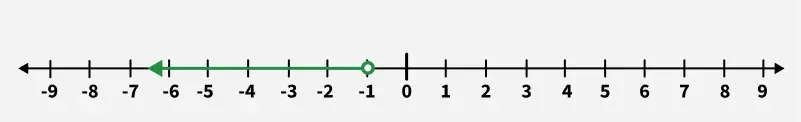
**Example 2: Graph the inequality x < −1.
**Solution:
- Draw a number line.
- Place an open circle at -1.
- Shade to the left of -1.
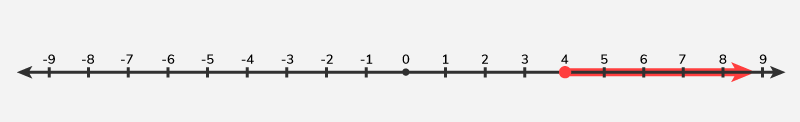
**Example 3: Graph the inequality x ≥ 4.
**Solution:
- Draw a number line.
- Place a closed circle at 4.
- Shade to the right of 4.
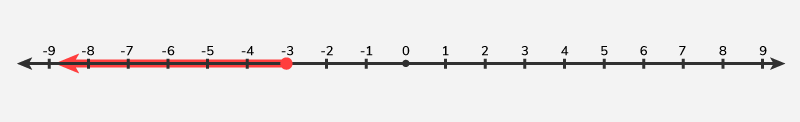
**Example 4: Graph the inequality x ≤ −3
**Solution:
- Draw a number line.
- Place a closed circle at -3.
- Shade to the left of -3.
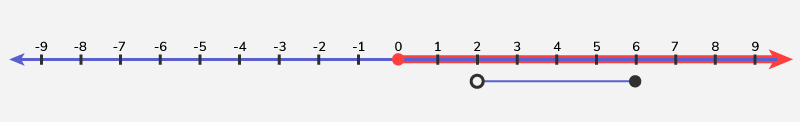
**Example 5: Graph the inequality 2 < x ≤ 6.
**Solution:
- Draw a number line.
- Place open circles at 2 and closed circles at 6.
- Shade between 2 and 6.
Practice Questions on Graphing Inequality on Number Line
**Q1: Graph the inequality x > −5 on a number line.
**Q2: Graph the inequality x ≤ 7 on a number line.
**Q3: Graph the inequality x < 1 on a number line.
**Q4: Graph the inequality x ≥ −3 on a number line.
**Q5: Graph the inequality x ≥ 0 on a number line.
**Q6: Graph the inequality x < −2 on a number line.
**Q7: Graph the inequality −4 ≤ x ≤ 2 on a number line.
**Q8: Graph the inequality 0 < x < 5 on a number line.
**Q9: Graph the inequality −7 < x ≤ 1 on a number line.
**Q10: Graph the inequality x ≠ 6 on a number line.