Linear Function (original) (raw)
Last Updated : 27 Apr, 2026
A linear function is a polynomial function of degree 1, meaning the highest power of x is 1. It represents a constant rate of change determined by the slope m. The graph of a linear function is always a straight line.
A linear function is commonly written in the slope–intercept form:
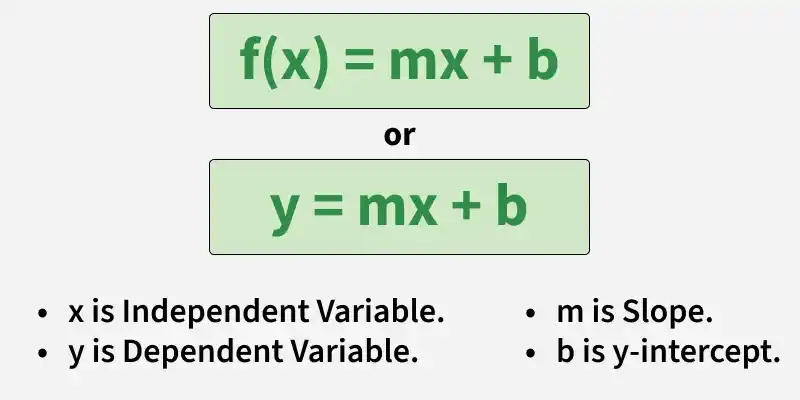
It relates the independent variable x with the dependent variable y (or f(x)).
Various examples of the linear function are
- y = f(x) = 2x + 1
- y = f(x) = -3x - 2
- y = f(x) = 5
Non-Linear Function
A non-linear function is a function whose graph does not form a straight line on the Cartesian plane. In such functions, the variables may have powers greater than one or appear in different forms, such as quadratic, exponential, or trigonometric expressions.
**Examples:
- y = x² (Quadratic function)
- y = x³ (Cubic function)
- y = 2ˣ (Exponential function)
Linear Function Graph
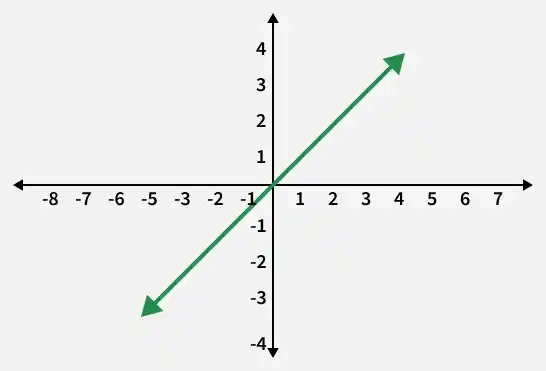
Steps to Graph a Linear Function
- Find two points that satisfy the equation y = mx + b.
- Plot these points on the Cartesian (X–Y) plane.
- Draw a straight line passing through the plotted points
Finding a Linear Function
A linear function can be found using the slope formula and the point-slope form of a line when two points on the line are known.
**Example: Find the linear function that passes through the points (1, 3) and (4, 9).
**Solution:
Given points:
(x₁, y₁) = (1, 3)
(x₂, y₂) = (4, 9)**Step 1: Find the slope
m = (y₂ − y₁) / (x₂ − x₁)
m = (9 − 3) / (4 − 1)
m = 6 / 3
m = 2**Step 2: Use the point-slope form
y − y₁ = m(x − x₁)
y − 3 = 2(x − 1)
**Step 3: Simplify the equation
y − 3 = 2x − 2
y = 2x + 1Therefore, the linear function is:
f(x) = 2x + 1
**Graphing of a Linear Function
To graph a linear function, we need at least two points that satisfy the equation. Plot these points on the coordinate plane and connect them to form the required line.
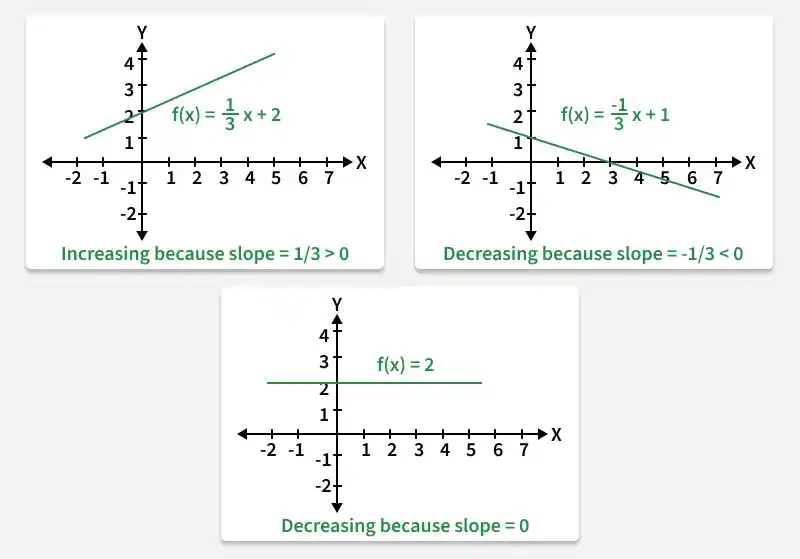
For a linear function f(x) = mx + b:
- The graph is increasing when m > 0.
- The graph is decreasing when m < 0.
- The graph is horizontal when m = 0.
There are two ways to **graph a linear function:
- By finding two points on the line.
- By using the slope and the y-intercept.
Graphing a Linear Function by Finding Two Points
To graph a linear function f(x) = mx + b, choose any two values of x and substitute them in the function to find the corresponding values of y.
**Example: Graph the function f(x) = 2x + 4
**Step 1: Choose two values of x
Let x = 0 and x = 1.
**Step 2: Find the corresponding values of y
| x | y |
|---|---|
| 0 | 2(0) + 4 = 4 |
| 1 | 2(1) + 4 = 6 |
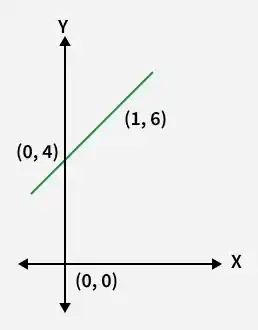
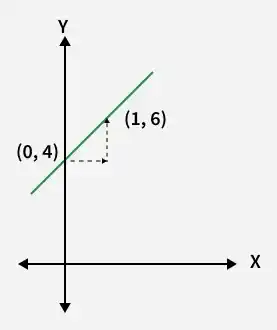
So, the two points on the line are (0, 4) and (1, 6).
**Step 3: Plot the points (0, 4) and (1, 6) on the coordinate plane. Join them with a straight line and extend the line in both directions to obtain the graph of the linear function.
**Graphing of Linear Function Using Slope and Y-intercept
A linear function can be graphed using the slope–intercept form:
f(x) = mx + b, where m is the slope and b is the y-intercept.
**Example: Graph the function f(x) = 2x + 4
Slope = 2
y-intercept = 4
Point on y-axis = (0, 4)
**Step 1: Plot the y-intercept (0, 4) on the coordinate plane.
**Step 2: Express the slope as a fraction.
Slope = 2 = 2/1
Rise = 2, Run = 1
**Step 3: From the point (0, 4), move 2 units up and 1 unit to the right to get another point (1, 6).
**Step 4: Draw a straight line passing through (0, 4) and (1, 6) and extend it in both directions.
**Domain and Range of a Linear Function
The domain of a linear function is the set of all possible values of x, and the range is the set of all possible values of y obtained from the function.
For a linear function f(x) = mx + b (where m ≠ 0):
- **Domain = ℝ (all real numbers)
- **Range = ℝ (all real numbers)
This means the function is defined for every real value of **x, and the graph extends infinitely in both directions.
**Note: When the slope m = 0, the function becomes f(x) = b, which represents a horizontal line.
In this case:
- **Domain = ℝ
- **Range = {b}
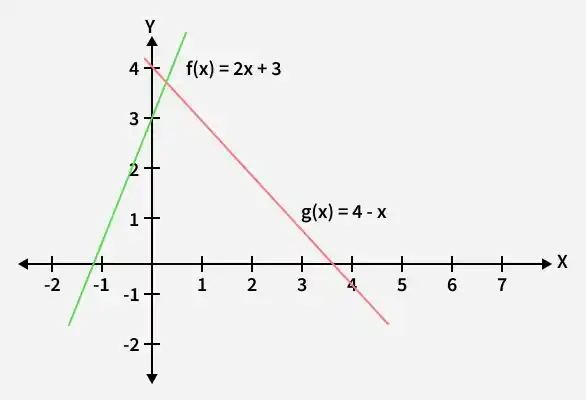
The figure above shows the graphs of f(x) = 2x + 3 and g(x) = 4 − x on the same coordinate plane, indicating that the domain and range of linear functions are all real numbers (ℝ).
**Inverse of Linear Function
The inverse of a linear function f(x) = ax + b is a function f⁻¹(x) such that:
- f(f⁻¹(x)) = f⁻¹(f(x)) = x
**Example: Find the inverse of the function f(x) = 3x + 5.
**Solution:
**Step 1: Write the function as
y = 3x + 5**Step 2: Interchange the variables x and y
x = 3y + 5**Step 3: Solve the equation for y
x − 5 = 3y
y = (x − 5) / 3**Step 4: Replace y with f⁻¹(x)
f⁻¹(x) = (x − 5) / 3
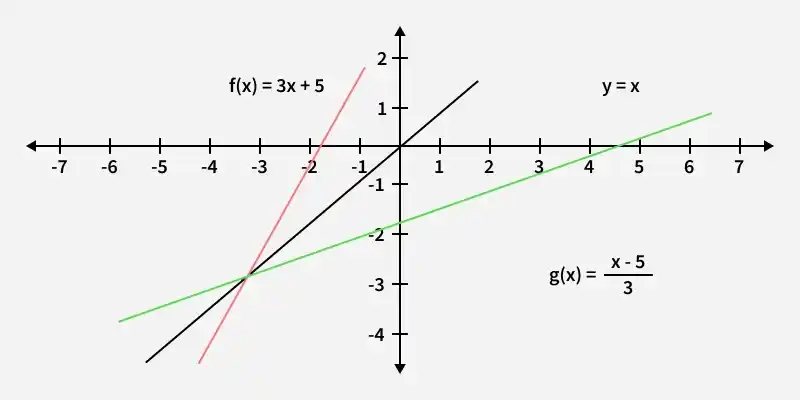
**Note: The graphs of f(x) and its inverse f⁻¹(x) are symmetric about the line y = x.
**Piecewise Linear Function
A piecewise linear function is a function that is defined by different linear expressions over different intervals of its domain. Each part of the function represents a straight line within its specified interval.
**Example:
- f(x) = 2x, x ∈ [-5, 4)
- f(x) = -x + 11, x ∈ [4, 12]
In this case, the function follows one linear rule for the first interval and another linear rule for the second interval.
**Also Check
Solved Problems
**Example 1: Find the linear function that has two points (-2, 17) and (1, 26) on it.
Given points,
(x₁, y₁) = (-2, 17)
(x₂, y₂) = (1, 26)**Step 1: Find the slope
m = (y₂ − y₁) / (x₂ − x₁)
m = (26 − 17) / (1 − (-2))
m = 9 / 3
m = 3**Step 2: Use the point-slope form
y − y₁ = m(x − x₁)
y − 17 = 3(x − (-2))
y − 17 = 3(x + 2)**Step 3: Simplify the equation
y − 17 = 3x + 6
y = 3x + 23Therefore, the linear function is
f(x) = 3x + 23
**Example 2: Check whether the data set represents a linear function or not.
| X | 3 | 5 | 7 | 11 | 13 |
|---|---|---|---|---|---|
| Y | 55 | 23 | 31 | 47 | 55 |
Plot the points in the table
X Y (Difference in Y)/(Difference in X) 3⇣+25 16⇣+823 ⇒ 8/2 = 4 5⇣+27 23⇣+831 ⇒ 8/2 = 4 7⇣+411 31⇣+1647 ⇒ 16/4 = 4 11⇣+213 47⇣+855 ⇒ 8/2 = 4 As all the numbers in the last column are equal, the given table represents the linear function.
**Example 3: Plot Linear Function Graph y = 3x + 2
Take some value of x and find its corresponding y-values.
x y = 3x + 2 1 3 × 1 + 2 = 5 2 3 × 2 + 2 = 8 3 3 × 3 + 2 = 11

Example 4: Plot the graph of the following: + 2y − 4 = 0
Given Linear Function, 3x + 2y - 4 = 0
3x + 2y = 4
3x/4 + 2y/4 = 1
x/(4/3) + y/(2) = 1Comparing with x/a + y/b = 1
• a = 4/3
• b = 2Now, point on x-axis is (a, 0) = (4/3, 0)
Point on y-axis is (0, b) = (0, 2)Plotting these points on the graph and joining them we get the required linear function.

Practice Problems
**Problem 1: Plot the graph of the following equation: -2x + y − 8 = 0, and also identify two points that lie on this equation.
**Problem 2: Plot the graph of the following equation: x + y − 1 = 0, and also identify two points that lie on this equation.
**Problem 3: Find the linear function that has two points (1, 3) and (-2, 4) on it.
**Answer:
- (2, 4), (4, 0)
- (-2, 3), (2, -1)
- 3y+x-10=0