numpy.log2() in Python (original) (raw)
Last Updated : 29 Nov, 2018
numpy.log2(arr, out = None, *, where = True, casting = ‘same_kind’, order = ‘K’, dtype = None, ufunc ‘log1p’) :
This mathematical function helps user to calculate Base-2 logarithm of x where x belongs to all the input array elements.
Parameters :
array : [array_like]Input array or object. out : [ndarray, optional]Output array with same dimensions as Input array, placed with result. **kwargs : Allows you to pass keyword variable length of argument to a function. It is used when we want to handle named argument in a function. where : [array_like, optional]True value means to calculate the universal functions(ufunc) at that position, False value means to leave the value in the output alone.
Return :
An array with Base-2 logarithmic value of x; where x belongs to all elements of input array.
Code 1 : Working
import numpy as np
in_array = [ 1 , 3 , 5 , 2 * * 8 ]
print ( "Input array : " , in_array)
out_array = np.log2(in_array)
print ( "Output array : " , out_array)
print ( "\nnp.log2(4**4) : " , np.log2( 4 * * 4 ))
print ( "np.log2(2**8) : " , np.log2( 2 * * 8 ))
Output :
Input array : [1, 3, 5, 256] Output array : [ 0. 1.5849625 2.32192809 8. ]
np.log2(44) : 8.0 np.log2(28) : 8.0
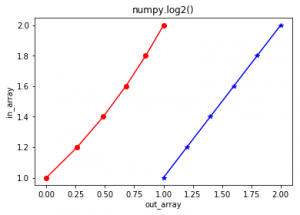
Code 2 : Graphical representation
import numpy as np
import matplotlib.pyplot as plt
in_array = [ 1 , 1.2 , 1.4 , 1.6 , 1.8 , 2 ]
out_array = np.log2(in_array)
print ( "out_array : " , out_array)
plt.plot(in_array, in_array, color = 'blue' , marker = "*" )
plt.plot(out_array, in_array, color = 'red' , marker = "o" )
plt.title( "numpy.log2()" )
plt.xlabel( "out_array" )
plt.ylabel( "in_array" )
plt.show()
Output :
out_array : [ 0. 0.26303441 0.48542683 0.67807191 0.84799691 1. ]
References :
https://docs.scipy.org/doc/numpy-1.13.0/reference/generated/numpy.exp.html
.