Velocity Time Graphs (original) (raw)
Last Updated : 20 Jan, 2026
The velocity of an object is defined as the displacement (covered by it) per unit time in a particular direction.
- It is a vector quantity, i.e., it has both magnitude and direction.
- It is denoted by the symbol **v, has an SI Unit of m/sec, and its dimensions are [LT -1 ]
A Velocity-Time graph shows how an object's velocity changes over time when it's moving in a straight line. The graph has velocity on the vertical axis and time on the horizontal axis.
Depending upon the different types of velocities, for example, an object may have a constant velocity, increasing velocity, or decreasing velocity, it can easily be determined if the object is accelerating, decelerating, or not accelerating at all.
**Key Concepts
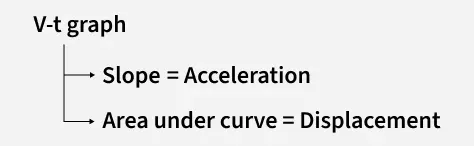
**1. The velocity–time graph provides two fundamental relationships in uniformly accelerated motion:
**2. To draw velocity-time graphs, we will use the three equations of motion:
- v = u + at
- s = ut + 1/2(at2)
- v2 = u2 + 2as
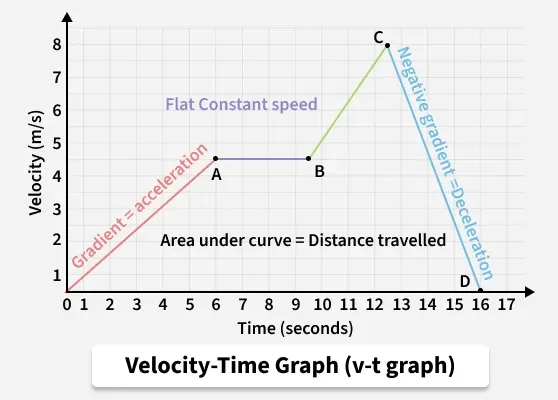
**3. The following velocity–time graph shows how these concepts apply to an object moving in a straight line:
**CASE-A [Uniform Acceleration]
Uniform acceleration means velocity changes by the _same amount in _equal time intervals, like a freely falling object, with constant acceleration****.**
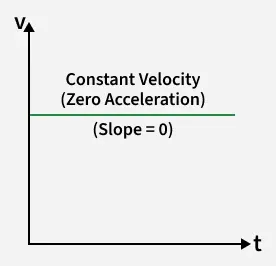
**Case A1 : V-t graph with Constant Velocity (Zero Acceleration)
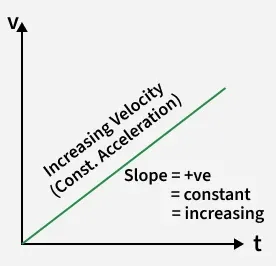
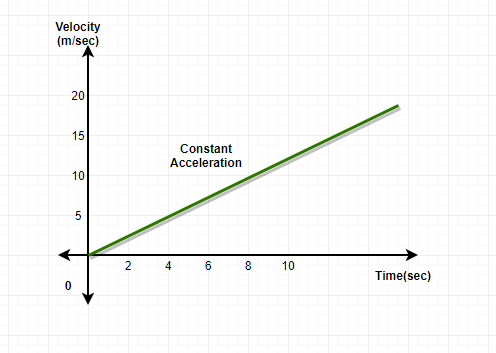
**Case A2 : V-t graph with Increasing Velocity (Constant Acceleration)
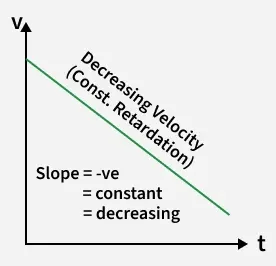
**Case A3 : V-t graph with Decreasing Velocity (Constant Retardation)
**CASE-B [Non-Uniform Acceleration]
Non-uniform acceleration means velocity changes by _unequal amounts in _equal time intervals, like a car in traffic, with changing acceleration****.**
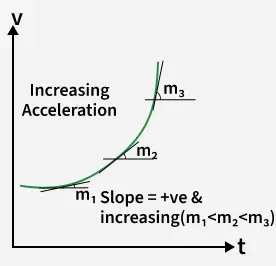
**Case B1 : V-t graph with Increasing Velocity (Increasing Acceleration)
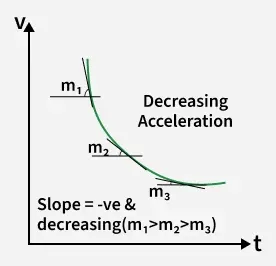
**Case B2 : V-t graph with Decreasing Velocity (Decreasing Acceleration)
**Calculation of Distance and Displacement from V-t graph
To calculate distance and displacement from a velocity-time (v-t) graph, find the area under the curve.
- **Displacement is the _net area (positive areas minus negative areas)
- **Distance is the _total area (sum of all areas, treating negative areas as positive).
Both are found by breaking the graph into shapes (triangles, rectangles, trapezoids) and adding their individual areas.
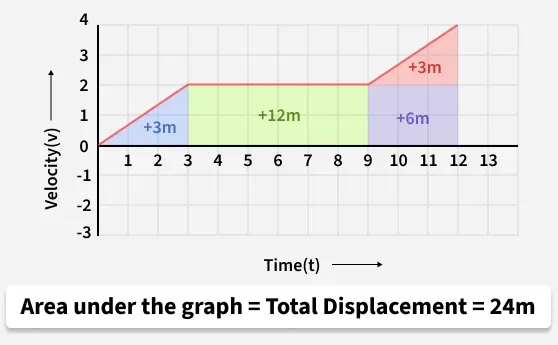
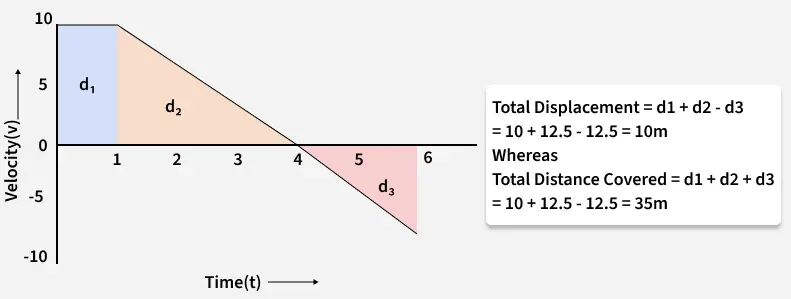
**Illustration 1: Calculation of Distance and Displacement of the following graph from 0 to 6 seconds.
Related Articles
Solved Examples:
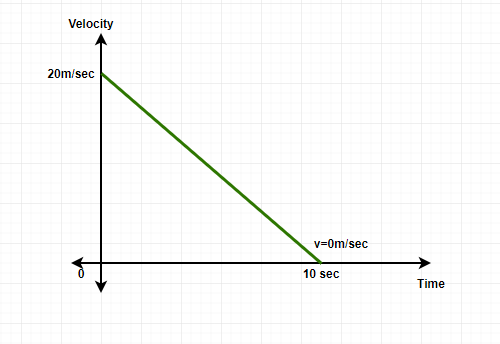
**Question 1: Draw the graph for an object starting at a velocity of 20m/sec and the final velocity becomes 0 m/sec at T=10th second. The object is decelerating in nature.
The graph will have a negative slope since the object is deceleration in nature.
Velocity-time graph
**Question 2: An object with an initial velocity of 15m/sec is decelerating and ultimately coming to a stop at T= 20 seconds, Find the Displacement covered by the object.
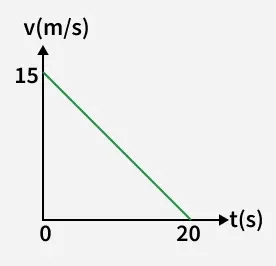
The displacement of the object can be found out by finding the area of the velocity-time graph.
Area of the right angle triangle= Displacement of the object= \frac{1}{2} × Base × Height
Displacement= \frac{1}{2}× 20× 15
Displacement = 150 meters.
**Question 3: Find the Acceleration of the object which is constant in nature, The graph for the object's velocity is given below.
The acceleration in the velocity-time graph is found out through the slope, the slope is the ratio of the value at y-axis and x-axis, solving this will easily give the value of acceleration of the object.
At time T= 8 sec, the value of the velocity of the object is 8 m/sec.
Hence, the slope of the graph at T= 10 sec will be,
Slope of the graph= Acceleration of the object = 8/10
Acceleration = 0.8 m/sec2
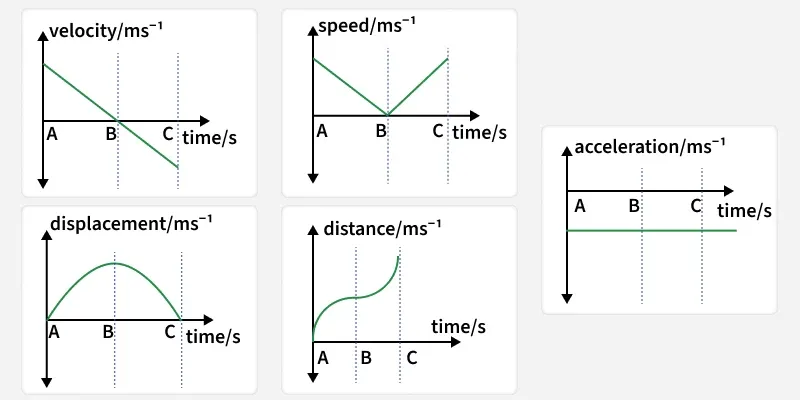
**Question 4: A Ball is thrown upwards and then after reaching a particular height it come down as shown in the figure Draw the following graph for the above case:-
- Distance - Time graph
- Displacement - Time graph
- Speed - Time graph
- Velocity - Time graph
- Acceleration -Time graph

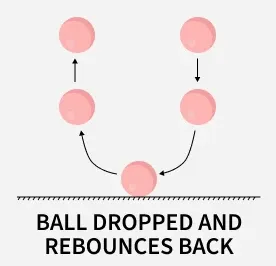
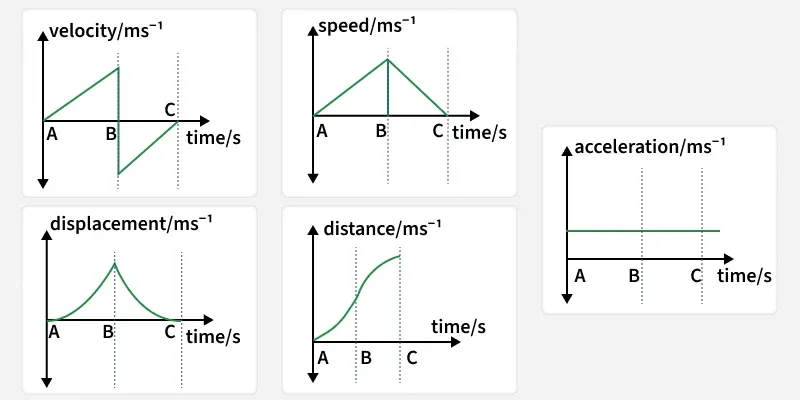
**Question 5: A Ball is dropped downwards and then after colliding with the ground it rebounds back as shown in the figure Draw the following graph for the above case:-
- Distance - Time graph
- Displacement - Time graph
- Speed - Time graph
- Velocity - Time graph
- Acceleration -Time graph
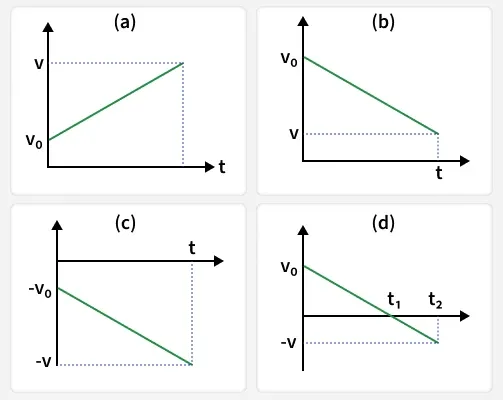
**Question 6: Draw the Following Velocity-time graph for the following motions with constant acceleration:-
- Motion in positive direction with positive acceleration
- Motion in positive direction with negative acceleration,
- Motion in negative direction with negative acceleration,
- Motion of an object with negative acceleration that changes direction at time t₁. Between times 0 to t, it moves in positive x - direction and between t, and t, it moves in the opposite direction.
Unsolved Questions
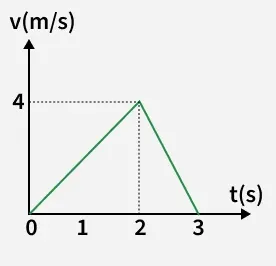
**Q1. The velocity versus time graph of a body moving in a straight line is as shown in the figure below, Find
- The distance covered by the body in 0 to 3s also
- The acceleration of the body in 0 to 2s
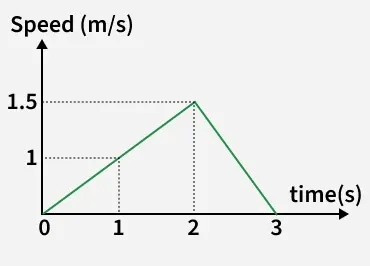
**Q2. The speed-time graph of a particle moving along a solid curve is shown below. The distance traversed by the particle from t = 0 to t = 3 is ?
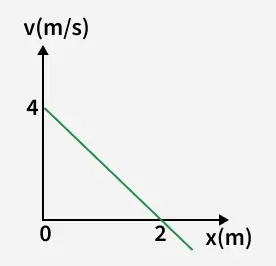
**Q3. The velocity (v) of a particle moving along x-axis varies with its position x as shown in figure. Find the acceleration (a) of particle varies with position (x)? Hint:(Find the Equation between a and x)