Acceleration Time Graphs (original) (raw)
Last Updated : 17 Jan, 2026
An Acceleration-Time graph shows how an object's acceleration changes over time when it's moving in a straight line. The graph has acceleration on the vertical axis and time on the horizontal axis.
**Key Points
- The slope of the acceleration-time graph gives Jerk (da/dt).
- The area under the acceleration-time graph represents the change in velocity.

**Acceleration-Time Graphs for Body Motion
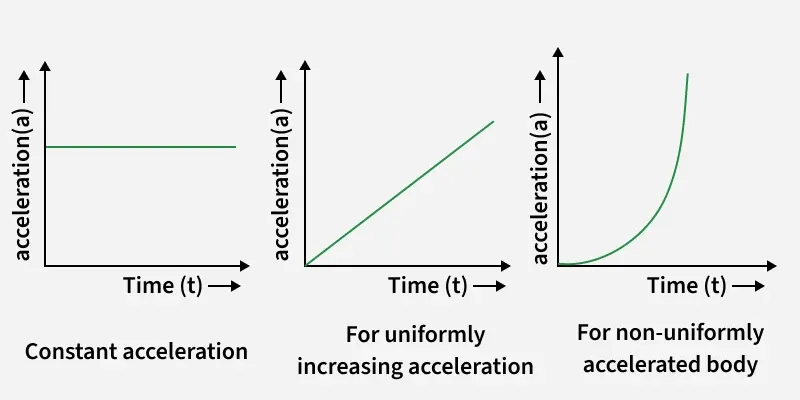
The Above Diagram shows the following cases:
- When a body is moving with constant acceleration,
- When a body is moving uniformly with increasing acceleration.
- When a body is moving non-uniformly with variable acceleration.
Acceleration vs Retardation
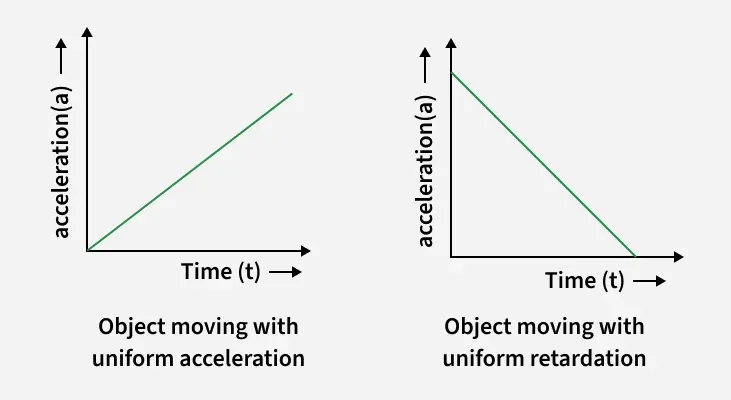
**Acceleration****:** Acceleration of a body is referred to as the rate of the change in velocity in a given period of time. It is a vector quantity and is measured in terms of m/s2.
_Acceleration = Change in velocity / time
Here, change in velocity is positive.
**Retardation: Retardation of a body is referred to as the rate of the change in velocity in a given period of time. Retardation means negative acceleration.
Retardation = Change in velocity / time
Here, change in velocity is negative.
**Also Check:
Solved Examples
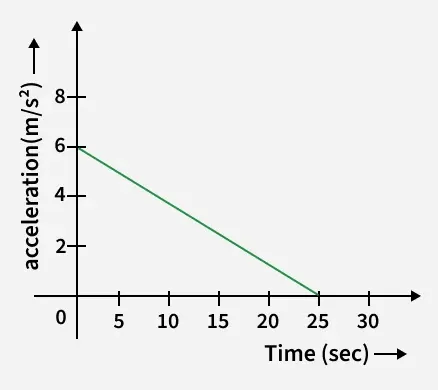
**Question 1: From the acceleration vs time graph given below, determine the change in velocity.
**Solution:
To find the change in velocity of the body we need to determine the area under the curve.
So, to find the change in the velocity of the object, we need to calculate the area of the triangle.
△v = area of triangle
= ½ × 25 × 6△v = 75 m/s.
Hence, the change in velocity is 75 m/s.
**Question 2: From the acceleration vs time graph given below, find the initial velocity of a body if its final velocity is 55 m/sec.
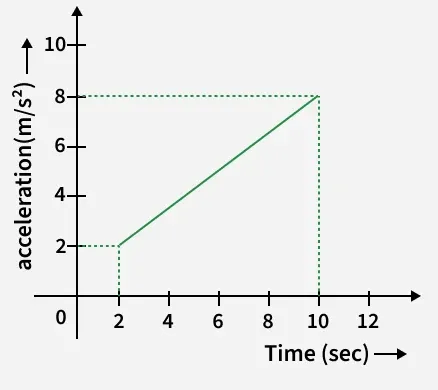
**Solution:
To find the change in velocity of the body we need to determine the area under the curve. From the graph, we can observe that it has a rectangle and a triangle. So, to find the change in the velocity of the object, we need to calculate the area of these figures.
△v = area of triangle + area of rectangle
= ½ × 8 × 6 + 2 × 8
△v = 24 + 16 = 42 m/sWe know that,
△v = final velocity - initial velocity
42 = 55 - vi
vi = 55 - 42 = 13 m/sHence, the initial velocity is 13 m/s.
**Question 3: From the acceleration vs time graph given below, determine the velocity at t = 6 sec, if v(0) = 0.
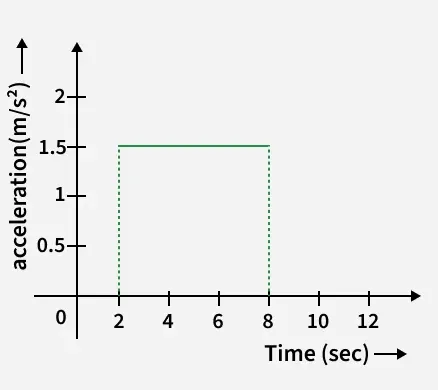
**Solution:
Acceleration is given by;
a = dv/dt
⇒ dv = (a)dtBy integrating on both sides, we get
∫dv = ∫(a) dt
⇒ v = ∫(1.5) dt
⇒ v(t) = 1.5t + c, where c is a constant
⇒ v(0) = 0
⇒ c = 0Now, v(t) = 1.5t
v(6) = 1.5 × 6 = 9 m/sHence, the velocity at t = 6 sec is 9 m/s.
**Question 4: What does a jerk in the acceleration time graph mean?
A jerk is the sudden change in the acceleration of the moving body, and the slope of the a-t graph represents jerk.
The slope of the acceleration-time graph = jerk = △a/△t
Unsolved Questions:
**Q1. Acceleration-time graph for a particle is given in figure. If it starts motion at t = 0, distance travelled in 3 s will be
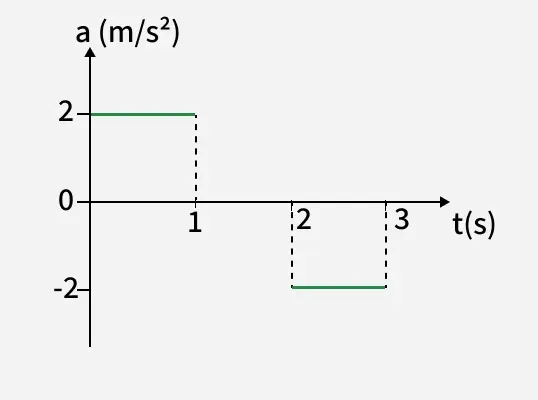
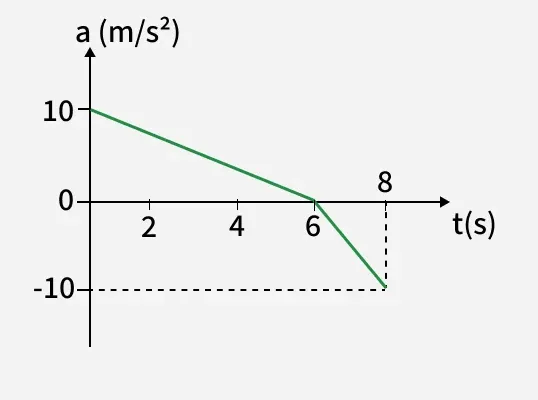
**Q2. The acceleration-time graph for a particle moving along x-axis is shown in figure. If the initial velocity of particle is -5 m/s, the velocity at t = 8 s is