Power BI Tools and Functionalities (original) (raw)
Last Updated : 20 Mar, 2026
**Power BI is a powerful Data Visualization and Business Intelligence (BI) tool developed by Microsoft. It transforms raw data from various sources into insightful and interactive business intelligence reports. With its intuitive drag-and-drop features and interactive dashboards, Power BI empowers even non-technical users to build reports and analyze data on their own.
**Navigating Power BI
Power BI offers a rich suite of tools and services to help users create creative, interactive, and intelligent business reports. Let’s explore them in detail.
Importing and Exporting Data:
Power BI allows you to import data from a wide range of sources, including CSV, Excel, SQL databases, and cloud services. Once you import your dataset, a window called the **Query Editor usually pops up automatically.
 On following the above steps, the dataset will be uploaded and a window will pop up. This window is called the **Query Editor.
**Note: If the Query Editor window does not pop up automatically. Just click on **Transform Data in the above Navigation panel.
What is Query Editor?
The Query Editor in Power BI is a data preparation tool. It acts as an intermediate data container where you can clean, transform, and format data before loading it into the Power BI data model. Using the Query Editor, you can:
This ensures your data is accurate and optimized before visualization.
Views in Power BI
Power BI provides three distinct views, accessible via the Navigation Pane:

Three Views in Power BI
Report View:
- Report view is a section of Power-BI where you can create any number of report pages with visualizations.
- This view provides a designing environment where you can move visualizations around, copy and paste, merge, and so on.
- You can add one/multiple pages here for various visualization of BI-Reports.
Data View:
- Data view is a section of Power-BI that helps you inspect, explore, and understand data.
- It's different from how you view tables, columns, and data in Power Query Editor.
- With Data view, you're looking at your data after it has been loaded into the model.
Relationship View (Model View):
- Model view shows all of the tables, columns, and relationships in your model.
- This view can be especially helpful when your model has complex relationships between many tables.
Power BI provides a variety of tools and panels to build and manage reports efficiently:
**Modelling Ribbon
- Perform calculations
- Change data types
- Format columns
- Add relationships
**Fields List
View and manage tables, columns, and fields from your data sources.
Navigation Pane
Switch between Report, Data, and Model views.
Visualization Pane
Access over 30 built-in visualizations, including:
- Stacked and Clustered Bar/Column Charts
- Line/Area Charts
- Ribbon and Waterfall Charts
- Pie Charts
- Tree Maps
- Tables and Matrices
- Python and R script visuals
You can also import custom visuals from the online Power BI marketplace.
**Some of the important built-in visualizations include:
- Stacked Bar/Column Charts
- Clustered Bar/Column Charts
- Line/Area Charts
- Ribbon Charts
- Waterfall Charts
- Tree Maps
- Tables and Matrices
- Pie Charts
- Python-Scripts
- R-Scripts
**Building Blocks of Power-BI
Power BI is built on four core building blocks, with a fifth available in the Pro version.
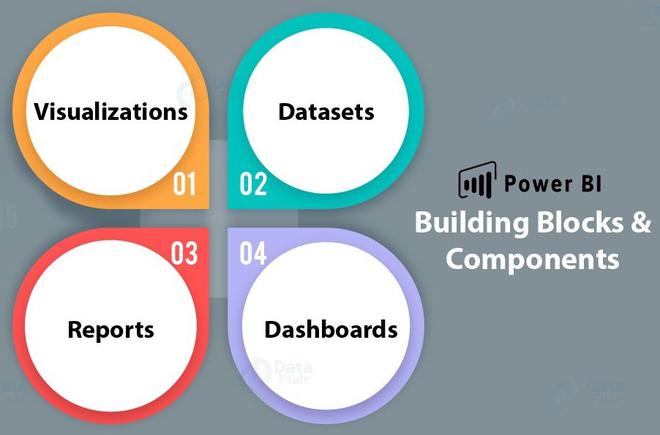
**Fact: There is a **5th Building Block known as **Tiles that is available in the **Power-BI pro version.
**Visualization

Power BI : Visualizations
A visualization is a visual representation of data, like a bar graph, pie chart, a color-coded map, or other through which you can visualize the data.
The following image shows a collection of different visualizations that are there in the Power BI.
**Datasets

Power BI : Types of Datasets
Types of Datasets
| S.no | Data Source | Description |
|---|---|---|
| 1. | Comma Separated Value (.csv) | A Comma Separated Values (.csv) file is a plain text file that contains a list of data. Every row can contain one or more values, which is separated by a comma. |
| 2. | Excel (.xlsx) | A workbook can have data entered manually or data, which is queried and loaded from external data sources. |
| 3. | Databases via SQL Server | You can connect directly to SQL Server Analysis Services Relational model databases. |
| 4. | Databases on Cloud | You can connect live to Azure SQL Database, Azure SQL Data Warehouse, etc to get databases. |
| 5. | Power BI (.pbi) | You can use Power BI Desktop to query and load data from external data sources. |
- A Dataset is a collection of data or a container of data that is used by Power BI to create visualizations.
- A Dataset is something which you import or connect to.
- Datasets can be renamed, refreshed, removes, and explored.
**Reports

Power BI : Reports
- A report is one or more pages of interactive visuals, text, and graphics that makes up a single report.
- All of the visualizations in a report come from a single dataset.
**Dashboards

Power BI : Dashboards
- A dashboard represents a customized view of some subset of the underlying dataset(s).
- A dashboard is a single canvas that has tiles, graphics, and text.
Purpose of Dashboards
Dashboards in Power BI play a crucial role:
- Provide a unified view of your business data
- Display the most critical insights at a glance
- Facilitate informed decision-making
- Keep teams on the same page