Linear Regression in Python using Statsmodels (original) (raw)
In this article, we will discuss how to use statsmodels using Linear Regression in Python.
Linear regression analysis is a statistical technique for predicting the value of one variable(dependent variable) based on the value of another(independent variable). The dependent variable is the variable that we want to predict or forecast. In simple linear regression, there's one independent variable used to predict a single dependent variable. In the case of multilinear regression, there's more than one independent variable. The independent variable is the one you're using to forecast the value of the other variable. The statsmodels.regression.linear_model.OLS method is used to perform linear regression. Linear equations are of the form:
y = mx+cm = slopec = constant
Syntax: statsmodels.regression.linear_model.OLS(endog, exog=None, missing='none', hasconst=None, **kwargs)
Parameters:
- endog: array like object.
- exog: array like object.
- missing: str. None, decrease, and raise are the available alternatives. If the value is 'none,' no nan testing is performed. Any observations with nans are dropped if 'drop' is selected. An error is raised if 'raise' is used. 'none' is the default.
- hasconst: None or Bool. Indicates whether a user-supplied constant is included in the RHS. If True, k constant is set to 1 and all outcome statistics are calculated as if a constant is present. If False, k constant is set to 0 and no constant is verified.
- **kwargs: When using the formula interface, additional arguments are utilised to set model characteristics.
Return: Ordinary least squares are returned.
Installation
pip install numpy pip install pandas pip install statsmodels
Stepwise Implementation
Step 1: Import packages.
Importing the required packages is the first step of modeling. The pandas, NumPy, and stats model packages are imported.
import numpy as np import pandas as pd import statsmodels.api as sm
Step 2: Loading data.
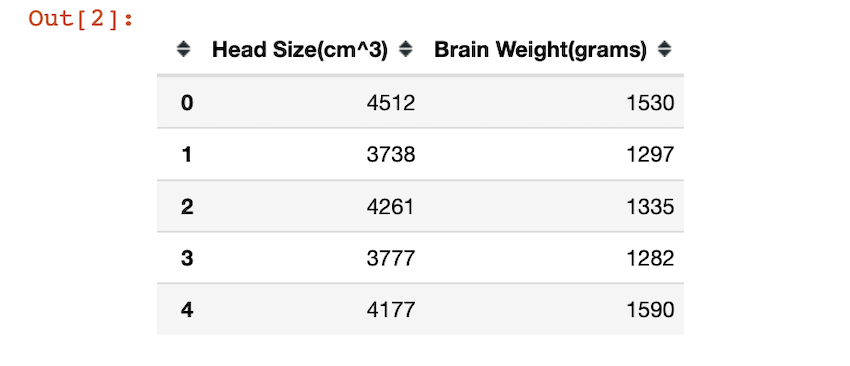
To access the CSV file click here. The CSV file is read using pandas.read_csv() method. The head or the first five rows of the dataset is returned by using the head() method. Head size and Brain weight are the columns.
Python3 `
df = pd.read_csv('headbrain1.csv') df.head()
`
The head of the data frame looks like this:
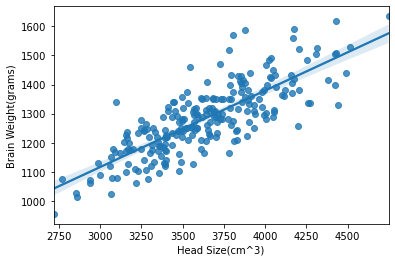
Visualizing the data:
By using the matplotlib and seaborn packages, we visualize the data. sns.regplot() function helps us create a regression plot.
Python3 `
import packages
import pandas as pd import matplotlib.pyplot as plt import seaborn as sns
df = pd.read_csv('headbrain1.csv') sns.regplot('Head Size(cm^3)', 'Brain Weight(grams)', data=df)
plt.show()
`
Output:
Step 3: Setting a hypothesis.
- Null hypothesis (H0): There is no relationship between head size and brain weight.
- Alternative hypothesis (Ha): There is a relationship between head size and brain weight.
Step 4: Fitting the model
statsmodels.regression.linear_model.OLS() method is used to get ordinary least squares, and fit() method is used to fit the data in it. The ols method takes in the data and performs linear regression. we provide the dependent and independent columns in this format :
inpendent_columns ~ dependent_column:
left side of the ~ operator contains the independent variables and right side of the operator contains the name of the dependent variable or the predicted column.
Python3 `
df.columns = ['Head_size', 'Brain_weight'] model = smf.ols(formula='Head_size ~ Brain_weight', data=df).fit()
`
Step 5: Summary of the model.
All the summary statistics of the linear regression model are returned by the model.summary() method. The p-value and many other values/statistics are known by this method. Predictions about the data are found by the model.summary() method.
Python3 `
print(model.summary())
`
Code Implementation:
Python3 `
import packages
import numpy as np import pandas as pd import statsmodels.formula.api as smf
loading the csv file
df = pd.read_csv('headbrain1.csv') print(df.head())
fitting the model
df.columns = ['Head_size', 'Brain_weight'] model = smf.ols(formula='Head_size ~ Brain_weight', data=df).fit()
model summary
print(model.summary())
`
Output:
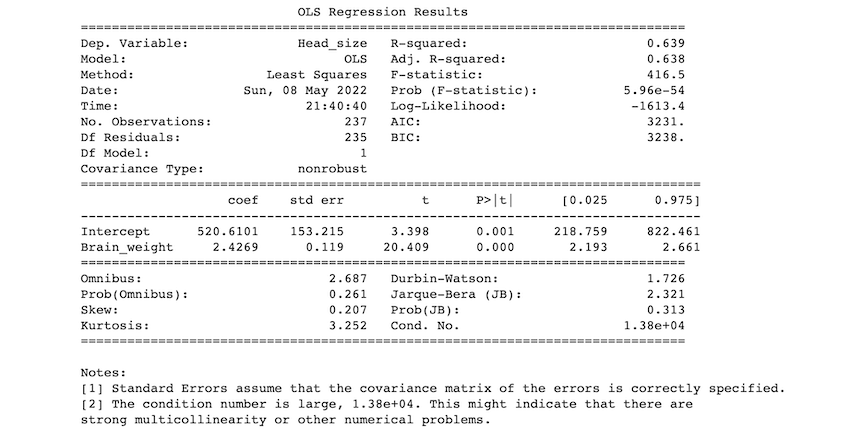
Description of some of the terms in the table :
- R- squared value: R-squared value ranges between 0 and 1. An R-squared of 100 percent indicates that all changes in the dependent variable are completely explained by changes in the independent variable(s). if we get 1 as an r-squared value it means there's a perfect fit. In our example, the r-squared value is 0.638.
- F- statistic: The F statistic simply compares the combined effect of all variables. In simplest terms, reject the null hypothesis if your alpha level is greater than your p-value.
- coef: the coefficients of the independent variables in the regression equation.
Our predictions:
If we take our significance level (alpha) to be 0.05, we reject the null hypothesis and accept the alternative hypothesis as p<0.05. so, we can say that there is a relationship between head size and brain weight.