math.cos() in Python (original) (raw)
Last Updated : 11 Jul, 2025
**math.cos() function in Python is part of the built-in math module, which provides access to mathematical functions. The math.cos() function is used to calculate the cosine of an angle, which is a fundamental trigonometric function widely used in various fields like physics, engineering and computer graphics.
**Example: Cosine Calculation Using math.cos()
Python `
import math
a = math.pi / 6 # angle pi/6 radians
returning the value of cosine of pi / 6
print("The value of cosine of pi / 6 is : ", end="") print(math.cos(a))
`
Output
The value of cosine of pi / 6 is : 0.8660254037844387
**Explanation:
- This code calculates the cosine of the angle pi/6 using Python’s math.cos() function.
- math.cos(a) computes the cosine of the angle a (which is pi/6 radians).
Syntax
math.cos(x)
Parameters
- **x: This parameter represents the angle in radians for which the cosine value is to be calculated.
Return Value
The math.cos() function returns the cosine of the given angle in radians. The value will always be between -1 and 1, inclusive.
Examples of math.cos()
**1. Cosine of Multiple Angles
This example calculates the cosine of several angles ranging from **0 to **2π (full circle) in steps of π/4.
Python `
import math
Angles from 0 to 2π in steps of π/4
angles = [0, math.pi/4, math.pi/2, math.pi, 3math.pi/2, 2math.pi]
Calculate and print the cosine for each angle
for angle in angles: print(f"Cosine of {angle} radians: {math.cos(angle)}")
`
**Output
Cosine of 0 radians: 1.0
Cosine of 0.7853981633974483 radians: 0.7071067811865476
Cosine of 1.5707963267948966 radians: 6.123233995736766e-17
Cosine of 3.141592653589793 radians: -1.0Cosine of 4.71238898038469 radians: -1.8369701987210297e-16
Cosine of 6.283185307179586 radians: 1.0
**Explanation:
- This code calculates the cosine for angles 0, π/4, π/2, π, 3π/2, and 2π.
- It prints the cosine value for each angle.
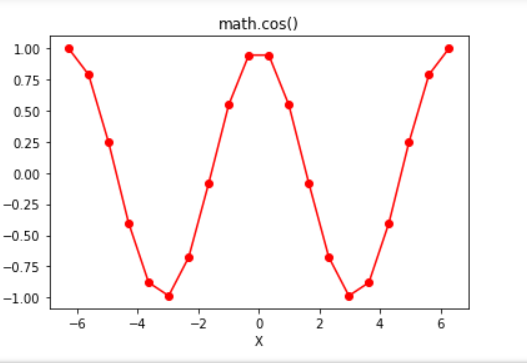
**2. Graphical Representation of math.cos() Function
Python `
import math import numpy as np import matplotlib.pyplot as plt
Generate angles from -2π to 2π
in_array = np.linspace(-(2 * np.pi), 2 * np.pi, 20) # Generate angles from -2π to 2π
List to store cosine values
out_array = []
for i in range(len(in_array)): out_array.append(math.cos(in_array[i]))
print("in_array : ", in_array) print("\nout_array : ", out_array)
Plot the graph for cosine values
plt.plot(in_array, out_array, color='red', marker="o") plt.title("math.cos()") plt.xlabel("X") plt.ylabel("Y") plt.show()
`
**Output
in_array : [-6.28318531 -5.62179738 -4.96040945 -4.29902153 -3.6376336 -2.97624567
-2.31485774 -1.65346982 -0.99208189 -0.33069396 0.33069396 0.99208189
1.65346982 2.31485774 2.97624567 3.6376336 4.29902153 4.96040945
5.62179738 6.28318531]
out_array : [1.0, 0.7891405093963934, 0.2454854871407988, -0.40169542465296987,
-0.8794737512064891, -0.9863613034027223, 0.6772815716257412,
-0.08257934547233249, 0.5469481581224268, 0.9458172417006346,
0.9458172417006346, 0.5469481581224268, 0.0825793454723316, -0.6772815716257405,
-0.9863613034027223, -0.8794737512064893, -0.40169542465296987,
0.2454854871407988, .7891405093963934, 1.0]