Kendall Correlation Testing in R Programming (original) (raw)
Last Updated : 6 Aug, 2025
Kendall Correlation is a non-parametric test that measures how two variables are related by comparing the order or ranks of the data. It works well even when the data is not normally distributed or contains outliers.
**Formula for Kendall’s Tau:
[\tau = \frac{\text{Number of concordant pairs} - \text{Number of discordant pairs}}{\frac{n(n - 1)}{2}}]
**Parameters:
- **Concordant pair: When both x and y increase or decrease together
- **Discordant pair: When one increases while the other decreases
- n: Total number of observations
Implementation of Kendall Correlation Testing in R Programming
We are performing Kendall correlation testing using R Programming Language to measure the strength and direction of a monotonic relationship between two variables.
**1. Creating a Sample Dataset
We are generating a sample dataset with two numeric variables.
- **set.seed: Sets the seed value to make the results reproducible.
- **c: Combines values into a numeric vector.
- **data.frame: Creates a structured dataset with columns. R `
set.seed(123) x <- c(12, 25, 35, 47, 52, 68, 70, 85, 90, 100) y <- c(15, 22, 37, 40, 48, 60, 67, 80, 95, 105) data <- data.frame(x, y)
`
**2. Computing Kendall Correlation using cor Function
We are calculating Kendall correlation using the cor function by specifying the method as "kendall".
- **cor: Computes the correlation coefficient between two numeric vectors.
- **method: Specifies which correlation method to use, here it is "kendall". R `
kendall_corr <- cor(data$x, data$y, method = "kendall") kendall_corr
`
**Output:
1
**3. Performing Hypothesis Testing using cor.test Function
We are performing hypothesis testing to determine if the correlation is statistically significant.
- **cor.test: Performs a statistical test for correlation between two variables.
- **p-value: Indicates the statistical significance of the result.
- **tau: Refers to the Kendall correlation coefficient. R `
kendall_test <- cor.test(data$x, data$y, method = "kendall") kendall_test
`
**Output:
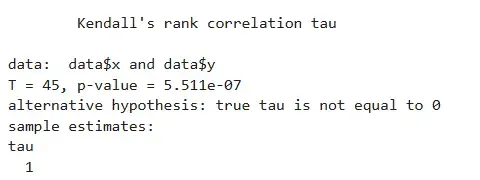
Output
**4. Visualizing Kendall Correlation using ggpubr
We are plotting the data and displaying Kendall’s tau on the scatter plot using the ggpubr package.
- **library: Loads the specified R package into the session.
- **ggscatter: Creates a scatter plot with optional regression line and correlation display.
- **add: Adds a regression line to the plot.
- **conf.int: Displays the confidence interval around the regression line.
- **cor.coef: Displays the correlation coefficient on the plot.
- **cor.method: Specifies which correlation method to use.
- **xlab and ylab: Sets the labels for the axes.
- **title: Sets the title of the plot. R `
library(ggpubr) ggscatter(data, x = "x", y = "y", add = "reg.line", conf.int = TRUE, cor.coef = TRUE, cor.method = "kendall", xlab = "X Values", ylab = "Y Values", title = "Kendall Correlation Plot")
`
**Output:

Kendall Correlation Testing in R Programming
This will produce a scatter plot with a trendline and display the Kendall correlation coefficient.