Skewness in R Programming (original) (raw)
Last Updated : 29 Apr, 2026
Skewness is a statistical numerical method to measure the asymmetry of the distribution or data set. It tells about the position of the majority of data values in the distribution around the mean value. It is essential to several disciplines, including data analysis, social sciences, economics and finance.
- **Positive Skewness (Right-Skewed): The tail on the right side of the distribution is longer or fatter. Mean > Median.
- **Negative Skewness (Left-Skewed): The tail on the left side is longer or fatter. Mean < Median.
- **Zero Skewness (Symmetrical): The distribution is symmetrical, Mean = Median.
Mathematical Definition of Skewness
\text{Skewness} = \frac{n}{(n-1)(n-2)} \sum_{i=1}^{n} \left(\frac{x_i - \bar{x}}{s}\right)^3
**Where:
- n is the number of observations,
- x_i is the i^{th} observation.
- \bar{x} is the sample mean.,
- s is the sample standard deviation.
**Interpretation of Skewness Value:
**Skewness > 0 indicates positive skewness.
**Skewness < 0 indicates negative skewness.
**Skewness = 0 indicates no skewness (symmetrical distribution).
Types of Skewness in R
Now we will discuss 3 types of skewness values on the basis of which the asymmetry of the graph is decided. These are as follows:
1. Positive Skewness
Positive skewness refers to distributions where the tail extends towards higher values. In such cases, mean is typically greater than median due to the right tail pulling the average upward
R `
x <- c(40, 41, 42, 43, 50) hist(x)
`
**Output:
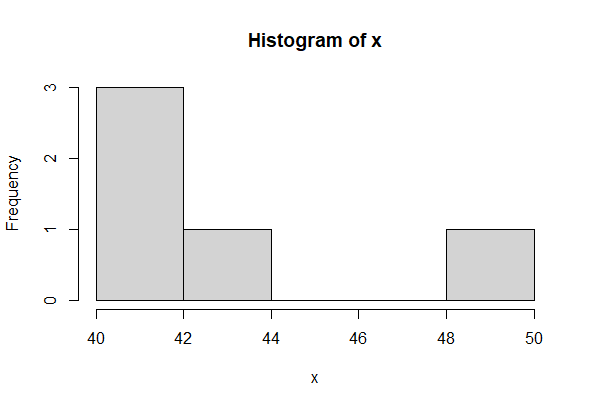
Positive Skewness
2. Negative Skewness
Negative skewness refers to distributions where the tail extends towards lower values. mean is typically less than median due to the left tail pulling the average downward
R `
x <- c(10, 11, 21, 22, 23, 25) hist(x)
`
**Output:
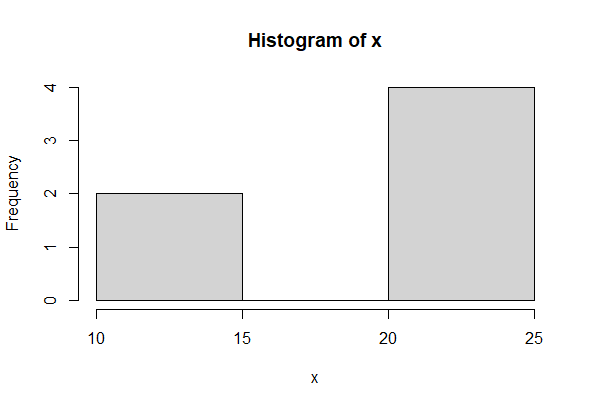
Negatively Skewness
A histogram showing negative skewness, with a tail extending towards lower values.
3. Zero Skewness
Zero skewness indicates a symmetrical distribution, the mean and median are approximately equal.
R `
set.seed(123) x <- rnorm(50, 10, 10) hist(x)
`
**Output:
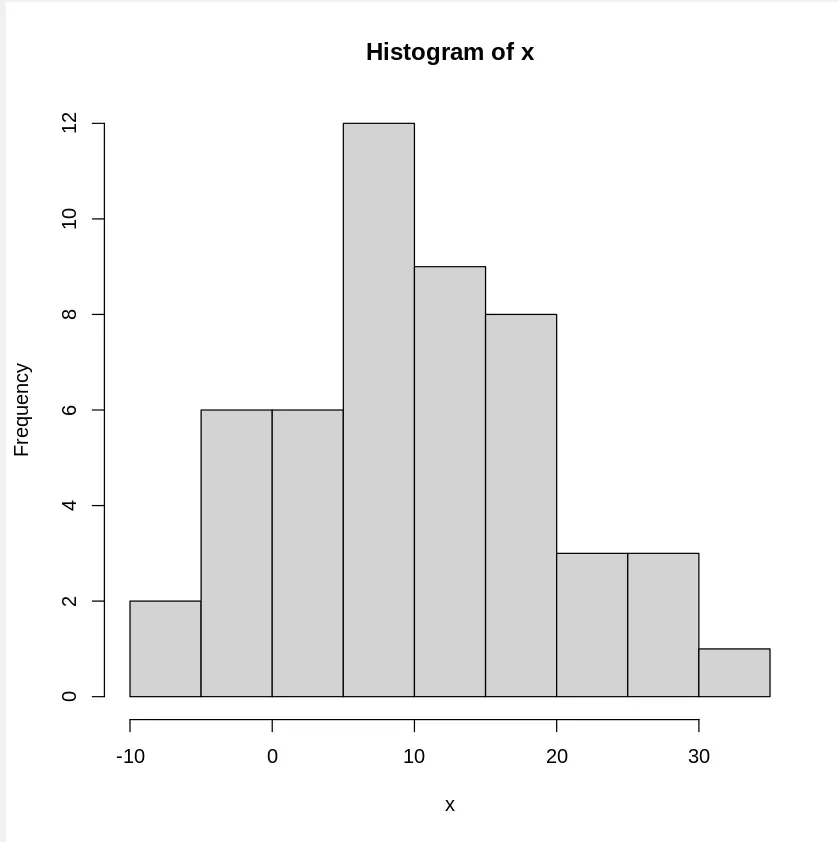
Zero Skewness
Different Methods to Calculate Skewness in R
R language provides multiple ways to calculate skewness, including base R functions, specialized packages and custom implementations.\
Note: Different functions may use slightly different formulas to calculate skewness (e.g., sample vs population skewness or bias correction).
As a result, the skewness values may vary slightly across methods such as manual calculation, e1071, and moments packages.
1. Using Base R
While base R does not have a built-in skewness function, we can calculate it manually:
R `
data <- c(2, 3, 5, 6, 8, 9, 12, 15, 18, 21)
n <- length(data) mean_data <- mean(data) sd_data <- sd(data)
skewness_value <- (n * sum((data - mean_data)^3)) / ((n - 1) * (n - 2) * sd_data^3) print(skewness_value)
`
**Output:
[1] 0.5389304
2. Using the e1071 Package
The e1071 package provides skewness() function to calculate skewness.
R `
install.packages("e1071") library(e1071)
data <- c(2, 3, 5, 6, 8, 9, 12, 15, 18, 21)
skewness_value <- skewness(data) print(skewness_value)
`
Output:
[1] 0.3880299
3. Using the moments Package
Another package that can be used for calculating skewness is moments. We can also use skewness() function to get the skewness value for our data.
R `
install.packages("moments") library(moments)
data <- c(2, 3, 5, 6, 8, 9, 12, 15, 18, 21)
skewness_value <- skewness(data) print(skewness_value)
`
Output:
[1] 0.454466
This method is better for small sample.
Importance of Skewness
Here are some of the main points highlighting the importance of skewness.
- **Normality Assumption: Many statistical methods, like t-tests and ANOVA, assume data is normally distributed. Skewness can indicate departures from normality.
- **Impact on Mean and Median: In skewed distributions, the mean is pulled towards the tail, making the median a better measure of central tendency.
- **Interpretation in Data Analysis: Understanding the skewness of your data can influence decisions in model selection, data transformation and interpretation of results.