Package e1071 in R (original) (raw)
Last Updated : 23 Jul, 2025
The e1071 package in R provides simple implementations of machine learning methods like SVM, Naive Bayes, k-means and fuzzy c-means, along with tools for Fourier transforms and parameter tuning. It's useful for both supervised and unsupervised learning.
Key Features of the e1071 Package
The e1071 package provides a range of machine learning algorithms and statistical methods.
**1. Support Vector Machines (SVM):
- Provides both classification and regression capabilities.
- Implements kernel tricks for handling non-linearly separable data.
- Supports tuning of hyperparameters to optimize model performance.
**2. Naive Bayes Classifier:
- A probabilistic model based on Bayes' Theorem.
- Assumes independence between features which simplifies the computation.
- Highly effective for text classification and other complex tasks despite its simplicity.
**3. Clustering Algorithms:
- **K-means Clustering: Aims to partition observations into clusters where each observation belongs to the cluster with the nearest mean.
- **Fuzzy C-means Clustering: Similar to k-means but allows points to belong to multiple clusters with varying degrees of membership.
Installation of the e1071 Package
To install the e1071 package, we can use the following command in R.
install.packages("e1071")
**Support Vector Machines (SVM)
Support Vector Machines (SVM) are a set of supervised learning methods used for classification, regression and outliers detection. The goal of SVM is to find the optimal hyperplane that maximally separates the classes in the feature space. In cases where classes are not linearly separable, SVM can employ a kernel trick to map data into a higher-dimensional space where a separating hyperplane can be found.
- **svm(): Fits a Support Vector Machine model to the data.
- **predict(): Predicts labels or values using the fitted SVM model.
- **tune(): Tunes the hyperparameters of the SVM to find the optimal model. R `
library(e1071)
data(iris)
svm_model <- svm(Species ~ ., data = iris, kernel = "radial")
predictions <- predict(svm_model, iris)
table(Predicted = predictions, Actual = iris$Species)
`
**Output:
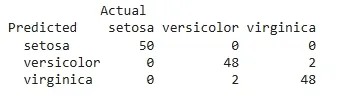
Output
**Naive Bayes Classifier
The Naive Bayes classifier is a probabilistic machine learning algorithm based on Bayes' Theorem that assumes independence between features and is used to classify data by selecting the class with the highest posterior probability.
- **naiveBayes(): Trains a Naive Bayes classifier.
- **predict(): Predicts the class labels for new data. R `
library(e1071)
data(iris)
nb_model <- naiveBayes(Species ~ ., data = iris)
predictions <- predict(nb_model, iris)
table(Predicted = predictions, Actual = iris$Species)
`
**Output:
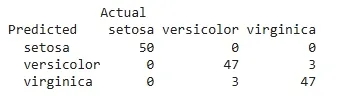
Output
**Clustering Algorithms
Clustering is an unsupervised learning task that involves grouping a set of objects in such a way that objects in the same group (called a cluster) are more similar to each other than to those in other groups.
- **K-means Clustering****:** Aims to partition
nobservations intokclusters in which each observation belongs to the cluster with the nearest mean. - **Fuzzy C-means Clustering****:** Similar to k-means, but allows each point to belong to multiple clusters with varying degrees of membership. R `
library(e1071)
data(iris)
set.seed(123) kmeans_result <- kmeans(iris[, -5], centers = 3)
kmeans_result$centers
`
**Output:
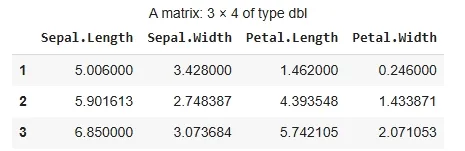
Output
**Miscellaneous Functions
Miscellaneous functions cover key concepts in signal processing, such as Fourier Transforms and parameter tuning.
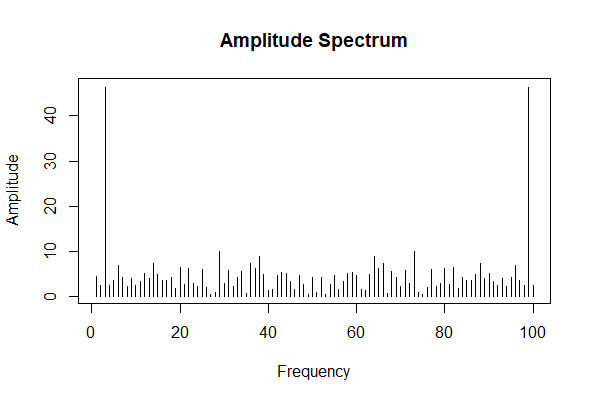
- **Fourier Transform: The FFT algorithm computes the Discrete Fourier Transform (DFT) to analyze signals in the frequency domain.
- **Mod Function: The **Mod() function calculates the modulus of a complex number, often used to extract the amplitude from the FFT result. R `
library(e1071)
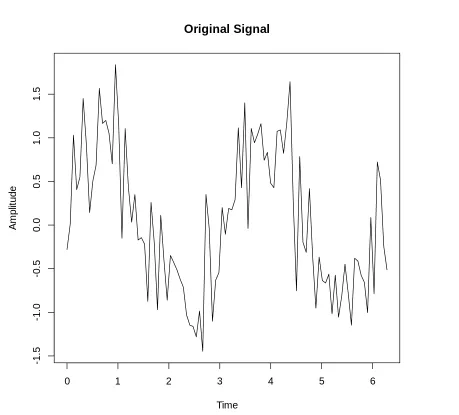
set.seed(123) time <- seq(0, 2*pi, length.out = 100) signal <- sin(2 * time) + 0.5 * rnorm(100)
fft_result <- fft(signal)
amplitude <- Mod(fft_result)
plot(time, signal, type = "l", main = "Original Signal", xlab = "Time", ylab = "Amplitude")
plot(1:length(amplitude), amplitude, type = "h", main = "Amplitude Spectrum", xlab = "Frequency", ylab = "Amplitude")
`
**Output:
Package e1071
Package e1071
The first plot shows the original signal, while the second plot shows the amplitude spectrum which helps in identifying the dominant frequencies in the signal.