FAP-1 Association with Fas (Apo-1) Inhibits Fas Expression on the Cell Surface (original) (raw)
Abstract
As revealed by intracellular pools of nonactive Fas (Apo-1), export of Fas to the cell surface is often impaired in human tumors, thereby inactivating Fas ligand-mediated apoptosis. Here, we demonstrate that association with Fas-associated phosphatase 1 (FAP-1) attenuates Fas export to the cell surface. Forced expression of FAP-1 reduces cell surface Fas levels and increases the intracellular pool of Fas within the cytoskeleton network. Conversely, expression of dominant-negative forms of FAP-1, or inhibition of FAP-1 expression by short interfering RNA, efficiently up-regulates surface expression of Fas. Inhibition of Fas surface expression by FAP-1 depends on its association with the C terminus of Fas. Mutation within amino acid 275 results in decreased association with FAP-1 and greater export of Fas to the cell surface in melanomas, normal fibroblasts, or Fas null cells. Identifying the role of FAP-1 in binding to, and consequently inhibition of, Fas export to the cell surface provides novel insight into the mechanism underlying the regulation of Fas trafficking, which is commonly impaired in advanced tumors with FAP-1 overexpression.
Common to advanced human tumors is a marked decrease in, even the complete disappearance of, the expression of Fas receptor (Apo-1; CD95) on the cell surface, where it is required to initiate the apoptosis cascade following its association with Fas ligand (FasL). Effective Fas-mediated death signaling requires the recruitment of FADD and caspase-8 to the Fas receptor, thereby assembling the death-inducing signaling complex (24, 31). It has been shown that in some cases the loss of Fas surface expression can be attributed to transcriptional silencing of the Fas promoter by cooperation between Stat3 and c-Jun (19) and that such cooperation is regulated by PI3K signaling (22). However, it has been noted that a portion of tumors that express Fas retain it within cytoplasmic pools rather than on the cell surface (8, 16). Here, we demonstrate that Fas trafficking is regulated by Fas-associated phosphatase 1 (FAP-1; synonyms, protein tyrosine phosphatase nonreceptor type 13 [PTPN13] and hPTP1E/PTPL1/PTP-BAS).
FAP-1 is a 270-kDa protein containing an ezrin-like cytoskeleton binding domain, a leucine zipper motif, and six PSD95/Dlg/Z-1 homology (PDZ) domains which is widely expressed in almost all tissues (7, 29, 34, 36). FAP-1 has been implicated in the suppression of Fas-mediated apoptosis (28, 36), which requires functional interaction of either the third or the fifth PDZ domain of FAP-1 with the extreme C-terminal domain of Fas (35, 36, 47). However, the mechanisms by which FAP-1 inhibits Fas-mediated death signaling are still unknown.
Colocalization of FAP-1 with Fas protein within the Golgi apparatus has been observed in pancreatic cancer cells, implying that FAP-1 may be involved in regulating Fas processing (45). Interestingly, increased Fas translocation from the Golgi apparatus to the cell membrane can be induced upon cellular treatment, as seen in hepatocytes that were exposed to bile salts (41). An adenovirus infection that leads to forced degradation of Fas by the adenovirus E3 proteins also results in down-regulation of Fas surface expression (14, 43).
Elevated levels of FAP-1 expression have been reported in various types of human cancer, including colon, pancreatic, hepatocellular, hematological, and ovarian cancers (4, 13, 26, 27, 28, 30, 42, 45). Overall, the level of FAP-1 expression positively correlates with the resistance of human tumors to FasL-mediated apoptosis (28, 30).
As a protein tyrosine phosphatase, FAP-1 is expected to alter tyrosine phosphorylation of its associated substrates. Although such data are not yet available for human cells, the mouse homologue of FAP-1 (PTP-BL phosphatase) dephosphorylates phosphoephrin B ligands following their phosphorylation by Src kinases (46). In the case of Fas, information about its own phosphorylation is very limited, although several studies have implicated Fas phosphorylation as an important regulatory event for its activities. For example, tyrosine kinases, such as Lyn, were implicated in the generation of a Fas receptor-linked transmembrane death signal in eosinophils (40). A physical interaction between Fas and the tyrosine kinase Fyn also has been reported (5).
Here, we demonstrate that FAP-1 association with Fas inhibits its export to the cell surface. The implication of our findings for down-regulation of Fas death signaling in human tumors is discussed.
MATERIALS AND METHODS
Cell lines.
Human melanoma cell lines, TIG3 human embryonic lung fibroblasts, and HeLa cells were maintained in culture in Dulbecco's modified Eagle's medium supplemented with 10% fetal bovine serum as previously described (21). Mouse embryo fibroblasts prepared from Fas null mice were generated according to standard protocols, followed by their immortalization according to the protocol of Aaronson and Todaro (1).
Plasmid constructs.
The original human Apo-1/Fas cDNA was recloned into a pEF-GFP plasmid. Mutations within this basal sequence were generated using the Quick Change kit (Stratagene, La Jolla, Calif.). In all cases, the integrity of modified or cloned constructs was confirmed via sequencing. The FAP-1 expression vector and its dominant-negative variants, FAP-1ΔCD (without the catalytic domain) and FAP-1ΔPDZ3 (without the PDZ3 domain, which binds Fas), have been previously described (17, 28). Fas was mutated on Y275 to histidine or aspartic acid and on Y75 to histidine, using a Quick Change site-directed mutagenesis kit. All constructs were sequenced to assure the integrity of mutations.
Transfection, β-galactosidase assay, and FACS analysis.
Transient transfection of the Fas-green fluorescent protein (GFP) construct (0.2 μg) together with different expression vectors (0.7 μg) and pCMV-βgal (0.1 μg) into 3 × 10⁵ cells was performed using Lipofectamine (Invitrogen, Carlsbad, Calif.). Eight to 30 h after transfection, surface Fas expression in GFP-positive cells was determined by staining them with phycoerythrin (PE)-anti-Fas monoclonal antibodies (MAbs) and by flow cytometry. Two parameters, the percentage and number of Fas+ GFP+ cells and the mean fluorescence intensity (MFI) of surface Fas levels, were used to evaluate surface Fas-GFP translocation. The specific activity of β-galactosidase was used for normalization of the efficiency of transfection in fluorescence-activated cell sorter (FACS) data.
Confocal immunofluorescence.
Fas-GFP-transfected cells grown on coverslips were fixed in 2% _para_-formaldehyde in phosphate-buffered saline (PBS). The cells were then washed three times in PBS followed by permeabilization in 0.1% Triton X-100 in PBS for 10 min with three additional 5-min washes in PBS. The cells were incubated with primary antibodies (Abs) for 1 h at room temperature. After additional washes, the cells were incubated with the secondary Abs labeled with Texas Red. The cells were washed several times, and the coverslips were mounted on glass slides in Vectashield (Vector Laboratory).
Treatment and apoptosis studies.
Surface expression of endogenous Fas was determined using anti-Fas-PE Abs (Pharmingen). Cells were permeabilized using a Cytofix/cytoperm kit (Pharmingen) for detection of internal Fas levels via FACS. The cells were exposed to FasL as previously described (19, 20). FasL (25 to 50 ng/ml) was used in combination with cycloheximide (10 μg/ml). For apoptosis studies, cells were stained with propidium iodide (50 μg/ml) and analyzed by flow cytometry using a FACS Calibur flow cytometer (Becton Dickinson) with the CellQuest program. Apoptosis was assessed by quantifying the percentage of hypodiploid nuclei undergoing DNA fragmentation (32).
Western blot analysis and immunoprecipitation.
RIPA buffer (PBS, 1% NP-40, 0.5% sodium deoxycholate, 0.1% SDS, and protease inhibitor cocktail) was used for the preparation of total cell extracts. Alternatively, Triton X-100-soluble and -insoluble fractions were prepared. To this end, proteins that were soluble in 1% Triton X-100 were separated from the insoluble fraction, which was then solubilized with 1% SDS in the presence of DNase (5 μg/μl) for 30 min at 37°C. The cell lysates (50 to 100 μg of protein) were resolved by SDS- 8 or 10% polyacrylamide gel electrophoresis and processed according to the standard protocols. The primary Abs used were rabbit anti-FAP-1 or monoclonal anti-Fas (Pharmingen), anti-β-actin (Sigma), and anti-c-Src (UBI) (1:1,000 to 1:5,000). The secondary Abs (anti-rabbit or anti-mouse) were conjugated to horseradish peroxidase (dilution, 1:5,000). Signals were detected using the ECL system (Amersham). Immunoprecipitation was carried out by standard methods (20).
RT-PCR analysis.
Reverse transcription (RT)-PCR was carried out on cDNA prepared from the RNA using primers designed to amplify 499 bp of Fas promoter and 250 bp of the GAPDH (glyceraldehyde-3-phosphate dehydrogenase) cDNAs. Amplifications were carried out for 17 cycles in the presence of [α-32P]dCTP (1 min each at 94, 55, and 72°C), followed by separation on polyacrylamide gels and autoradiography.
FAP-1 suppression by RNAi.
The p SUPER retro (pRS) RNA interference (RNAi) system was used for the production of small RNAi transcripts to suppress FAP-1 gene expression as previously described (10, 11); 19-mer FAP-1-based oligonucleotides in both sense and antisense orientations (FAP-1 RNAi, 653 GCCAGGCTATTCGAGATCG 671; control RNAi [of a different region from FAP-1], 1190 GTTCTTTGGACCGAATCCG 1208; based on FAP-1 mRNA [GenBank accession no. NM_080683]) were synthesized and cloned into pRS. A FAP-1 BLAST search confirmed the specificity of the selected oligonucleotides, and sequencing of cloned constructs confirmed their integrity. TIG3 cells (3 × 10⁵) were cotransfected with 1 μg of pRS-FAP-1 RNAi and 0.2 μg of Fas-GFP or GFP, using Lipofectamine. Analysis of FAP-1 and Fas expression was carried out 48 h later as detailed in Results.
RESULTS
Intracellular pools of Fas coincide with expression of FAP-1.
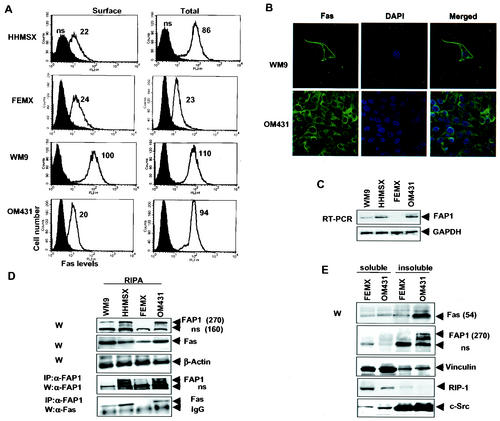
To elucidate the possible mechanism underlying impaired Fas export, we studied melanoma cell lines exhibiting marked decreases in cell surface expression levels of Fas despite its intracellular expression. Comparison of the overall versus cell surface contents of Fas by FACS analysis identified the melanoma cell line OM431 as one that exhibits stronger intracellular expression than surface expression, whereas the melanoma cell line FEMX revealed poor expression both internally and externally. In contrast, most of the Fas expressed in the WM9 melanoma cells was found on the cell surface (Fig. 1A).
FIG. 1.
Fas and FAP-1 expression in human melanoma cell lines. (A) Surface and total (after cell permeabilization) Fas levels were determined by staining with PE-conjugated anti-human Fas MAbs and flow cytometry of melanoma cells. (B) Immunostaining of endogenous Fas in WM9 and OM431 melanoma cells. Anti-Fas MAb and fluorescein isothiocyanate-labeled secondary Abs were used. DAPI was used for nuclear staining. The merged images were obtained by confocal microscopy. (C) RT-PCR analysis of FAP-1 mRNA levels in human melanomas. GAPDH mRNA levels were used as an internal control. (D) Western blot analysis (W) of FAP-1 and Fas levels in melanomas. The positions of FAP-1 and of a nonspecific form (ns) recognized by these Abs are indicated by arrowheads. The β-actin level was used as a loading control. Fas and FAP-1 proteins prepared from the indicated melanoma cell lines using RIPA buffer were subjected to coimmunoprecipitation (IP) with Abs to FAP-1 followed by immunoblot analysis with Abs to Fas and FAP-1. Apparent molecular masses (kilodaltons) are in parentheses. (E) Western blot analyses of 1% Triton X-100-soluble and -insoluble fractions from FEMX and OM431 cells were performed using Abs against Fas, FAP1, vinculin, RIP-1, and Src.
Immunohistochemistry with anti-Fas- fluorescein isothiocyanate Ab and DAPI (4′,6′-diamidino-2-phenylindole) nuclear staining further demonstrated that endogenous Fas is mostly within intracellular pools in OM431 melanoma cells as opposed to WM9 cells, in which it is primarily on the cell surface (Fig. 1B). The overall levels of Fas expression recorded via FACS analysis were also reflected in Western blot analysis (WM9 > OM431 > HHMSX > FEMX cells with regard to Fas expression [Fig. 1D]). It should be noted that Fas protein is highly glycosylated in melanomas, and the major band has an apparent mass of 54 kDa.
Earlier reports pointed to the correlation between FAP-1 overexpression and decreased Fas-dependent death signaling (28, 30). Monitoring FAP-1 expression by RT-PCR (Fig. 1C) and Western blotting (Fig. 1D) revealed low levels of FAP-1 expression in WM9 cells (in which most Fas was found on the cell surface) and high levels of FAP-1 expression in OM431 and HHMSX cells (which exhibit internal and low cell surface Fas expression). FEMX cells (in which total Fas expression is low) were found to exhibit very low levels of FAP-1 expression. These observations point to an inverse correlation between surface Fas and FAP-1 expression.
A series of immunoprecipitation assays revealed an association of FAP-1 with Fas that coincides with the overall level of FAP-1 expressed (Fig. 1D) and confirms the findings of earlier studies (47). Only a small portion of the total FAP-1 expressed appears to be associated with Fas (Fig. 1D), suggesting that even low levels of FAP-1 expression may suffice to affect Fas. Subcellular fractionations were carried out to localize endogenous Fas and FAP-1 in melanoma cell lines. Whereas Fas protein was found in both 1% Triton X-100-soluble and -insoluble fractions of FEMX cells, a substantially higher level of Fas was found in the insoluble fraction of OM431 cells (Fig. 1E). FAP-1 was predominantly found in the insoluble fraction of OM431 cells but not in that of FEMX cells (Fig. 1E), where it was poorly expressed (Fig. 1D and E). These data confirm that FAP-1 colocalizes with Fas in OM431 cells.
Fas-GFP is accumulated within cytoplasmic pools and the Golgi apparatus in cells exhibiting impaired cell surface expression.
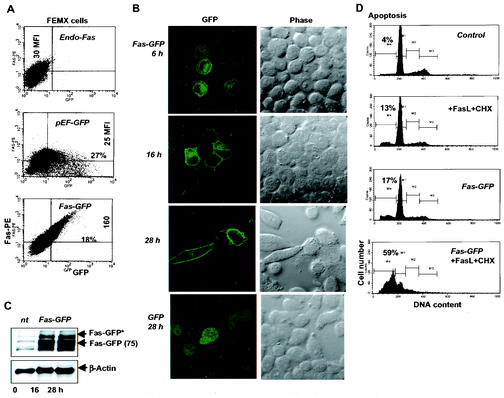
To follow up possible effects of FAP-1 on Fas cell surface expression, we constructed a Fas-GFP expression vector that was first tested for cellular localization and for its ability to induce apoptosis following the addition of FasL. Transfection of Fas-GFP to FEMX melanoma cells that express overall low levels of Fas resulted in an approximately sixfold increase in the expression of Fas on the cell surface, detected by an increase in the MFI of surface Fas (Fig. 2A). Time lapse fluorescence analysis revealed mixed cytoplasmic and cell surface expression within 6 to 16 h, followed by primary cell surface expression after 28 h (Fig. 2B). These data demonstrate that Fas-GFP is subject to time-dependent trafficking. Total levels of Fas-GFP expression were monitored by Western analysis of the transfected cells with anti-GFP Ab (Fig. 2C). Two forms of Fas-GFP are likely to represent posttranslationally modified forms of Fas. These findings demonstrate that Fas-GFP is properly expressed and localized within the cell, similar to the endogenous form of Fas.
FIG. 2.
Fas-GFP is a functional chimeric protein that exhibits time-dependent localization on the cell surface and triggers FasL-mediated apoptosis. (A) FEMX cells were transiently transfected with a pEF-FAS- GFP expression construct or with a pEF-GFP control plasmid. Surface Fas levels were determined by staining the cells with anti-N-terminal Fas-PE MAbs and by FACS analysis. The MFIs of Fas and the percentages of double-positive Fas+ GFP+ cells are indicated. (B) Intracellular localization of Fas-GFP fused protein 6 to 28 h after transfection; GFP expression vector was used as a control. Phase reflects phase-contrast microscopy. (C) Expression pattern of total Fas-GFP was determined by Western blot analysis 16 to 28 h after transfection; nt, nontransfected cells. The Fas-GFP fused protein has an apparent mass of 75 kDa; an additional band, probably reflecting a posttranslationally modified form of Fas, was designated Fas-GFP*. The β-actin level was used as a loading control. (D) Apoptosis analysis of Fas-GFP-transfected FEMX cells. Apoptosis was induced by FasL (10 ng/ml)-CHX (10 μg/ml) treatment.
The addition of FasL (50 ng/ml) and cycloheximide (10 μg/ml) to Fas-GFP-expressing cells resulted in a marked degree of apoptosis (17 to 59%), indicating that Fas-GFP can induce apoptosis following its activation by FasL (Fig. 2D). These data demonstrate that Fas-GFP is functional in its trafficking and ability to elicit FasL-mediated apoptosis.
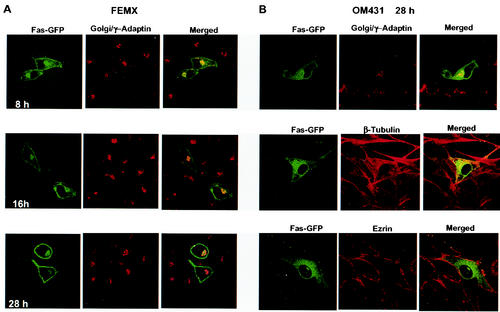
We next monitored changes in the localization of Fas-GFP in FEMX and OM431 cells that exhibited a different subcellular distribution of Fas. Expression of Fas-GFP in the FEMX cells (which exhibit overall low endogenous Fas levels) revealed a partial colocalization of Fas-GFP with γ-adaptin, indicating localization within the Golgi compartment. Localization of Fas-GFP within the Golgi compartment decreased in a time-dependent manner, as greater amounts of Fas-GFP could be found on the cell surface at later time points (Fig. 3A). In contrast, OM431 cells, which mostly exhibit internal Fas expression, retained most of the Fas-GFP within the cytoplasm. Only a small portion of Fas-GFP was found within the Golgicompartment (Fig. 3B). Additional staining of OM431 cells using Abs to different subcellular compartments revealed localization of Fas within the cellular cytoskeleton based on its colocalization with the tubulin network but not the plasma membrane, monitored here by the use of Abs to ezrin (Fig. 3B). These data further establish changes in Fas localization among melanoma cells, as represented with the OM431 and FEMX cells.
FIG. 3.
Time-dependent localization of Fas-GFP in melanoma cell lines. (A) Confocal analysis of Fas-GFP subcellular location in FEMX. Localization of Fas-GFP (green) and a Golgi marker, γ-adaptin (red; the secondary Ab labeled with Texas Red), was performed at the indicated time points. Yellow represents the overlay of green and red. (B) Confocal analysis of Fas-GFP (green) and γ-adaptin, β-tubulin, and ezrin (red) in OM431 cells.
FAP-1 inhibits surface expression of Fas.
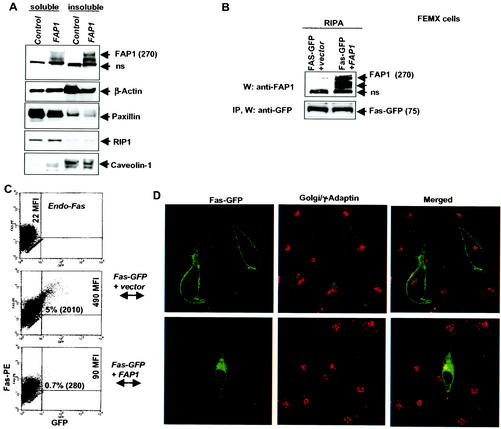
To assess the possible effect of FAP-1 on Fas trafficking, we monitored changes in Fas surface expression upon the expression of FAP-1 in FEMX cells. Analysis of FAP-1 subcellular localization revealed that it is predominantly localized in the insoluble fraction of the cell (Fig. 4A), which consists of membrane and cytoskeletal proteins. It is important to note that the total levels of Fas-GFP (these cells have very low levels of endogenous Fas) do not change after FAP-1 transfection (Fig. 4B), suggesting that FAP-1 does not affect Fas stability. Whereas expression of Fas-GFP in FEMX cells resulted in efficient cell surface expression (Fig. 2 and 4C), in the presence of FAP-1 there was a marked (fivefold) decrease in Fas-GFP surface expression (Fig. 4C). Expression of FAP-1 in FEMX cells also caused a marked decrease in the number of Fas-GFP molecules that reached the cell surface (as reflected in a decrease in MFI from 490 to 90). The shift in the localization of Fas from the cell surface to subcellular pools upon FAP-1 expression was also seen by confocal microscopy (Fig. 4D). To confirm that this observation is not cell type specific, we performed a similar analysis in HeLa cells that exhibited low levels of endogenous surface Fas expression. Similar to what was seen in the FEMX cells, forced expression of FAP-1 efficiently decreased the percentage of cells exhibiting surface Fas-GFP expression in HeLa cells (data not shown). It is important to note that despite the different protocols used for analysis of cells via FACS and immunohistochemistry (especially concerning the detachment of cells, which may affect cytoskeletal organization and protein trafficking), our confocal data are in agreement with the FACS analysis (Fig. 4C and D) and are supported by the notion that changes directed at cytoskeletal proteins by selective drugs (i.e., taxol) affect trafficking of Fas, albeit at a later time (8 to 12 h as opposed to the 30 min used in our protocols; data not shown). The observation that FAP-1 increases the fraction of Fas-GFP (molecules and cell numbers) that is localized within the cytoplasm suggests that FAP-1 inhibits the export of Fas to the cell surface.
FIG. 4.
FAP-1 expression attenuates Fas-GFP cell surface expression. (A) Western blot analysis of FAP-1 levels in 1% Triton X-100-soluble and -insoluble fractions in control (empty vector) or FAP-1-tranfected FEMX cells. ns, a nonspecific form recognized by the Abs. (B) Western blot analysis (W) of FAP-1 levels (RIPA buffer) in control (empty vector) or FAP-1-transfected FEMX cells. Both cell lines were cotransfected with Fas-GFP. IP, immunoprecipitation. (C) Surface Fas levels were determined in transfected FEMX cells by staining them with anti-N-terminal Fas-PE MAb and by FACS analysis. The MFIs of Fas and the percentages of double-positive Fas+ GFP+ cells are indicated. (D) Confocal images of FEMX cells transfected with Fas-GFP plus empty vector or Fas-GFP plus FAP-1 expression construct. γ-Adaptin was used as a Golgi marker.
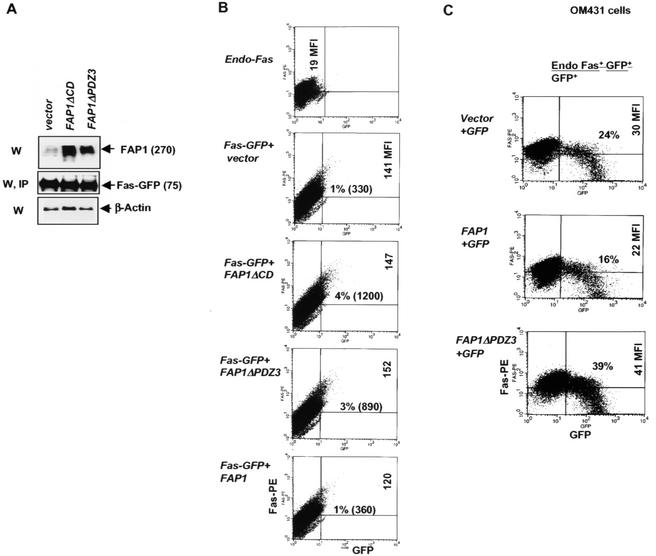
To confirm the role of FAP-1 in the regulation of Fas trafficking, we tested the effects of mutant forms of FAP-1 expected to function as dominant negatives. To this end, we chose to use FAP-1 that is unable to associate with Fas (FAP-1ΔPDZ3) or that is mutated within the domain expected to enable its phosphatase activity (FAP-1ΔCD). Since PDZ domain-containing proteins are known for their notorious homo- and heterodimerization capabilities (38), it is likely that the deleted forms of FAP-1 used in the present study efficiently heterodimerize with the endogenous wild-type (wt) FAP-1, which is expected to inhibit endogenous FAP-1 activities. Accordingly, we consider the forms of FAP-1 with deletions as dominant negatives. Expression of either form of mutant FAP-1 together with Fas-GFP in OM431 cells (Fig. 5A), which exhibit impaired Fas cell surface expression, resulted in a substantial increase in Fas surface expression (a three- to fourfold increase in the percentage of surface Fas-GFP-positive cells [Fig. 5B]). Similarly, expression of Fas-GFP in the presence of the FAP-1 dominant-negative form that lacks phosphatase activity resulted in a two- to threefold increase in the percentage of surface Fas-expressing cells in OM431 cells (Fig. 5B), as in HeLa cells (data not shown) and normal human TIG3 fibroblasts (Fig. 6C). Overexpression of wt FAP-1 did not affect Fas-GFP localization in OM431 cells (which already express high levels of endogenous FAP-1). Immunohistochemistry confirmed a decrease in the number of cells that contain intracellular pools of Fas-GFP upon exogenous expression of dominant-negative FAP-1 constructs (data not shown). In all cases, dominant-negative forms of FAP-1 affected the relative number of cells expressing Fas on their surfaces but not the number of Fas molecules expressed per cell (which is reflected in unchanged MFI values [Fig. 5B]). This is possibly due to the limited transfection efficiency of high-molecular-weight FAP-1 in these cultures. Equally plausible is the notion that additional factors play important roles in regulating Fas trafficking to the cell surface.
FIG. 5.
Mutated forms of FAP-1 increase cell surface expression of Fas. (A) Expression levels of mutated forms of transfected FAP-1 in OM431 cells were determined by Western blot analysis (W). IP, immunoprecipitation. Apparent molecular masses (kilodaltons) are in parentheses. (B) FACS analysis of Fas-GFP surface expression was performed in OM431 cells after cotransfection with vector, FAP-1, or mutated forms of FAP-1 using anti-N-terminal Fas-PE MAbs and C-terminally tagged GFP. The MFIs and the percentages of double-positive cells (or numbers of double-positive cells of a total of 40,000 cells analyzed) are indicated in the upper right quadrants. (C) Effect of FAP-1 or FAP-1ΔPGZ3 on endogenous Fas expression in OM431 cells. The indicated constructs were cotransfected together with GFP, and 24 h later, FACS analysis allowed the analysis of endogenous Fas levels in GFP-positive cells. The ratios of Fas+ GFP+ cells to the total number of GFP+ cells are indicated.
FIG. 6.
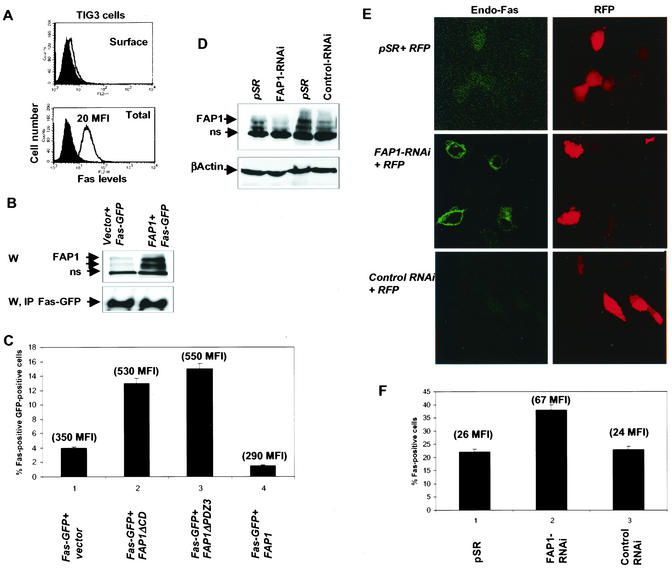
Mutated forms of FAP-1 and RNAi of FAP-1 increase cell surface expression of Fas. (A) FACS analysis of surface and total Fas levels in TIG3 cells. (B) Western blot analysis (W) of FAS-GFP and FAP-1 levels in TIG3 cells. IP, immunoprecipitation; ns, a nonspecific form recognized by the Abs. (C) FACS analysis of Fas-GFP surface expression was performed in TIG3 cells after cotransfection with vector, FAP-1, or dominant-negative forms of FAP-1 using anti-N-terminal Fas-PE MAbs and C-terminally tagged GFP. (D) Western blot analysis of FAP-1 levels in TIG3 cells transfected with pRS, FAP-1 RNAi, or control RNAi 60 h after transfection. (E) Immunohistochemistry using confocal microscopy follows changes in surface expression of endogenous Fas in TIG3 cells that were transfected with FAP-1 RNAi or control RNAi. (F) Changes in endogenous levels of surface Fas were determined in TIG3 cells after cotransfection of red fluorescent protein (RFP) expression vector together with either pSR or FAP-1 RNAi and control RNAi. FACS analysis was performed for the determination of the percentage of Fas-positive cells and Fas MFI in the population of GFP-positive cells. The error bars indicate standard deviations.
Important confirmation of these observations that followed changes in localization of exogenously expressed Fas comes from the analysis of the effects of FAP-1 on endogenous Fas. Analysis of the effects of FAP-1 on the endogenous localization of Fas was performed with the aid of GFP, used as a marker to identify FAP-transfected cells. Expression of wt FAP-1 caused a decrease in surface Fas expression, whereas the expression of mutant FAP-1 increased surface Fas expression, determined as a percentage of Fas-positive and GFP-positive cells relative to the total population of GFP-positive cells (Fig. 5C). These findings validate the changes seen with Fas-GFP and establish that attenuating endogenous FAP-1 is sufficient to rescue Fas surface expression.
Analysis of normal human fibroblasts that express low levels of Fas (Fig. 6A) was performed after forced expression of FAP-1 (Fig. 6B). Similar to what was observed in the OM431 melanoma cells, expression of FAP decreased the levels of Fas on the cell surface whereas dominant-negative forms of FAP-1 increased it (Fig. 6C). These observations suggest that FAP regulation of Fas surface expression is not limited to melanoma cells, as it is also seen in nontransformed fibroblasts. Given the higher efficiency of transfection in these cells compared with the melanoma cultures, we have generated and expressed RNAi constructs designed to inhibit the expression of endogenous FAP-1 (FAP-1 RNAi) and control sequences designed from a different region of the FAP-1 sequence which poorly affect FAP-1 expression (control RNAi). Forced expression of FAP-1 RNAi resulted in the inhibition of FAP-1 transcription, as determined by RT-PCR (not shown), and expression, as revealed in immunoblot analysis (Fig. 6D), and increased the level of endogenous Fas surface expression, as determined by immunohistochemistry (Fig. 6E) and FACS analysis (Fig. 6F). These results provide important support for the role of FAP-1 in the inhibition of Fas surface expression.
Overexpression of FAP-1 decreases Fas surface expression in melanoma cells that exhibit proper Fas trafficking.
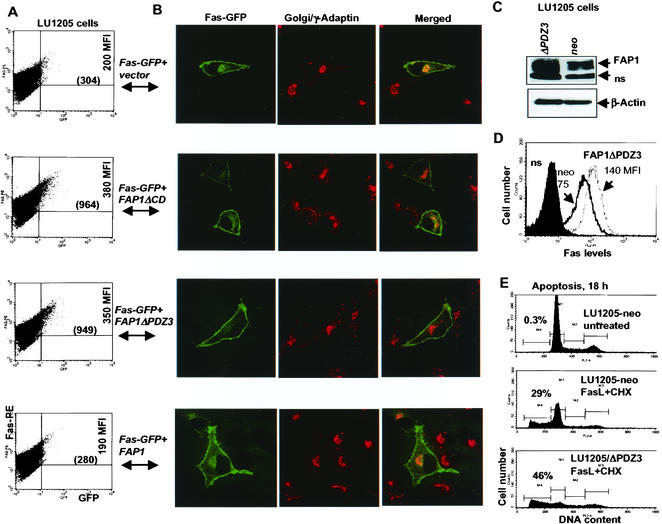
We next assessed whether the expression of dominant-negative FAP-1 would enable further-increased cell surface expression of Fas in cells in which most of the Fas is already found on the cell surface. To this end, we used LU1205 melanoma cells, in which the amount of endogenous surface Fas is almost equal to that of total Fas (data not shown). Coexpression of mutant FAP-1 and Fas-GFP in LU1205 cells caused further increase (∼3-fold) in the fraction of cells exhibiting surface Fas-GFP expression, with a noticeable increase also seen in the intensity of cell surface Fas, reflected in increased MFI (Fig. 7A). Such increases coincided with smaller amounts of Fas-GFP able to colocalize within the Golgi and cytosol fractions (Fig. 7B). In contrast, coexpression of wt FAP-1 and Fas-GFP did not affect surface Fas expression compared with control LU1205 cells (due to high basal levels of FAP-1 in LU1205 cells). Consistent with these observations, it was also observed that LU1205 cells stably expressing FAP-1ΔPDZ3 (Fig. 7C) exhibited a noticeable increase in the level of endogenously expressed Fas on the cell surface compared to the control LU1205-neo cells (Fig. 7D). Up-regulation of surface Fas levels upon expression of the dominant-negative form of FAP-1 was also reflected in the proportion of LU1205 cells that underwent apoptosis in response to FasL and CHX stimuli (Fig. 7E). The ability of FAP-1 to further increase Fas surface expression even in the LU1205 cells suggests that it serves to limit the level of Fas surface expression even in cells where a noticeable fraction of Fas appears to be localized on the cell surface.
FIG. 7.
Dominant-negative forms of FAP-1 further increase cell surface expression of Fas in LU1205 melanoma cells. (A) FACS analysis of Fas-GFP expression in cells expressing wt and mutant forms of FAP-1 was performed as indicated in Materials and Methods. (B) Corresponding confocal images of merged GFP-Fas and Golgi marker (γ-adaptin) are shown for the experiment depicted in panel A. (C) Western blotting of FAP-1 levels in LU1205 cells that stably express control or FAP-1ΔPDZ3 constructs. ns, a nonspecific form recognized by the Abs. (D) FACS analysis of Fas levels in LU1205 cells that stably express pcDNA3 (neo) or FAP-1ΔPDZ3. (E) Apoptosis analysis of control or FAP-1ΔPDZ3-transfected LU1205 cells after treatment with FasL (50 ng/ml) plus CHX (10 μg/ml). The percentages of apoptotic cells are indicated.
FAP-1 association with Fas is required for inhibition of Fas trafficking.
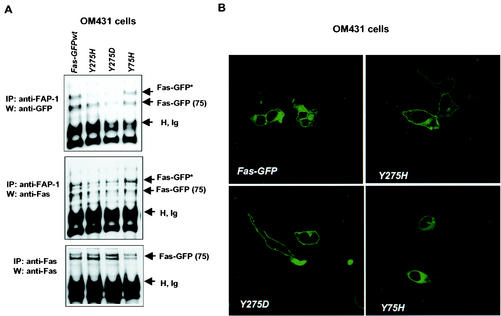
To further understand the mechanism underlying the inhibition of Fas trafficking on FAP-1, we further tested FAP-1 association with Fas in the context of its export to the cell surface. To best mimic physiological conditions, we chose to assess the association of wt Fas-GFP versus that of a naturally occurring mutant (Y275H) reported in multiple myeloma (25). For controls, we generated two additional mutant forms of Fas: Y275D (the control for charge-based altered conformation) and Y75H (chosen as an unrelated site). Forced expression of Fas-GFP on OM431 cells followed by immunoprecipitation of FAP-1 revealed lower levels of C-terminal mutants (Y275H or Y275D) in complex with FAP-1, whereas mutation within the N-terminal site (Y75H) did not affect FAS association (Fig. 8A). These findings suggest that FAP-1 association with Fas requires an intact C-terminal domain.
FIG. 8.
Mutation within C-terminal Fas abolishes FAP-1 association and inhibition of Fas trafficking. (A) Effect of N- and/or C-terminal mutations of Fas on association of Fas-GFP with FAP-1. The corresponding constructs were expressed in OM431 cells following their coimmunoprecipitation (IP) and Western analysis (W) with the indicated Abs. The positions of Fas-GFP and the imunoglobulin heavy chain (H, Ig) are indicated. (B) Immunohistochemical analysis of Fas-GFP expression in OM431 cells that were transfected with the wt or mutant forms of Fas-GFP.
We next tested if mutant forms of Fas would exhibit altered trafficking to the cell surface. Each of the GFP-Fas forms was transfected into OM431 melanoma cells, in which Fas is primarily found in the cytoplasm. Whereas Fas-GFP that was mutated on the N-terminal site did not exhibit increased cell surface expression, mutation within the C-terminal site increased Fas trafficking to the cell surface (Fig. 8B). These results suggest that in the absence of FAP-1 association, as shown for the C-terminal mutant, Fas trafficking is accelerated, further supporting the negative regulation of Fas trafficking by FAP-1.
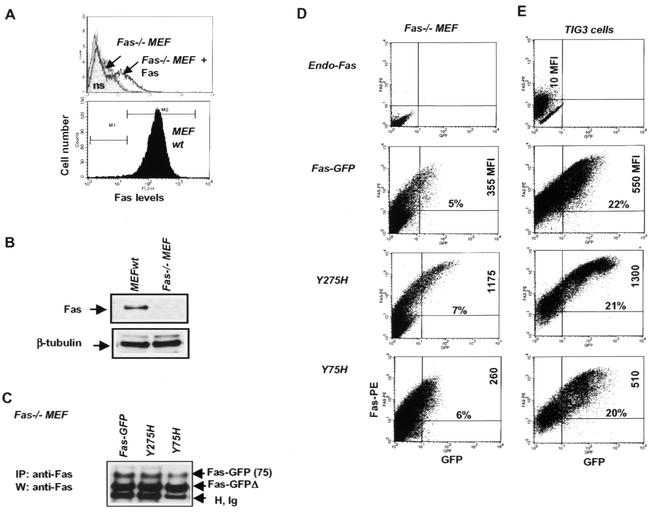
To exclude the possible effects of endogenous Fas on Fas-GFP trafficking, we have generated mouse embryo fibroblasts, which were subsequently immortalized, from mice lacking the Fas gene (2) (Fig. 9A and B). The control for actual expression of wt and mutant Fas-GFPs that were transfected into Fas null cells is depicted in Fig. 9C. It is important to note that the mouse analogue of FAP-1 (PTB-BL) can interact with human Fas (46). Monitoring the pattern of Fas-GFP surface expression in the Fas null cells revealed a low basal level of wt Fas-GFP and the N-terminal Y75H mutant. In contrast, Fas mutated on Y275H exhibited a marked (>3-fold) increase in the level of surface expression (MFI) (Fig. 9D), similar to its elevated trafficking in other cell lines. Similar changes were also observed in the normal human fibroblasts. Expression of the C-terminal mutant R275H resulted in an increased number of Fas molecules on the cell surface, whereas expression of Y75H did not cause such an increase (Fig. 9E).
FIG. 9.
Effects of N- and or C-terminal mutation of Fas-GFP on its trafficking in Fas knockout (KO) cells. (A) Mouse embryo fibroblasts (MEF) from Fas null (KO) mice have been established in culture. FACS analysis was used for monitoring Fas surface levels in KO fibroblasts before and after transfection by Fas expression vector. ns, nonstained cells. (B) Western analysis of total Fas levels in wt and Fas KO fibroblasts. (C) Analysis of wt and mutant Fas-GFP fusion protein expression after transfection intot Fas KO fibroblasts was done by immunoprecipitation (IP) with anti-Fas MAb followed by Western analysis (W). (D and E) FACS analysis of surface Fas-GFP expression was performed on FAS KO (D) or TIG3 (E) cells as indicated in Materials and Methods.
These findings establish that inhibition of Fas trafficking to the cell surface by FAP-1 depends on its association with FAS via an intact C-terminal domain.
DISCUSSION
Changes in the level of Fas cell surface expression have been widely reported and implicated in the reduction of the cell's ability to undergo Fas-mediated apoptosis after FasL stimulation. Such changes were noted, in particular, during tumor progression, as advanced tumors were often seen to exhibit decreased Fas surface expression as one means of escaping immune surveillance (3, 15, 33, 39, 42, 44). Earlier studies highlighted the role of Stat3 and c-Jun in the negative regulation of Fas transcription that resulted in attenuation of overall Fas expression internally and on the cell surface (19). While the earlier findings relate to a fraction of tumors tested, other tumors were found to exhibit expression of Fas locked within intracellular pools. The present study highlights the mechanism underlying the impaired export of Fas to the cell surface, as we demonstrate that the trafficking of Fas to the cell surface depends on FAP-1. FAP-1 has been identified as a Fas-associated tyrosine phosphatase and has been implicated in attenuating Fas death signaling (28). Our data identify the mechanism underlying such inhibition, as FAP-1 expression retains Fas in cytoplasmic pools within the cytoskeleton network, thereby blocking its trafficking from the Golgi compartment to the cell surface. FAP-1 structure resembles those of proteins that are localized within the cytoskeleton network (7, 34) and is in line with our data identifying FAP-1 within the insoluble protein fraction of the cell. Additional analysis is required to better pinpoint the mechanism for FAP-1 inhibition of Fas surface expression. Among the possibilities to consider are FAP-1 as an inhibitor of Fas export or that FAP-1 increases the trafficking of Fas from the cell surface to intracellular pools and thereby inhibits Fas recycling. Our results support either model, as the excess Fas in cells that lack its cell surface expression is primarily found within the cytoplasmic pools associated with the cytoskeleton.
We observed that, of the total amount of FAP-1 expressed, only a small portion appears to be associated with Fas, thus providing further support for controlled Fas-FAP-1 association. While this implies the role of Fas modification as a prerequisite for association, it also suggests that FAP-1 may be involved in the regulation of trafficking of other proteins and that even a low expression of FAP-1 may be sufficient for eliciting its trafficking control. Candidates include the neurotrophin receptor p75NTR, a member of the tumor necrosis factor receptor superfamily shown to interact with FAP-1 (17). It is likely that FAP-1 activities could be regulated by posttranslational modification, which would render only a portion available for both association with and effect on Fas or other associated proteins.
The level of FAP-1 expression inversely correlates with cell surface Fas expression. However, at least one of the cell lines studied here, LU1205, exhibited marked cell surface expression and also expression of high levels of FAP-1. This suggests either that expression per se may not suffice to enable FAP-1 to attenuate Fas surface expression or that FAP-1 or Fas may be subject to changes at the genomic or posttranslational level, explaining the limited effect in the LU1205 cells.
The nature of FAP-1 as a protein phosphatase is intriguing, given that Fas phosphorylation remains elusive. Human Fas (Apo-1) contains three tyrosine residues, Y75, Y216, and Y275, the last two being positioned within the death domain. Using NetPhos software for sequence- and structure-based prediction of tyrosine phosphorylation sites (9), Y75 and Y275 were highlighted as the putative Tyr-phosphoryated sites. Although our data suggest that the binding of Fas to FAP-1 and to Fas requires intact tyrosine at position 275, additional studies are needed to assess the role of Fas phosphorylation in the context of its stability and trafficking.
Understanding the nature of Fas phosphorylation may also provide an explanation for the differences in the effect of FAP-1 on the number of cells expressing Fas versus the number of Fas surface molecules expressed per cell. Whereas overexpression of FAP-1 decreased both parameters, the expression of FAP-1 mutants increased the number of cells that expressed surface Fas but not the number of Fas molecules per cell. In contrast, the expression of a Fas mutant (Y275H or Y275D) resulted in increased intensity (number of molecules per cells) but not increased numbers of cells expressing surface Fas. The nature of these changes could be attributed to additional parameters that govern Fas trafficking, including altered phosphorylation or glycosylation, as well as changes in Fas stability and recycling. The role of such changes in FAP-1-dependent Fas export is being investigated.
Our data, using a naturally occurring mutant form of Fas at the 275 site (25), provide direct evidence for FAP-1- Fas association as a prerequisite for Fas trafficking inhibition. Our data are in agreement with the observation that the C-terminal peptide that harbors the last three amino acids of the Fas protein increases Fas surface expression (37, 45), probably due to interference with FAP-1 binding. It is interesting that the extreme C-terminal domain (i.e., the last three amino acids of the Fas protein) is not conserved in evolution (i.e., mouse Fas lacks these residues), further highlighting the requirement for the integrity of Fas conformation within the carboxyl end of the protein, as revealed in our analysis of the Fas mutants at amino acid 275.
Elevated FAP-1 expression in human tumors is often seen and has been linked with impaired Fas-mediated apoptosis (26, 28, 30, 44, 45). Our findings, which provide direct evidence for the effect of FAP-1 on Fas cell surface expression, point to the mechanism underlying the inhibition of Fas surface expression commonly seen in advanced human tumors. NFκB, which has been implicated in melanoma progression (12, 23), was also linked to the regulation of FAP-1 (18).
FAP-1 expression may also play a role in dictating the primary apoptosis cascade in normal untransformed cells, as shown here in normal TIG3 lung fibroblasts. This is in accord with the notions that pancreatic β cells are triggered to express cell surface Fas following progressive insulitis (6) and that bile salts mediate hepatocyte apoptosis by increasing cell surface trafficking of Fas (41).
Taken together, our findings provide direct evidence for the role of FAP-1 in the regulation of Fas expression on the cell surface, thereby highlighting novel insights into the mechanisms underlying the regulation of Fas cell surface expression in normal and tumor cells. The use of melanoma cells with very low Fas expression (FEMX) allowed analysis in a model system (using Fas-GFP) resembling Fas null cells, albeit in a true melanoma setting. FAP-1 inhibition of Fas surface expression has also been observed in the context of different melanoma cultures, as well as in untransformed human fibroblasts, further validating our model and highlighting its physiological relevance.
Acknowledgments
We thank Peter Krammer for the Fas (Apo-1) plasmid, Reuven Agami for the pSuper plasmid, and Meenhard Herlyn and O. Fodstad for the melanoma cells used in the studies reported here. We also thank Scott Henderson and Takayuki Kadoya for help in confocal analysis, Hans Snock for advice on FACS analysis, and Hasimu Hapahake for help in subcellular fractionation.
Support by NCI grant CA51995 (to Z.R.) and from the Sharp foundation (to Z.R.) is gratefully acknowledged.
REFERENCES
- 1.Aaronson, S. A., and G. J. Todaro. 1968. Development of 3T3-like lines from Balb/c mouse embryo cultures: transformation susceptibility to SV40. J. Cell. Physiol. 72**:**141-148. [DOI] [PubMed] [Google Scholar]
- 2.Adachi, M., S. Suematsu, T. Kondo, J. Ogasawara, T. Tanaka, N. Yoshida, and S. Nagata. 1995. Targeted mutation in the Fas gene causes hyperplasia in peripheral lymphoid organs and liver. Nat. Genet. 11**:**294-300. [DOI] [PubMed] [Google Scholar]
- 3.Aragane, Y., A. Maeda, C. Y. Cui, T. Tezuka, Y. Kaneda, and T. Schwarz. 2000. Inhibition of growth of melanoma cells by CD95 (Fas/APO-1) gene transfer in vivo. J. Investig. Dermatol. 115**:**1008-1014. [DOI] [PubMed] [Google Scholar]
- 4.Arai, M., M. Kannagi, M. Matsuoka, T. Sato, N. Yamamoto, and M. Fuji. 1998. Expression of Fap-1 (Fas-associated phosphatase) and resistance to Fas-mediated apoptosis in T cell lines derived from human T cell leukemia virus type-1 associated myelopath/tropical spastic paraparesis patients. AIDS Res. Hum. Retrovir. 14**:**261-267. [DOI] [PubMed] [Google Scholar]
- 5.Atkinson, E. A., H. Ostergaard, K. Kane, M. J. Pinkoski, A. Caputo, M. W. Olszowy, and R. C. Bleackley. 1996. A physical interaction between the cell death protein Fas and the tyrosine kinase p59fynT. J. Biol. Chem. 271**:**5968-5971. [DOI] [PubMed] [Google Scholar]
- 6.Augstein, P., A. Dunger, C. Salzsieder, P. Heinke, R. Kubernath, J. Bahr, U. Fischer, R. Rettig, and E. Salzsieder. 2002. Cell surface trafficking of Fas in NIT-1 cells and dissection of surface and total Fas expression. Biochem. Biophys. Res. Commun. 290**:**443-451. [DOI] [PubMed] [Google Scholar]
- 7.Banville, D., S. Ahmad, R. Stocco, and S. H. Shen. 1994. A novel protein-tyrosine phosphatase with homology to both the cytoskeletal proteins of the band 4.1 family and junction-associated guanylate kinases. J. Biol. Chem. 269**:**22320-22327. [PubMed] [Google Scholar]
- 8.Bennett, M., K. Macdonald, S. W. Chan, J. P. Luzio, R. Simaari, and P. Weissberg. 1998. Cell surface trafficking of Fas: a rapid mechanism of p53 mediated apoptosis. Science 9**:**290-293. [DOI] [PubMed] [Google Scholar]
- 9.Blom, N., S. Gammeltoft, and S. Brunak. 1999. Sequence and structure-based prediction of eukaryotic protein phosphorylation sites. J. Mol. Biol. 294**:**1351-1362. [DOI] [PubMed] [Google Scholar]
- 10.Brummelkamp, T. R., R. Bernards, and R. Agami. 2002. A system for stable expression of short interfering RNAs in mammalian cells. Science 296**:**550-553. [DOI] [PubMed] [Google Scholar]
- 11.Brummelkamp, T. R., R. Bernards, and R. Agami. 2002. Stable suppression of tumorigenicity by virus-mediated RNA interference. Cancer Cell 2**:**243-247. [DOI] [PubMed] [Google Scholar]
- 12.Dhawan, P., and A. Richmond. 2002. A novel NF-kappa B-inducing kinase-MAPK signaling pathway up-regulates NF-kappa B activity in melanoma cells. J. Biol. Chem. 8**:**7920-7928. [DOI] [PMC free article] [PubMed] [Google Scholar]
- 13.Elnemr, A., T. Ohta, A. Yachie, M. Kayahara, H. Kitagawa, T. Fujimura, I. Nimomiya, S. Fushida, G. I. Nishimura, K. Shimizu, and K. Miwa. 2001. Human pancreatic cancer cells disable function of Fas receptors at several levels in Fas signal transduction pathway. Int. J. Oncol. 18**:**311-316. [DOI] [PubMed] [Google Scholar]
- 14.Elsing, A., and H. G. Burgert. 1998. The adenovirus E3/10.4K-14.5K proteins down-modulate the apoptosis receptor Fas/Apo-1 by inducing its internalization. Proc. Natl. Acad. Sci. USA 95**:**10072-10077. [DOI] [PMC free article] [PubMed] [Google Scholar]
- 15.Hug, H. 1997. Fas-mediated apoptosis in tumor formation and defense. Biol. Chem. 378**:**1405-1412. [PubMed] [Google Scholar]
- 16.Inoue, S., A. E. Salah-Eldin, and K. Omoteyama. 2001. Apoptosis and anticancer drug resistance. Hum. Cell 14**:**211-221. [PubMed] [Google Scholar]
- 17.Irie, S., T. Hachiya, S. Rabizadeh, W. Maruyama, J. Mukai, Y. Li, J. C. Reed, D. E. Bredesen, and T.-A. Sato. 1999. Functional interaction of Fas-associated phosphatase-1 (FAP-1) with p75NTR and their effect on NF-κB activation. FEBS Lett. 460**:**191-198. [DOI] [PubMed] [Google Scholar]
- 18.Irie, S., Y. Li, H. Kanki, T. Ohyama, L. L. Deaven, S. Somlo, and T. A. Sato. 2001. Identification of two Fas-associated phosphatase-1 (FAP-1) promoters in human cancer cells. DNA Seq. 11**:**519-526. [DOI] [PubMed] [Google Scholar]
- 19.Ivanov, V. N., A. Bhoumik, M. Krasilnikov, R. Raz, L. B. Owen-Schaub, D. Levy, C. M. Horvath, and Z. Ronai. 2001. Cooperation between STAT3 and c-Jun suppresses Fas transcription. Mol. Cell 7**:**517-528. [DOI] [PubMed] [Google Scholar]
- 20.Ivanov, V. N., and Z. Ronai. 1999. Down regulation of TNFα expression by ATF2 increases UVC-induced apoptosis of late stage melanoma cells. J. Biol. Chem. 274**:**14079-14089. [DOI] [PubMed] [Google Scholar]
- 21.Ivanov, V. N., and Z. Ronai. 2000. p38 protects human melanoma cells from UV-induced apoptosis through down-regulation of NF-κB activity and Fas expression. Oncogene 19**:**3003-3012. [DOI] [PubMed] [Google Scholar]
- 22.Ivanov, V. N., M. Krasilnnikov, and Z. Ronai. 2002. Regulation of Fas expression by STAT3 and c-Jun is mediated by phosphatidylinositol 3-kinase-AKT signaling. J. Biol. Chem. 277**:**4932-4944. [DOI] [PubMed] [Google Scholar]
- 23.Karin, M., Y. Cao, F. R. Greten, and Z. W. Li. 2002. NF-κB in cancer: from innocent bystander to major culprit. Nat. Rev. Cancer 2**:**301-310. [DOI] [PubMed] [Google Scholar]
- 24.Krammer, P. H. 2000. CD95's deadly mission in the immune system. Nature 12**:**789-795. [DOI] [PubMed] [Google Scholar]
- 25.Landowski, T. H., N. Qu, I. Buyuksal, J. S. Painter, and W. S. Dalton. 1997. Mutations in the Fas antigen in patients with multiple myeloma. Blood 90**:**4266-4270. [PubMed] [Google Scholar]
- 26.Lee, S. H., M. S. Shin, H. S. Lee, J. H. Bae, H. K. Lee, H. S. Kim, S. Y. Kim, J. J. Jang, M. Joo, Y. K. Kang, W. S. Park, J. Y. Park, R. R. Oh, S. Y. Han, J. H. Lee, S. H. Kim, J. Y. Lee, and H. J. Yoo. 2001. Expression of Fas and Fas-related molecules in human hepatocellular carcinoma. Hum. Pathol. 32**:**250-256. [DOI] [PubMed] [Google Scholar]
- 27.Lee, S. H., M. S. Shin, W. S. Park, S. Y. Kim, H. S. Kim, J. H. Lee, S. Y. Han, H. K. Lee, J. Y. Park, R. R. Oh, J. J. Jang, J. Y. Lee, and N. J. Yoo. 1999. Immunohistochemical localization of FAP-1, an inhibitor of Fas-mediated apoptosis, in normal and neoplastic human tissues. APMIS 107**:**1101-1108. [DOI] [PubMed] [Google Scholar]
- 28.Li, Y., H. Kanki, T. Hachiya, T. Ohyama, S. Irie, G. Tang, J. Mukai, and T. Sato. 1997. Negative regulation of Fas-mediated apoptosis by FAP-1 in human cancer cells. Int. J. Cancer 87**:**8539-8545. [DOI] [PubMed] [Google Scholar]
- 29.Maekawa, K., N. Imagawa, M. Nagamatsu, and S. Harada. 1994. Molecular cloning of a novel-protein-tyrosine phosphatase containing a membrane-binding domain and GLGF repeats. FEBS Lett. 337**:**200-206. [DOI] [PubMed] [Google Scholar]
- 30.Meinhold-Heerlein, I., F. Stenner-Liewen, H. Liewen, S. Kitada, M. Krajewska, S. Krajewski, J. M. Zapata, A. Monks, D. A. Scudiero, T. Bauknecht, and J. C. Reed. 2001. Expression and potential role of Fas-associated phosphatase-1 in ovarian cancer. Am. J. Pathol. 158**:**1335-1344. [DOI] [PMC free article] [PubMed] [Google Scholar]
- 31.Nagata, S. 1999. Fas-ligand-induced apoptosis. Annu. Rev. Genet. 33**:**29-55. [DOI] [PubMed] [Google Scholar]
- 32.Nicoletti, I., G. Migliorati, M. C. Pagliacci, F. Grignani, and C. Riccardi. 1991. A rapid and simple method for measuring thymocyte apoptosis by propidium iodide staining and flow-cytometry. J. Immunol. Methods 139**:**271-279. [DOI] [PubMed] [Google Scholar]
- 33.Owen-Schaub, L. B., K. L. van Golen, L. L. Hill, and J. E. Price. 1998. Fas and Fas ligand interactions suppress melanoma lung metastasis. J. Exp. Med. 188**:**1717-1723. [DOI] [PMC free article] [PubMed] [Google Scholar]
- 34.Saras, J., L. Claesson-Welsh, C. H. Heldin, and L. J. Gonez. 1994. Cloning and characterization of PTPL1, a protein tyrosine phosphatase with similarities to cytoskeletal-associated proteins. J. Biol. Chem. 269**:**24082-24089. [PubMed] [Google Scholar]
- 35.Saras, J., U. Engstrom, L. J. Gonez, and C. H. Heldin. 1997. Characterization of the interaction between PDZ domains of the protein-tyrosine phosphatase PTPL1 and the carboxyl-terminal tail of Fas. J. Biol. Chem. 272**:**20979-20981. [DOI] [PubMed] [Google Scholar]
- 36.Sato, T., S. Irie, S. Kitada, and J. C. Reed. 1995. FAP-1: a protein tyrosine phosphatase that associates with Fas. Science 268**:**411-415. [DOI] [PubMed] [Google Scholar]
- 37.Sawa, E., M. Takahashi, M. Kamishohara, T. Tazunoki, K. Kimura, M. Arai, T. Miyazaki, S. Kataoka, and T. Nishitoba. 1999. Structural modification of Fas C-terminal tripeptide and its effects on the inhibitory activity of Fas/FAP-1 binding. J. Med. Chem. 42**:**3289-3299. [DOI] [PubMed] [Google Scholar]
- 38.Sheng, M., and C. Sala. 2001. PDZ domains and the organization of supramolecular complexes. Annu. Rev. Neurosci. 24**:**1-29. [DOI] [PubMed] [Google Scholar]
- 39.Shin, M. S., W. S. Park, S. Y. Kim, H. S. Kim, S. J. Kang, K. Y. Song, J. Y. Park, S. M. Dong, J. H. Pi, R. R. Oh, J. Y. Lee, N. J. Yoo, and S. H. Lee. 1999. Alterations of Fas (Apo-1/CD95) gene in cutaneous malignant melanoma. Am. J. Pathol. 154**:**1785-1791. [DOI] [PMC free article] [PubMed] [Google Scholar]
- 40.Simon, H. U., S. Yousefi, B. Dibbert, H. Hebestreit, M. Weber, D. R. Branch, K. Blaser, F. Levi-Schaffer, and G. P. Anderson. 1998. Role for tyrosine phosphorylation and Lyn tyrosine kinase in fas receptor-mediated apoptosis in eosinophils. Blood 92**:**547-557. [PubMed] [Google Scholar]
- 41.Sodeman, T., S. F. Bronk, P. J. Roberts, H. Miyoshi, and G. J. Gores. 2000. Bile salts mediate hepatocyte apoptosis by increasing cell surface trafficking of Fas. Am. J. Physiol. Gastrointest. Liver Physiol. 278**:**992-999. [DOI] [PubMed] [Google Scholar]
- 42.Soubrane, C., R. Mouawad, E. C. Antoine, O. Verola, M. Gil-Delgado, and D. Khayat. 2000. A comparative study of Fas and Fas-ligand expression during melanoma progression. Br. J. Dermatol. 143**:**307-312. [DOI] [PubMed] [Google Scholar]
- 43.Tollefson, A., T. W. Hermiston, D. L. Lichtenstein, C. F. Colle, R. A. Tripp, T. Dimitrov, K. Toth, C. E. Wells, P. C. Doherty, and W. S. M. Wold. 1998. Forced degradation of Fas inhibits apoptosis in adenovirus-infected cells. Nature 392**:**726-730. [DOI] [PubMed] [Google Scholar]
- 44.Ungefroren, H., M. Voss, M. Jansen, C. Roeder, D. Henne-Bruns, B. Kremer, and H. Kalthoff. 1998. Human pancreatic adenocarcinomas express Fas and Fas ligand yet are resistant to Fas-mediated apoptosis. Cancer Res. 58**:**1741-1749. [PubMed] [Google Scholar]
- 45.Ungefroren, H., M. L. Kruse, A. Trauzold, S. Roeschmann, C. Roeder, A. Arlt, D. Henne-Bruns, and H. Kalthoff. 2001. FAP-1 in pancreatic cancer cells: functional and mechanistic studies on its inhibitory role in CD95-mediated apoptosis. J. Cell Sci. 114**:**2735-2746. [DOI] [PubMed] [Google Scholar]
- 46.Walma, T., C. Spronk, M. Tessari, J. Aelen, J. Schepens, W. Hendriks, and G. W. Vuister. 2002. Structure, dynamics and binding characteristics of the second PDZ domain of PTP-BL. J. Mol. Biol. 316**:**1101-1110. [DOI] [PubMed] [Google Scholar]
- 47.Yanagisawa, J., M. Takahashi, H. Kanki, H. Yano-Yanagisawa, T. Tazunoki, E. Sawa, T. Nishitoba, M. Kamishohara, E. Kobayashi, S. Kataoka, and T. Sato. 1997. The molecular interaction of Fas and FAP-1. A tripeptide blocker of human Fas interaction with FAP-1 promotes Fas-induced apoptosis. J. Biol. Chem. 272**:**8539-8545. [DOI] [PubMed] [Google Scholar]
