Cutting Edge: Latecomer CD8 T Cells Are Imprinted with a Unique Differentiation Program (original) (raw)
. Author manuscript; available in PMC: 2011 Jul 15.
Published in final edited form as: J Immunol. 2006 Jul 15;177(2):777–781. doi: 10.4049/jimmunol.177.2.777
Abstract
Factors that influence T cell responses, such as Ag load, APCs, costimulatory molecules, and cytokines, dramatically change during the course of an immune response. We observed that antiviral CD8 T cells were not recruited from circulation simultaneously, but over a period of 3–4 days. Consequently, locally resident T cells and those that entered secondary lymphoid tissue later were primed in very different environments. The cells recruited later in the response were imprinted with a unique differentiation program, such that their magnitude of proliferation was reduced and their kinetics of expansion was delayed. In addition, we found that the “latecomer” CD8 T cells displayed a unique surface phenotype indicative of reduced stimulation but were not preferentially recruited into the surviving pool of memory cells. This finding demonstrates that the timing of recruitment of individual T cell clones determines the population dynamics of the subsequent immune response.
Following activation, T cells typically proceed through three phases: expansion, contraction, and memory. A few hours of priming is sufficient to “program” the expansion of CD8 T cells (1–3), although T cells that receive different levels of antigenic stimulation are imparted with distinct programs (4, 5). It is believed that a decrease in growth factors following pathogen clearance governs the onset of contraction, although other data suggest that this phase may be programmed early in the response (6). Programming also appears to play an important role in T cell differentiation, because cells that receive reduced stimulation or that encounter Ag later in the response might be more likely to survive as memory T cells (7–10). Thus, the information garnered by a responding CD8 T cell during the priming stage plays a pivotal role in dictating the fate of its progeny during each subsequent phase of the response.
Naive T cells undergo a dynamic recirculation pattern between blood and secondary lymphoid organs. Consequently, the time required for different Ag-specific T cells to gain access to draining lymph nodes following an infection might differ greatly (8). Ag levels, APCs, costimulatory molecules, and cytokines vary considerably at different time points following pathogen entry. Thus, a naive T cell entering a lymph node later in the response would undergo priming in a very different environment. Yet, most studies assess the behavior of an entire population of Ag-specific T cells and do not differentiate between subpopulations.
In this report we demonstrate that Ag-specific CD8 T cells are recruited from circulation over a 3-day period following a systemic viral infection. The results showed that “latecomer” subpopulations exhibited a delayed peak of expansion, indicating that, in addition to cell-extrinsic survival factors, cell-intrinsic programming plays an important role in the onset of the contraction phase. The latecomer cells also achieved a reduced burst size and displayed a phenotype indicative of reduced stimulation, but they did not exhibit enhanced memory formation. These results reveal multiple facets of a CD8 T cell response that are influenced by the time of recruitment of individual clones.
Materials and Methods
Mice and pathogens
C57BL/6J mice were obtained from The Jackson Laboratory. OT-I/RAG-1−/−/CD45.1+ (C57BL/6-Tg(TcraTcrb)1100Mjb/J;Rag1tm1Mom;B6.SJL-PtprcaPepcb/BoyJ) mice were bred from mice provided by Dr. A. Goldrath (University of California, San Diego, La Jolla, CA). Vesicular stomatitis virus (VSV)3 expressing OVA (VSV-OVA) and Listeria monocytogenes (Lm) expressing OVA (Lm-OVA) were provided by Dr. L. Lefrançois (University of Connecticut Health Center, Farmington, CT).
Flow cytometry
Lymphocytes isolated from peripheral blood or spleen were stained with indicated reagents following RBC lysis. All Abs were purchased from BD Pharmingen or eBioscience. MHC class I tetramers were provided by Drs. V. Vezys and D. Masopust (Emory University, Atlanta, GA). The data were analyzed using FlowJo software.
Adoptive transfer and immunization
Lymphocytes isolated from lymph nodes of OT-I/RAG-1−/−/CD45.1+ mice were injected i.v. into naive B6 mice. In some experiments, donor cells were labeled with CFSE (Invitrogen Life Technologies). Mice were infected i.v. with 1 × 10⁵ PFU of VSV-OVA. For challenge infections, mice were infected i.v. with 104 CFU of Lm-OVA. The efficiency of memory generation was calculated in the following manner. The percentage of memory cells present in PBL was divided by the proportion of effector cells present at the respective peak of expansion, and this number was multiplied by 100.
Results and Discussion
Antiviral CD8 T cells are not simultaneously recruited from circulation
Seminal studies showed that Ag-specific lymphocytes are selectively recruited from circulation to secondary lymphoid tissues as early as 24 h following immunization (11). Similarly, immunization with soluble protein results in the disappearance of all Ag-specific CD8 T cells from peripheral blood within 24 h (Ref. 12) and our unpublished observations). However, the recruitment time for Ag-specific CD8 T cells following infection with a live replicating pathogen might differ. Hence, we determined the time required for Ag-specific CD8 T cells to be recruited from circulation following a systemic viral infection. We made use of an adoptive transfer system in which congenically marked (CD45.1+) OVA-specific OT-I/RAG-1−/−/CD8 T cells were CFSE-labeled and transferred to B6 (CD45.2+) mice that were either left unimmunized or immunized i.v. a day later with a recombinant VSV-OVA. The recruitment of the Ag-specific OT-I cells following VSV-OVA infection was assayed by monitoring the disappearance of naive (CFSEhighCD44low) donor cells from circulation over time (Fig. 1_A_). We observed OT-I cell recruitment as early as day 1, and the majority of cells were recruited from circulation by day 3 following infection. This is more clearly illustrated in Fig. 1_B_, where the number of cells present in immunized animals is expressed as a percentage of control at each time-point. The recruitment of the OT-I cells following immunization with VSV-OVA was Ag-specific, as immunization with wild-type VSV (lacking OVA) did not result in T cell recruitment (data not shown). As previously reported (13), by day 3 we began to observe newly activated (CFSElowCD44high) cells in circulation (data not shown).
FIGURE 1.
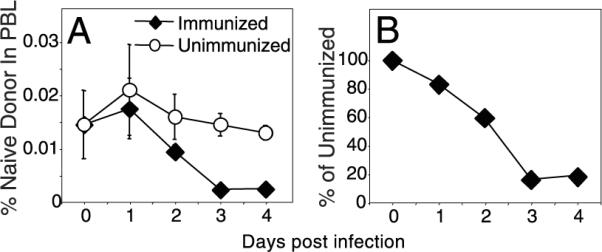
Antiviral CD8 T cells are not recruited simultaneously. CFSE-labeled OT-I/RAG−/−/CD45.1+ cells (1 × 10⁶) were transferred to B6 (CD45.2+) hosts that were left unimmunized or were immunized with VSVOVA a day later. A, Percentage of naive donor cells in PBL was measured over time. B, Donor cell numbers present within immunized mice were expressed as a percentage of those in unimmunized animals. The values plotted represent the mean ± SD.
Cells recruited later in the response display altered response kinetics
We determined the fate of latecomer cells by transferring congenically marked OT-I cells into mice that had been infected 2 or 4 days earlier with VSV-OVA. To minimize competition with the endogenous CD8 T cells, we transferred small numbers (2000) of the OT-I cells. The frequency of Ag-specific T cell precursors is estimated to be on the order of 100–200 cells in a naive mouse, and ~10% of adoptively transferred cells “en-graft” in the recipient (14). Hence, the experiment was designed to track an equivalent number of OT-I and endogenous T cells responding to the same antigenic peptide. Two additional groups of control mice were included: one that received the donor OT-I cells a day before infection, and another that did not receive any donor cells.
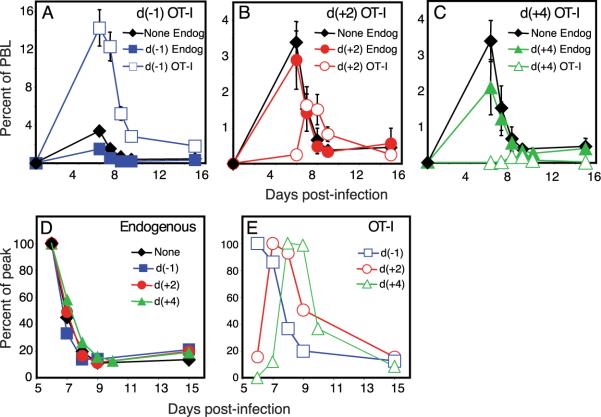
The response kinetics of the OT-I cells that were transferred before infection appeared similar to those of the endogenous Ag-specific populations within the same animals or within animals that did not receive any OT-I cells (Fig. 2_A_). However, the magnitude of the OT-I response was higher than the endogenous responses, suggesting that the engrafted OT-I cells exceeded the natural precursor frequency for OVA. Also, comparing the endogenous responses in these two control groups revealed a slight inhibition associated with the addition of OT-I cells a day earlier, which is probably due to competition (15, 16).
FIGURE 2.
Latecomer CD8 T cells exhibit a diminished and delayed peak of expansion. Four groups of B6 (CD45.2+) mice were immunized with VSV-OVA on day 0. One group of mice did not receive any OT-I cells, whereas the other three groups received OT-I cells on day −1, day +2, or day +4, respectively. The endogenous response to OVA (Endog) in the mice that did not receive any OT-I cells (None) or in those that received OT-I cells at indicated time points (d(−1), d(+ 2), and d(+4), representing days −1, +2, and +4, respectively) was tracked using MHC class I tetramers (Kb-SIINFEKL), whereas the presence of the donor OT-I cells was determined using the congenic marker CD45.1. A_−_C, Mice were analyzed at indicated time points following infection, and numbers were plotted as a percentage of total PBL. The response within the mice that did not receive any OT-I cells (None Endog) is plotted again in B and C for reference. D and E, The expansion and contraction of each subpopulation was normalized to the peak of expansion.
The transfer of OT-I cells 2 and 4 days later (Fig. 2, B and C) did not affect the endogenous responses to VSV-OVA. The latecomer OT-I cells themselves had proliferated impressively yet achieved progressively reduced burst sizes compared with the OT-I cells transferred before infection. This result is consistent with an earlier study suggesting that the T cells that encounter Ag early in the response make up the majority of the responding population (17). Surprisingly, we observed that the latecomer T cells also displayed progressively delayed kinetics. This is more clearly illustrated in Fig. 2, D and E, where the expansion and contraction of each subpopulation is graphed as the proportion of the maximum (percentage of peak). Thus, subpopulations of CD8 T cells responding to the same epitope exhibit unique response kinetics, such that latecomer populations continue to expand even while the earliest recruited cells are contracting. We observed similarly altered response kinetics within the population of latecomer T cells in the spleen as well as in nonlymphoid compartments such as the liver (data not shown). These results demonstrate that cell-intrinsic factors play a significant role in determining the onset of the contraction phase of the response.
In addition to a reduced expansion of the latecomers, we noted that there was not a precise correlation between the time of spiking and the time of the peak of expansion. Thus, the day +2 latecomer T cells peaked a day (and not two days) later than the control populations, whereas the day +4 latecomer T cells peaked 2–3 days (and not four days) later than the controls. We propose that there are two nonmutually exclusive explanations for these results. One possibility is that latecomer T cells receive a unique cell-intrinsic program that sets a reduced and abbreviated expansion phase. Alternatively, the levels of Ag presentation and other cell-extrinsic factors such as cytokines are important throughout the course of the response. The demonstration that the provision of IL-2 toward the latter part of the expansion phase alters the magnitude and timing of the proliferative peak is strong evidence that the cells undergoing a programmed expansion remain responsive to external cues from the environment (13, 18). We are currently conducting experiments to determine the relative contribution of intrinsic vs extrinsic factors to the latecomer response.
Latecomer CD8 T cells display a unique phenotype
The population of responding Ag-specific T cells is highly heterogeneous with respect to cell surface phenotype and function (19). Hence, we analyzed the latecomer T cells to determine whether priming late in the response led to phenotypic differences that could account for the heterogeneity observed during T cell responses. CD62L (L-selectin) is expressed at high levels on naive T cells and is down-regulated by most cells subsequent to activation. Thus, as expected, naive OT-I cells were uniformly CD62Lhigh (data not shown), and the majority of day −1 OT-I cells down-regulated the expression of CD62L following activation (Fig. 3_A_). However, a higher proportion of the latecomer day +2 OT-I cells remained CD62Lhigh. The down-regulation/re-expression of CD62L has been shown to correlate with the strength of stimulation during the priming phase of the response (9, 20, 21), suggesting that latecomer T cells received reduced stimulation.
FIGURE 3.
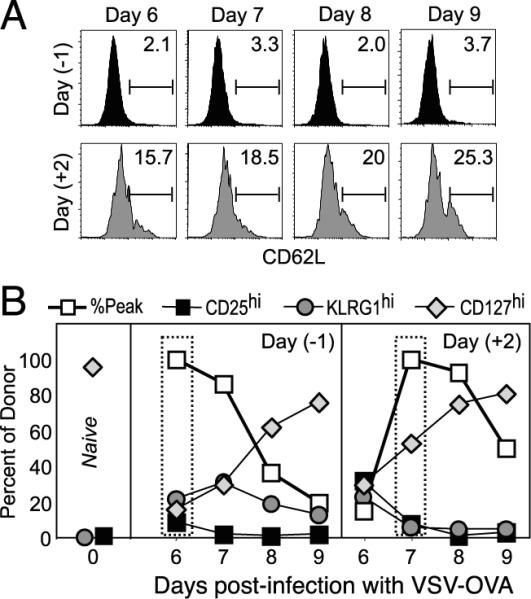
Latecomer cells display a phenotype indicative of reduced stimulation. Experiments were performed as in Fig. 2, where mice received day −1 or day +2 OT-I cells and were immunized with VSV-OVA at day 0. The expression of CD62L (L-selectin) (A) and that of CD25, KLRG1, and CD127 (IL-7Rα)(B) on the OT-I cells in the spleen were determined at days 6, 7, 8, and 9 postinfection. In B, the normalized response kinetics taken from Fig. 2_E_ (percent peak) are plotted for reference along with the percentage of donor cells expressing the indicated markers. Also indicated (left panel) is the expression of the cell surface markers on naive OT-I cells before transfer.
We also measured the expression of other surface markers that identify subpopulations of responding cells (Fig. 3_B_). The IL-2Rα-chain (CD25) is expressed on activated cells and is down-regulated by the peak of expansion (13). Consequently, the majority of control day −1 OT-I cells did not express CD25 (9% were CD25high) at day 6. However, ~32% of the latecomer day +2 cells were still CD25high at this time point, consistent with their more recent stimulation (Fig. 3_B_). By the peak of the latecomer response at day 7, most of these cells had lost the expression of CD25, similar to what was observed with the control OT-I cells at their peak of proliferation.
Expression of the killer cell lectin-like receptor G1 (KLRG1) identifies cells that are highly stimulated and have undergone extensive cell division (22). We found that very few (6%) of the day +2 OT-I cells expressed KLRG1 at the peak of their response, compared with 22% of the day −1 OT-I cells. Again, these results are consistent with the notion that latecomer T cells were less stimulated and, consequently, completed fewer rounds of division (Fig. 3_B_). The expression of IL-7Rα (CD127) at the peak of the proliferative phase was shown to identify memory CD8 T cell precursors, and this has been interpreted to indicate that IL-7-mediated signals are sufficient to allow this small subset of effector cells to survive and differentiate into memory cells (23, 24). Our analysis showed that >50% of the latecomer T cells expressed CD127 at the peak of proliferation, as compared with ~16% for the cells activated early in the response (Fig. 3_B_ and discussed further below). Another cell surface molecule thought to be involved in memory CD8 T cell formation is CD27 (25); however, we did not observe any differences between the control and latecomer OT-I cells at any of the time points analyzed (data not shown). Thus, latecomer CD8 T cells exhibit a phenotype indicative of reduced stimulation and contribute significantly to the phenotypic heterogeneity that is observed at a population level.
Similar proportions of latecomer T cells survive the contraction phase and persist as memory cells
As mentioned above, IL-7Rα has been shown to “mark” memory CD8 T cell precursors (23, 24). However, although a far greater proportion (3-fold more) of the day +2 latecomer T cells expressed IL-7Rα at the peak of their expansion (Fig. 3_B_), we were surprised to find that similar proportions of effector cells differentiated into memory cells (Fig. 4_A_). Likewise, an even greater proportion (~70%) of the day +4 OT-I cells expressed IL-7Rα at their peak (data not shown), yet only a small proportion of them differentiated into memory cells (Fig. 4_A_). In fact, the efficiency of memory generation was slightly lower for the day +4 cells, although this result was not consistently reproduced. Nonetheless, it is clear that although IL-7 is essential for CD8 T cell survival during the contraction phase (23, 26), the expression of IL-7Rα alone is not sufficient to direct memory cell differentiation (27).
FIGURE 4.
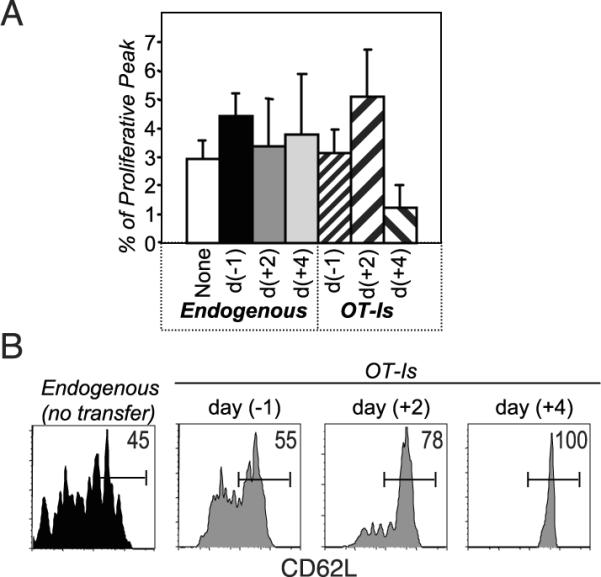
Similar proportions of latecomer T cells survive the contraction phase. Experiments were performed as in Fig. 2. The endogenous and the OT-I responses in PBL were tracked during all phases of the response. A, The efficiency of memory generation was calculated by expressing the proportion of memory cells present in PBL (at day 71) as a percentage of the respective proliferative peaks. B, The expression of CD62L on the indicated cell populations in the spleen was determined at ~3 mo postinfection. Numbers plotted are the percentage of cells that are CD62Lhigh.
Memory CD8 T cells have been subdivided into central memory (TCM) and effector memory (TEM) cells primarily on the basis of expression of CCR7 and CD62L (28). As noted above, a greater proportion of latecomer T cells expressed CD62L during the expansion phase (Fig. 3_A_), and this difference continued into the memory phase (Fig. 4_B_). Thus, based upon current nomenclature, our data suggest that latecomer T cells preferentially differentiate into TCM cells (9). However, although TCM cells are thought to reside primarily within secondary lymphoid organs (28), we found that latecomer memory CD8 T cells were also present in nonlymphoid organs such as the liver and small intestinal lamina propria (data not shown). Thus, the surviving latecomer T cells do not appear to be identical with the originally defined TCM memory cell subset.
Memory cells generated from latecomer T cells are functional
We tested surviving OT-I cells for their ability to exhibit functional characteristics of memory T cells. Similar proportions of day −1, day +2, and day +4 OT-I memory cells produced IL-2 and IFN-γ after in vitro restimulation (data not shown). Hence, we next determined whether they were capable of responding to a challenge infection in vivo. Experiments were set up as before (Fig. 2), and the number of Ag-specific CD8 T cells present in blood during the memory phase was determined (Fig. 5). The mice were challenged with Lm-OVA, and the recall responses in PBL were determined at day 5 (data not shown) and day 7 postchallenge (Fig. 5). The latecomer memory cells greatly expanded in response to the challenge infection. In fact, before the challenge infection we were sometimes unable to observe day +4 memory cells (even upon counting 450,000 cells in the representative shown), and yet even in these animals we detected impressive expansion following the challenge. Thus, the latecomer memory cells possess all of the characteristics associated with functional memory and may even exhibit an enhanced proliferative capacity.
FIGURE 5.
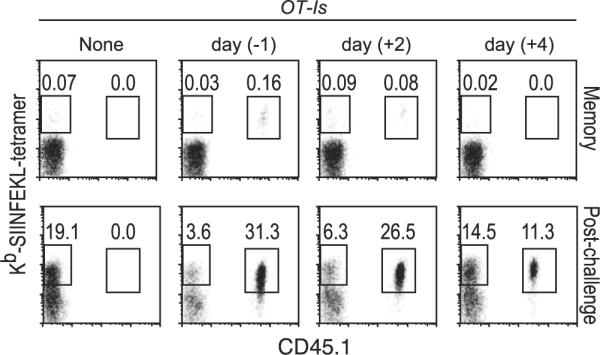
Latecomer T cells are capable of differentiating into functional memory cells. Experiments were performed as in Fig. 2. At ~4 mo postinfection, the percentage of endogenous SIINFEKL-specific cells (tetramer+CD45.1−) and donor OT-I cells (tetramer+CD45.1+) in PBL was determined. The mice were then challenged with Lm-OVA a day later and analyzed at day 7 postchallenge. Cells were gated on CD8+ cells, and the numbers indicated are the percentages of total PBL.
In conclusion, we demonstrated for the first time that latecomer CD8 T cells are imprinted with a unique differentiation program such that their peak of expansion is delayed compared with the cells that were recruited early. The latecomer cells also achieved a reduced burst size and displayed a cell surface phenotype indicative of reduced stimulation. However, in contrast to a recent report demonstrating that latecomer CD8 T cells were preferentially recruited into the memory pool in response to Lm-OVA (9), our studies show that this does not hold for VSV. This finding highlights the contribution of other factors in addition to the time of recruitment in the process of memory generation. It is likely that differences in dose and persistence of Ag as well as the levels of inflammatory cytokines contribute to the observed differences, and we are currently investigating these possibilities.
Acknowledgments
We sincerely thank Dr. Vaiva Vezys and Dr. Dave Masopust for providing us with tetramers. We also thank them and Dr. Maureen McGargill and Dr. Ananda Goldrath for reading of the manuscript and discussions.
This work was supported by funds from the Leukemia Lymphoma Society (to W.N.D.) and by National Institutes of Health Grants R37 AI21372 and RO1 AI37988 (to S.M.H.).
Footnotes
3
Abbreviations used in this paper: VSV, vesicular stomatitis virus; KLRG1, killer cell lectin-like receptor G1; Lm, Listeria monocytogenes; TCM, central memory CD8 T cell.
Disclosures The authors have no financial conflict of interest.
References
- 1.Wong P, Pamer EG. Cutting edge: antigen-independent CD8 T cell proliferation. J. Immunol. 2001;166:5864–5868. doi: 10.4049/jimmunol.166.10.5864. [DOI] [PubMed] [Google Scholar]
- 2.Kaech SM, Ahmed R. Memory CD8+ T cell differentiation: initial antigen encounter triggers a developmental program in naive cells. Nat. Immunol. 2001;2:415–422. doi: 10.1038/87720. [DOI] [PMC free article] [PubMed] [Google Scholar]
- 3.van Stipdonk MJ, Lemmens EE, Schoenberger SP. Naive CTLs require a single brief period of antigenic stimulation for clonal expansion and differentiation. Nat. Immunol. 2001;2:423–429. doi: 10.1038/87730. [DOI] [PubMed] [Google Scholar]
- 4.Gett AV, Sallusto F, Lanzavecchia A, Geginat J. T cell fitness determined by signal strength. Nat. Immunol. 2003;4:355–360. doi: 10.1038/ni908. [DOI] [PubMed] [Google Scholar]
- 5.van Stipdonk MJ, Hardenberg G, Bijker MS, Lemmens EE, Droin NM, Green DR, Schoenberger SP. Dynamic programming of CD8+ T lymphocyte responses. Nat. Immunol. 2003;4:361–365. doi: 10.1038/ni912. [DOI] [PubMed] [Google Scholar]
- 6.Badovinac VP, Porter BB, Harty JT. Programmed contraction of CD8(+) T cells after infection. Nat. Immunol. 2002;3:619–626. doi: 10.1038/ni804. [DOI] [PubMed] [Google Scholar]
- 7.Ahmed R, Gray D. Immunological memory and protective immunity: understanding their relation. Science. 1996;272:54–60. doi: 10.1126/science.272.5258.54. [DOI] [PubMed] [Google Scholar]
- 8.Sprent J, Tough DF. T cell death and memory. Science. 2001;293:245–248. doi: 10.1126/science.1062416. [DOI] [PubMed] [Google Scholar]
- 9.van Faassen H, Saldanha M, Gilbertson D, Dudani R, Krishnan L, Sad S. Reducing the stimulation of CD8+ T cells during infection with intracellular bacteria promotes differentiation primarily into a central (CD62LhighCD44high) subset. J. Immunol. 2005;174:5341–5350. doi: 10.4049/jimmunol.174.9.5341. [DOI] [PubMed] [Google Scholar]
- 10.Jelley-Gibbs DM, Brown DM, Dibble JP, Haynes L, Eaton SM, Swain SL. Unexpected prolonged presentation of influenza antigens promotes CD4 T cell memory generation. J. Exp. Med. 2005;202:697–706. doi: 10.1084/jem.20050227. [DOI] [PMC free article] [PubMed] [Google Scholar]
- 11.Sprent J, Miller JF, Mitchell GF. Antigen-induced selective recruitment of circulating lymphocytes. Cell. Immunol. 1971;2:171–181. doi: 10.1016/0008-8749(71)90036-0. [DOI] [PubMed] [Google Scholar]
- 12.Lefrancois L, Altman JD, Williams K, Olson S. Soluble antigen and CD40 triggering are sufficient to induce primary and memory cytotoxic T cells. J. Immunol. 2000;164:725–732. doi: 10.4049/jimmunol.164.2.725. [DOI] [PubMed] [Google Scholar]
- 13.D'Souza WN, Lefrancois L. IL-2 is not required for the initiation of CD8 T cell cycling but sustains expansion. J. Immunol. 2003;171:5727–5735. doi: 10.4049/jimmunol.171.11.5727. [DOI] [PubMed] [Google Scholar]
- 14.Blattman JN, Antia R, Sourdive DJ, Wang X, Kaech SM, Murali-Krishna K, Altman JD, Ahmed R. Estimating the precursor frequency of naive antigen-specific CD8 T cells. J. Exp. Med. 2002;195:657–664. doi: 10.1084/jem.20001021. [DOI] [PMC free article] [PubMed] [Google Scholar]
- 15.Butz EA, Bevan MJ. Massive expansion of antigen-specific CD8+ T cells during an acute virus infection. Immunity. 1998;8:167–175. doi: 10.1016/s1074-7613(00)80469-0. [DOI] [PMC free article] [PubMed] [Google Scholar]
- 16.Kedl RM, Rees WA, Hildeman DA, Schaefer B, Mitchell T, Kappler J, Marrack P. T cells compete for access to antigen-bearing antigen-presenting cells. J. Exp. Med. 2000;192:1105–1113. doi: 10.1084/jem.192.8.1105. [DOI] [PMC free article] [PubMed] [Google Scholar]
- 17.Bousso P, Levraud JP, Kourilsky P, Abastado JP. The composition of a primary T cell response is largely determined by the timing of recruitment of individual T cell clones. J. Exp. Med. 1999;189:1591–1600. doi: 10.1084/jem.189.10.1591. [DOI] [PMC free article] [PubMed] [Google Scholar]
- 18.Blattman JN, Grayson JM, Wherry EJ, Kaech SM, Smith KA, Ahmed R. Therapeutic use of IL-2 to enhance antiviral T-cell responses in vivo. Nat. Med. 2003;9:540–547. doi: 10.1038/nm866. [DOI] [PubMed] [Google Scholar]
- 19.Woodland DL, Dutton RW. Heterogeneity of CD4(+) and CD8(+) T cells. Curr. Opin. Immunol. 2003;15:336–342. doi: 10.1016/s0952-7915(03)00037-2. [DOI] [PubMed] [Google Scholar]
- 20.Wherry EJ, Teichgraber V, Becker TC, Masopust D, Kaech SM, Antia R, Von Andrian UH, Ahmed R. Lineage relationship and protective immunity of memory CD8 T cell subsets. Nat. Immunol. 2003;4:225–234. doi: 10.1038/ni889. [DOI] [PubMed] [Google Scholar]
- 21.Marzo AL, Klonowski KD, Le Bon A, Borrow P, Tough DF, Lefrancois L. Initial T cell frequency dictates memory CD8+ T cell lineage commitment. Nat. Immunol. 2005;6:793–799. doi: 10.1038/ni1227. [DOI] [PMC free article] [PubMed] [Google Scholar]
- 22.Voehringer D, Blaser C, Brawand P, Raulet DH, Hanke T, Pircher H. Viral infections induce abundant numbers of senescent CD8 T cells. J. Immunol. 2001;167:4838–4843. doi: 10.4049/jimmunol.167.9.4838. [DOI] [PubMed] [Google Scholar]
- 23.Kaech SM, Tan JT, Wherry EJ, Konieczny BT, Surh CD, Ahmed R. Selective expression of the interleukin 7 receptor identifies effector CD8 T cells that give rise to long-lived memory cells. Nat. Immunol. 2003;4:1191–1198. doi: 10.1038/ni1009. [DOI] [PubMed] [Google Scholar]
- 24.Huster KM, Busch V, Schiemann M, Linkemann K, Kerksiek KM, Wagner H, Busch DH. Selective expression of IL-7 receptor on memory T cells identifies early CD40L-dependent generation of distinct CD8+ memory T cell subsets. Proc. Natl. Acad. Sci. USA. 2004;101:5610–5615. doi: 10.1073/pnas.0308054101. [DOI] [PMC free article] [PubMed] [Google Scholar]
- 25.Hendriks J, Gravestein LA, Tesselaar K, van Lier RA, Schumacher TN, Borst J. CD27 is required for generation and long-term maintenance of T cell immunity. Nat. Immunol. 2000;1:433–440. doi: 10.1038/80877. [DOI] [PubMed] [Google Scholar]
- 26.Schluns KS, Kieper WC, Jameson SC, Lefrancois L. Interleukin-7 mediates the homeostasis of naive and memory CD8 T cells in vivo. Nat. Immunol. 2000;1:426–432. doi: 10.1038/80868. [DOI] [PubMed] [Google Scholar]
- 27.Lacombe MH, Hardy MP, Rooney J, Labrecque N. IL-7 receptor expression levels do not identify CD8+ memory T lymphocyte precursors following peptide immunization. J. Immunol. 2005;175:4400–4407. doi: 10.4049/jimmunol.175.7.4400. [DOI] [PubMed] [Google Scholar]
- 28.Sallusto F, Lenig D, Forster R, Lipp M, Lanzavecchia A. Two subsets of memory T lymphocytes with distinct homing potentials and effector functions. Nature. 1999;401:708–712. doi: 10.1038/44385. [DOI] [PubMed] [Google Scholar]
