Activation of Notch signaling in tumorigenesis of experimental pancreatic cancer induced by dimethylbenzanthracene in mice (original) (raw)
Abstract
To establish pancreatic cancer in mice, dimethylbenzanthracene (DMBA) was administered into mice pancreata. The formation of tubular complex lesions was found in the pancreatic sections from 2 weeks after DMBA treatment. Abnormal tubular complex formations with ductal metaplasia were found from 1 month after the administration. By 3 months after DMBA injection into the pancreas, 6 of 10 mice showed visually recognizable tumors with precursor lesions of various types of cell atypia. In contrast, there were no visually or histologically detectable tumors in the placebo‐treated animals. The expression profiles of smad 4, cyclin D1 and p53 in the DMBA‐induced tumors were similar to those of human pancreatic cancer, suggesting that this would be a useful mouse model for studying the morphological and molecular mechanisms involved in pancreatic carcinogenesis. Immunohistochemical study using specific antibodies revealed that Notch‐1 and Hes‐1 were expressed in lesions ranging from tubular complexes to carcinoma in these chemically induced pancreatic tumors. Semiquantitative reverse transcription–polymerase chain reaction with microdissection demonstrated that Notch‐1 expression was continuous from precursor lesions to carcinoma cells, whereas Pdx‐1 expression was attenuated in carcinoma cells compared to precursor lesions. In addition, inhibition of the Notch signaling pathway by the γ‐secretase inhibitor _N_‐(_N_‐[3,5‐difluorophenacetyl]‐l‐alanyl)‐_S_‐phenylglycine _t_‐butyl ester reduced pancreatic cancer cell growth. Therefore, Notch signaling is required to form the tubular complexes and its continuous activation might lead to the transition from tubular complexes to premalignant or malignant lesions and carcinoma cell development in the pancreas. (Cancer Sci 2007; 98: 155–162)
Abbreviations:
DAPT
_N_‐(_N_‐[3,5‐difluorophenacetyl]‐l‐alanyl)‐_S_‐phenylglycine _t_‐butyl ester
DMBA
dimethylbenzanthracene
DMSO
dimethylsulfoxide
GAPDH
glyceraldehyde‐3‐phosphate dehydrogenase
MTT
(3‐4,5‐dimethylthiazol‐2‐yl)‐2,5‐diphenyltetrazolium bromide
PanIN
pancreatic intraepithelial neoplasia
PBS
phosphate‐buffered saline
PCR
polymerase chain reaction
RFLP
restriction fragment length polymorphism
RT
reverse transcription
TGFα
transforming growth factor α mPanIN, mouse pancreatic intraepithelial neoplasia.
Pancreatic cancer is one of the most malignant gastrointestinal tumors. Once pancreatic cancer is clinically evident, it progresses rapidly to develop metastatic lesions, frequently by the time of diagnosis. Early detection of pancreatic cancer is required to improve its poor prognosis. Recent studies have identified PanIN as a premalignant lesion.( 1 ) Thus, it is important to clarify the mechanisms involved in the transition from normal duct to PanIN for the development of novel methods to detect early pancreatic cancer. The formation of PanIN‐like lesions has been shown to occur in the context of a metaplasia–neoplasia sequence involving acinar‐to‐ductal metaplasia in TGFα transgenic mouse models.( 2 ) The rapid transdifferentiation of acinar cells to ductal cells is also seen in chemically induced experimental pancreatic cancer in rats.( 3 , 4 ) This rat model is generated by implantation of the carcinogen DMBA and shows rapid and frequent tumor formation histologically similar to human ductal adenocarcinoma. However, there has been no experimental mouse pancreatic cancer model that could be generated without using gene engineering. A mouse model would be useful for molecular analyses as its genome sequence is well studied compared to other animals such as rat or hamster.
Notch signaling is involved in regulating the balance between cell differentiation and stem cell proliferation during the development of numerous tissues, including the pancreas.( 5 , 6 , 7 ) Notch is thought to prevent cellular differentiation and maintain the population of undifferentiated precursor cells.( 8 , 9 ) Recent studies showed that the Notch signaling pathway is involved in the carcinogenesis of various organs.( 10 , 11 ) Notch family genes are also upregulated in human pancreatic cancer tissues( 2 ) and are related to neurovascular progression.( 12 ) In mouse pancreas, ectopic Notch activation results in the accumulation of nestin‐positive precursor cells and in expansion of the conversion from an acinar cell‐predominant epithelium to duct cell‐predominant epithelium in vitro. ( 2 ) In addition, Notch pathway activation was shown to be required in the early stages of neoplasia and for mediating metaplastic conversion in TGFα transgenic mice.( 2 ) These data suggest that Notch activation is involved in the earliest stages of pancreatic tumorigenesis, prior to the formation of PanIN‐like lesions. This raises the question of whether Notch activation correlates with carcinogenesis of the pancreas without initiation by TGFα overexpression in vivo. The objective of the present study is to establish a chemically induced mouse experimental pancreatic cancer model and to explore the role of Notch signaling in the carcinogenesis of the pancreas in this model.
Materials and Methods
Animals. The present study was conducted with the consent of the Ethics Committee for the Use of Experimental Animals of the Tohoku University Graduate School of Medicine. Male green mice, C57BL/6 Tg14 (act‐EGFP) Osb Y01, were used. After anesthesia by pentobarbital injection into the abdominal cavity, 1 mg of DMBA (Sigma, St Louis, MO, USA) dissolved in 0.1% polyoxyethylenesorbitan monolaurate or the same concentration of NaCl solution (placebo) was administered into the pancreatic tail of the mice. Surviving mice were killed at 2 weeks and at 1, 2 and 3 months, and pancreata were evaluated histologically (Table 1).
Table 1.
Histological findings of mice treated with dimethylbenzanthracene (DMBA) and controls
| Mouse group | n | Histological findings | Frequency |
|---|---|---|---|
| 2 weeks | |||
| DMBA | 4 | Tubular complexes | 4/4 |
| Control | 4 | No change | 4/4 |
| 1 month | |||
| DMBA | 5 | metaplastic lesions | 5/5 |
| Control | 4 | No change | 4/4 |
| 2 month | |||
| DMBA | 5 | Carcinoma (sarcomatoid) | 3/5 |
| Dysplasic lesions | 2/5 | ||
| Control | 4 | No change | 4/4 |
| 3 months | |||
| DMBA | 5 | Carcinoma (sarcomatoid) | 3/5 |
| Dysplasic lesions | 2/5 | ||
| Control | 4 | No change | 4/4 |
Immunohistochemistry. The tissue sections from formalin‐fixed paraffin blocks were deparaffinized and antigens were retrieved by boiling the sections in Target Retrieval Solution (DAKO, Carpinteria, CA, USA) in a microwave oven. The sections were then incubated in methanol with 0.3% hydrogen peroxide for 30 min in order to block endogenous peroxidase activity. Thereafter, a VECTOR MOM Immunodetection kit and/or Vectastain ABC kit (Vector Laboratories, Burlingame, CA, USA) was used according to the manufacturer's recommendation. Visualization of the immunoreaction was carried out in 0.06 mM 3,3′‐diaminobenzidine tetrahydrochloride (Dojin, Kumamoto, Japan) containing 2 mM hydrogen peroxide in PBS for several minutes at room temperature. For the negative control, the immunostaining processes were carried out by replacing the primary antibody with PBS. The negative control sections showed no specific immunoreactivity.
The primary antibodies used in the present study were as follows: goat anti‐Notch‐1 antibody (SantaCruz Biotechnology, Santa Cruz, CA, USA); goat anti‐Hes‐1 antibody (SantaCruz Biotechnology); mouse anti‐cytokeratin antibody (Nichirei, Tokyo, Japan); rabbit anti‐vimentin antibody (SantaCruz Biotechnology); mouse monoclonal anti‐smad4 antibody (SantaCruz Biotechnology); rabbit anti‐cyclin D1 antibody (SantaCruz Biotechnology); mouse monoclonal anti‐p53 antibody (DAKO); mouse monoclonal anti‐nestin antibody (BD, San Jose, CA, USA); mouse monoclonal anti‐chymotrypsin antibody (Morphosis US, Kingston, NH, USA); and goat anti‐Pdx1 antibody (SantaCruz Biotechnology).
Pancreatic tissue samples and microdissection. The pancreatic tissues of the mice collected at the time of surgery were embedded immediately in Tissue‐Tek OCT compound medium (Sakura, Tokyo, Japan), frozen in liquid nitrogen and stored at −80°C. The frozen tissues were cut into 8‐µm sections using a crsyostat (Jung CM3000; Leica, Nussloch, Germany) and then fixed in cold methanol and stained with toluidine blue. Histologically normal, dysplastic and cancerous ductal cells from pancreata were dissected using LaserScissors Pro300 (Cell Robotics, Albuquerque, NM, USA) according to the manufacturer's protocols. These microdissected samples were subjected to RNA or DNA extraction.
Cell culture. Three pancreatic cancer cell lines (AsPC‐1, BxPC3 and MIAPaca2) were purchased from American Type Culture Collection (Manassas, VA, USA), grown routinely in modified Eagle's medium (Invitrogen, Grand Island, NY, USA) containing 10% fetal bovine serum (Miles, Kankakee, IL, USA) and were maintained at 37°C in 5% CO2 in a humidified environment.
RNA extraction and RT‐PCR. The microdissected samples or cultured cancer cells were collected in 350 µL of RLT lysis buffer and extracted using an RNeasy kit (QIAGEN, Hilden, Germany) with _DNase_I treatment in accordance with the manufacturer's recommendation. First‐strand cDNA was generated from the extracted total RNA with random decamer (Ambion, Austin, TX, USA) for microdissected tissue samples, or with oligo dT (Ambion) for cultured cells. PCR was carried out on 2 µL of RT product in a 25‐µL reaction mixture using Ex Taq polymerase (Takara, Otsu, Japan) with 3′ and 5′ primer concentrations of 10 µmol/L each. Products were run on a 1.5% agarose gel in 1× Tris–borate–ethylenediaminetetracetic acid buffer at 100 V. Bands were visualized under ultraviolet light after staining the gel for 20 min in a 0.5 µg/mL ethidium bromide solution and their sizes were determined using a 100‐bp DNA ladder (Takara). Gene expression was normalized to the level of GAPDH using Scion Image Software (Scion Corporation, Frederick, MD, USA). The PCR conditions for our cDNA templates were optimized to ensure replication was in the linear phase for each primer set used. The primer sequences were as follows: Notch‐1, forward 5′‐CAG CTT GCA CAA CCA GAC AGA C‐3′ and reverse 5′‐ACG GAG TAC GGC CCA TGT T‐3′;( 13 ) Pdx‐1 (with modification of primers for rat),( 14 ) forward 5′‐CTC GCT GGG ATC ACT GGA GCA3′; and reverse 5′‐GCT TTG GTG GAT TTC ATC CAC GG‐3′ GAPDH, forward 5′‐CTG CAC CAC CAA CTG CTT AG‐3′ and reverse 5′‐AGA TCC ACG ACG GAC ACA TT‐3′;( 15 ) human Hes‐1, forward 5′‐ACA CCG GAT AAA CCA AAG AC‐3′ and reverse 5′‐TGA TCT GGG TCA TGC AGT TG‐3′;( 16 ) and human GAPDH, forward 5′‐GGG AAG GTG AAG GTC GGA G‐3′ and reverse 5′‐GAG GGG GCA GAG ATG ATG A‐3′.( 17 ) PCR conditions were as follows: GAPDH, 94°C for 45 s, 60°C for 45 s, and 72°C for 2 min for 35 cycles with a final extension at 72°C for 7 min for microdissected samples and 22 cycles for cultured cells; Notch1 and Pdx‐1, 94°C for 1 min, 55°C for 1 min, and 72°C for 2 min for 45 cycles; Hes‐1, 94°C for 1 min, 60°C for 1 min, and 72°C for 2 min for 30 cycles with a final extension at 72°C for 10 min. Real‐time RT‐PCR was also used to evaluated human Hes‐1 expression using LightCycler and LightCycler–FastStart DNA Master SYBR Green I (Roche Diagnostics, Basel, Switzerland). All reactions were carried out according to the manufacturer's protocols. The primer sequences were the same as above. The annealing temperature for these primer sets was 60°C. The specificity of each PCR reaction was confirmed by melting curve analysis. The level of target gene expression in each sample was normalized to the respective GAPDH expression level.
DNA extraction and the detection of K‐ras gene alteration. Point mutation of the K‐ras gene at codon 12 was examined by primer‐mediated PCR‐RFLP analysis according to the method of Cazorla et al.( 18 ) and sequencing from microdissected metaplastic and cancerous lesions. DNA was extracted as described previously.( 19 ) First‐step amplification was carried out in a final reaction volume of 50 µL, containing amplification buffer (Takara) and 2.5 units of Ex Taq polymerase. The primer sequences were as follows: first K‐ras, forward 5′‐TTA TTA TTT TTA TTG TAA GGC CTG C‐3′ and reverse 5′‐GCA CGC AGA CTG TAG AGC AG‐3′; and second K‐ras, forward 5′‐TAT AAA CTT GTG GTG GTT GGA CCT‐3′ and reverse 5′‐CCT CTA TCG TAG GGT CGT AC‐3′;. The PCR program consisted of 30 cycles (for the first PCR) or 40 cycles (for nested PCR) for 30 s at 94°C, 30 s at 55°C and 1 min at 72°C. Aliquots (10 L) of the second PCR reaction were digested with restriction enzyme _BstN_I (New England Biolabs, Beverly, MA, USA) and electrophoresed on a 2% agarose gel. Bands were visualized under ultraviolet light after staining the gel for 20 min in a 0.5 µg/mL ethidium bromide solution and their size was determined using a 100 bp DNA ladder (Takara). Any mutation of codon 12 eliminates the restriction site for this enzyme, whereas the wild‐type codon is digested. The PCR products were also subjected to direct sequencing.
Western blot analysis. For whole‐cell protein extraction, cells were lysed by the addition of lysis buffer (50 mM Tris‐HCl [pH 7.4], 1% Nonidet P‐40 [NP‐40], 0.5% sodium deoxycholate). The protein concentration in each sample was determined using a Bradford assay kit (Dojin). After the addition of 5× sample buffer (1 M Tris‐HCl [pH 6.8], sodium dodecylsulfate, glycerol and bromphenol blue) the aliquots were boiled for 5 min and subjected to sodium dodecylsulfate–polyacrylamide gel electrophoresis. After blocking for 1 h at room temperature in a buffer containing 10 mmol/L Tris‐HCl (pH 7.5), 100 mmol/L NaCl, 0.1% Tween 20 and 5% dry milk, nitrocellulose membranes (Bio‐Rad Laboratories, Hercules, CA, USA) were incubated either with goat anti‐Notch‐1 polyclonal antibody, rabbit anti‐cyclin D1 antibody, mouse monoclonal anti‐nestin antibody or mouse monoclonal anti‐α‐tubulin antibody (SantaCruz Biotechnology) overnight at 4°C. The membranes were then washed with a buffer containing 10 mmol/L Tris‐HCl, pH 7.5, 100 mmol/L NaCl, 0.1% Tween 20 and incubated with antigoat‐IgG, antirabbit‐IgG or antimouse‐IgG coupled to peroxidase (Amersham Biosciences, Buckinghamshire, UK) for 1 h at room temperature. Reactive bands were detected using ECL chemiluminesence reagent (Amersham Biosciences). The bands obtained were subjected to densitometry analysis using Scion Image Software.
Notch inhibitor treatment and cell growth assay. Endogenous Notch pathway inhibition was achieved using the γ‐secretase inhibitor DAPT (Calbiochem, Darmstadt, Germany).( 20 ) Ten thousand and 2 million BxPC3 cells were seeded per well in triplicate in 96‐well plates and six‐well plates, respectively, in normal growth media. After 24 h incubation, the media was switched to serum‐free media containing of DAPT (0–20 µM) dissolved in DMSO or the same concentration of DMSO alone as control. RNA or protein was extracted as described above from cells in six‐well plates after further incubation for 48 h, or cell growth was measured by MTT assay for cells in 96‐well plates after 72 h further incubation. For the MTT assay, cells were labeled with MTT at a concentration of 0.5 mg/mL for 2 h, and then solubilized by DMSO. The color reaction was measured using a spectrometer at a wavelength of 570 nm. Each experiment was repeated at least twice, and representative data are shown.
Statistical analysis. Data are shown as the mean ±SD. Microsoft Excel computer software (Microsoft, Redmond, WA, USA) for the _t_‐test was used for statistical analyses. A _P_‐value less than 0.05 was considered to be statistically significant.
Results
Generation of mouse model for pancreatic cancer using DMBA. The formation of tubular complex lesions was found in the pancreatic sections from 2 weeks after DMBA treatment (Fig. 1A). Abnormal metaplastic epithelium appeared in the specimens from 1 month after the treatment (Fig. 1B–D), whereas no obvious tumors were seen at this time point. Two to three months after DMBA injection into the pancreas, six of 10 mice showed visually recognizable tumors in the pancreas (Fig. 2) with premalignant lesions of various types of dysplasia (Fig. 1E) and pleomorphic carcinoma (Fig. 1F). There were no visually or histologically detectable tumors in the placebo‐treated animals (Table 1). Positive cytokeratin and Periodic acid schiff (PAS) stain as well as negative vimentin staining of this pleomorphic tumor revealed ductal adenocarcinoma (Fig. 3). In addition, the carcinoma that occurred in the DMBA‐administered pancreas expressed nestin, indicating that the carcinoma cells were undifferentiated (Fig. 3). Recently, this type of carcinoma has been designated sarcomatoid carcinoma.( 21 )
Figure 1.
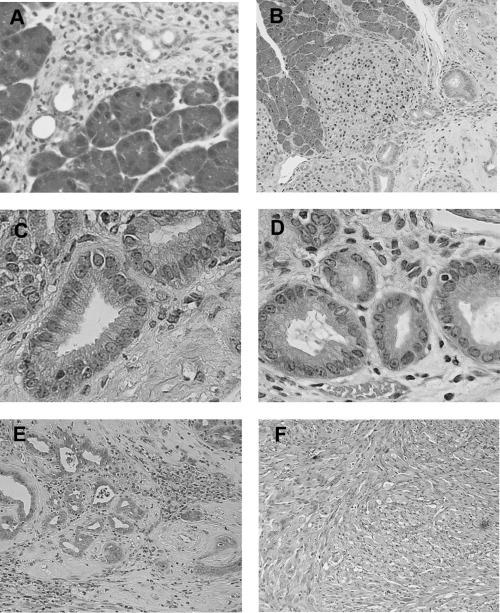
Histological findings of pancreas 2 weeks, 2 months and 3 months following the administration of dimethylbenzanthracene (DMBA). (A) Two weeks after injection, tubular complexes were present focally among acinar cells (H&E, original magnification × 200). (B) Ductal metaplasia adjacent to normal acinar tissues at 2 months after DMBA injection (H&E, original magnification × 50). (C) and (D) are high‐power views of mild dysplastic lesions in part (B). Mucin‐producing epithelial cells were seen within the metaplasic lesions (H&E, original magnification × 200). (E) Adenocarcinoma lesions accompanied by dysplastic lesions were seen in the pancreas 2 months after the administration of DMBA. (F) Ductal adenocarcinoma (sarcomatoid carcinoma) developed 3 months after the implantation of DMBA (H&E, original magnification × 200).
Figure 2.
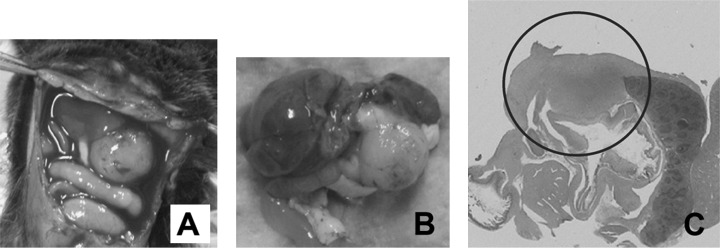
The administration of dimethylbenzanthracene (DMBA) produced a tumor in the pancreatic tail after 3 months. (A and B) A pancreatic tumor (∼10 mm in diameter) invading neighboring organs was observed clearly; B is the extracted tissues. (C) Pancreatic tumor (circled) invaded the spleen and colon (H&E, original magnification × 100).
Figure 3.
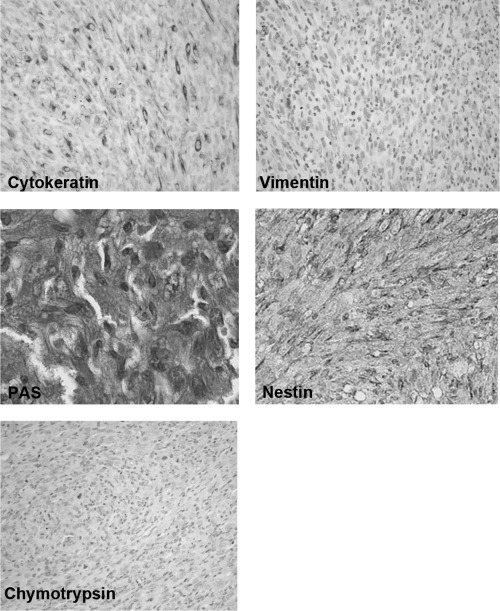
Pancreatic tumors developed with the carcinogen dimethylbenzanthracene originated from epithelial cells. Positive immunoreactivity of cytokeratin (left in upper panel), and Periodic acid schiff (PAS) stain‐positive cells were detected in carcinoma cells (left in middle panel) whereas immunostaining of vimentin was not seen in these lesions (right in upper panel). Intense positive staining of nestin was also observed in carcinoma cells (right middle panel). Chymotrypsin immunoreactivity was not seen in carcinoma cells (left lower panel) (original magnification × 200).
Nuclear smad4 staining was observed in the lesions of metaplastic epithelium and the number of positive smad4 cells decreased as the grade of cell atypia progressed (Fig. 4A,B). Increased expression of cyclin D1 was found as the histological grade progressed from metaplastic lesions to invading cancer cells (Fig. 4C,D). In addition, p53 accumulation was evident in cancer lesions whereas very faint staining was seen in ductal metaplastic lesions (Fig. 4E,F). These smad4, cyclin D1 and p53 expression profiles are likely to be similar to those of human pancreatic cancer.( 22 )
Figure 4.
Smad4, cyclin D1 and p53 expression in the chemically induced pancreatic tumors. (A) Intense nuclear expression of smad4 was found in metaplastic lesions. (B) In contrast, the expression of smad4 had disappeared in carcinoma cells. Nuclear expression of cyclin D1 was found more frequently in carcinoma cells (D) but very rarely in metaplastic lesions (C). Nuclear accumulation of p53 is abundant in carcinoma cells (F) but not in metaplastic lesions (E). Although a VECTOR MOM immunodetection kit was used to reduce the background of mouse p53 antibody on mouse tissue, the stromal cells around metaplastic ductal lesions showed background staining to some extent (E). (Original magnification × 200.)
Expression of Notch signaling in precursor and cancer lesions. To evaluate the role of Notch signaling in the early steps of pancreatic carcinogenesis, we examined the expression of Notch‐1 and its target gene Hes‐1 in the DMBA‐induced tumors. The expression of these gene products was detectable in lesions ranging from tubular complexes to carcinoma lesions whereas no or very faint expression was observed in normal duct, acinar and islet cells. As shown in Fig. 5, the simultaneous expression of Notch‐1 and Hes‐1 protein was detected in premalignant metaplastic lesions (Fig. 5C,D) and in sarcomatoid carcinoma lesions (Fig. 5E,F), whereas no or very faint expression of these protein was seen in normal pancreas (Fig. 5A,B).
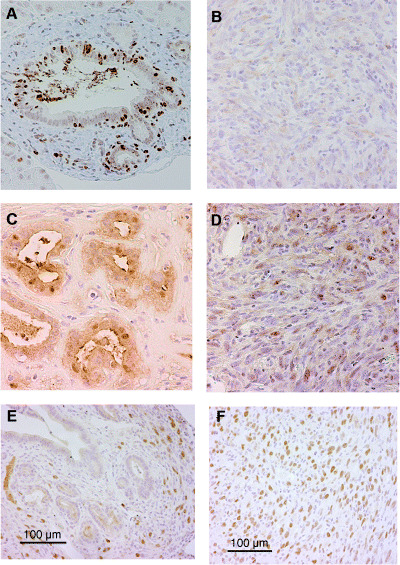
Figure 5.
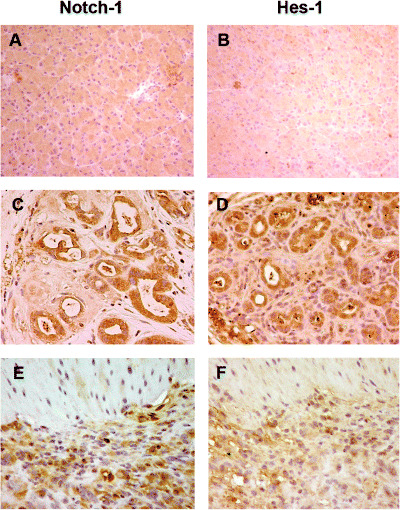
Activation of the Notch pathway in pancreatic carcinogenesis of mice. (C) Notch‐1 and (D) Hes‐1 were expressed in the cytoplasm and nuclei of metaplastic lesions whereas no positive staining of these proteins was seen in normal pancreas (A, Notch‐1; B, Hes‐1). Dominant nuclear expression of (E) Notch‐1 and (F) Hes‐1 was observed in sarcomatoid carcinoma cells. (Original magnification × 200.)
Expression of Pdx‐1 in DMBA‐induced pancreatic lesions. We also investigated the expression of Pdx‐1 as a marker for pancreatic progenitor cells to examine the status of differentiation of the epithelium in the pancreas treated with DMBA. The immunoreactivity of Pdx‐1 was clearly observed in ductal metaplastic lesions as well as in cancer lesions in DMBA‐induced mouse tumors, whereas no expression was found in stromal cells around ducts and normal duct cells (Fig. 6B,C). The immunoreactivity of Pdx‐1 appeared to be more intense in premalignant lesions than in carcinoma cells where heterozygous expression of this gene was notable. However, no positive staining of Pdx‐1 was observed in normal pancreas (Fig. 6A).
Figure 6.
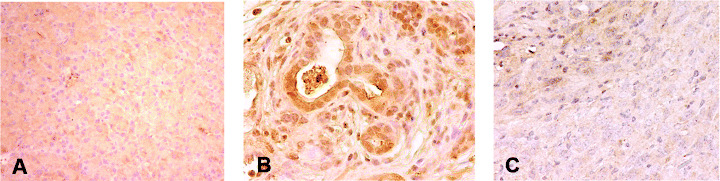
Pdx‐1 expression in tumors developed in dimethylbenzanthracene (DMBA)‐injected pancreas. Strong expression of Pdx‐1 protein was found in (B) metaplastic lesions and (C) heterogeneously in carcinoma lesions, but (A) this protein expression was not observed in normal pancreas. The area indicated by the arrowhead shows the expression of Pdx‐1, which was absent in other areas. In addition, the dark brown staining was stronger in the metaplastic duct compared to carcinoma cells. (Original magnification × 200.)
RNA expression of Notch‐1 and Pdx‐1, and K‐ras gene mutation in pancreatic carcinogenesis. To compare the intensity of gene expression among various lesions, normal, ductal metaplastic and carcinoma lesions were microdissected carefully and subjected to semiquantitative RT‐PCR. As shown in Fig. 7A, the targeted lesions were dissected selectively and the RNA was extracted. Consistent mRNA expression of Notch‐1 was detected in metaplastic and carcinoma lesions whereas no expression was seen in normal ducts (Fig. 7B). However, the expression of Pdx‐1 mRNA was more intense in metaplastic lesions than in cancer lesions (Fig. 7B). K‐ras mutation at codon 12 could not be detected in these microdissected lesions by PCR‐RFLP analysis (Fig. 7C) or by direct sequencing.
Figure 7.
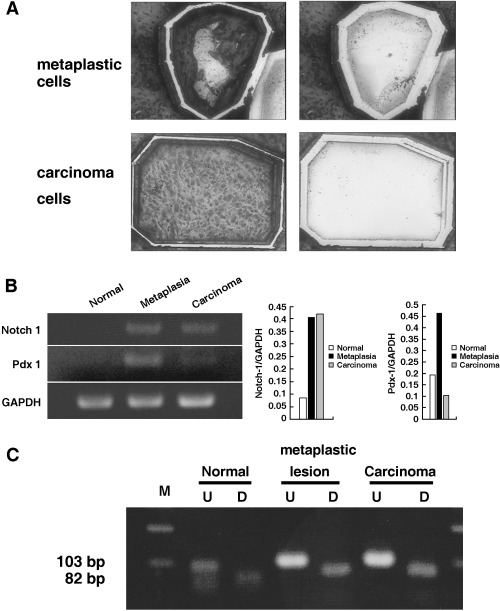
RNA expression of Notch‐1 and Pdx‐1, and K‐ras gene mutation in normal, metaplastic and carcinoma lesions in the dimethylbenzanthracene (DMBA)‐administered pancreas. (A) RNA was extracted from the microdissected lesions. Toluidine blue‐stained metaplastic (upper left) and carcinoma lesions (lower left) were cut by the laser and blown off by the large‐capacity laser, respectively (upper right and lower left right) and recovered in lysis buffer. (B) Extracted RNA from microdissected lesions was subjected to reverse transcription–polymerase chain reaction (PCR). Notch‐1 expression was detected consistently in precursor metaplastic lesions and carcinoma lesions but not in normal duct cells. In contrast, Pdx‐1 expression was more intense in precursor lesions than in carcinoma cells. Normal duct cells did not show mRNA expression of Pdx‐1. The PCR products were compared and normalized to glyceraldehyde‐3‐phosphate dehydrogenase. (C) Restriction fragment length polymorphism analysis of microdissected samples for codon 12 K‐ras mutation. Any mutation in codon 12 eliminates the restriction site so the mutated allele is resistant to digestion with _BstN_I. The PCR products from microdissected normal, metaplastic and carcinoma lesions were treated with _BstN_I. No resistance to digestion was seen in these lesions. D, digested samples; M, molecular marker; U, undigested samples.
Inhibition of the Notch signaling pathway. As the current data indicated that Notch‐1 signaling is activated in chemically induced pancreatic carcinogenesis, we evaluated whether suppression of Notch signaling would inhibit pancreatic cancer growth. At first, Notch‐1 expression was examined by western blotting in three pancreatic cancer cell lines. As shown in Fig. 8A, Notch‐1 expression was detected in these cancer cell lines. To assess the inhibition of the Notch signaling pathway, the γ‐secretase inhibitor DAPT was used. After 48 h, treatment with DAPT clearly showed a dose‐dependent reduction of Hes‐1 mRNA expression in the pancreatic cancer cell line BxPC3 (Fig. 8B), indicating that DAPT blocks the Notch signaling pathway. We then investigated the pancreatic cancer cell growth rate after inhibition of the Notch signaling pathway. Fig. 8C demonstrates that suppression of Notch signaling significantly reduced the pancreatic cancer cell growth rate. In addition, treatment with DAPT reduced the expression of cyclin D1 and nestin, both of which are overexpressed during chemically induced pancreatic carcinogenesis.
Figure 8.
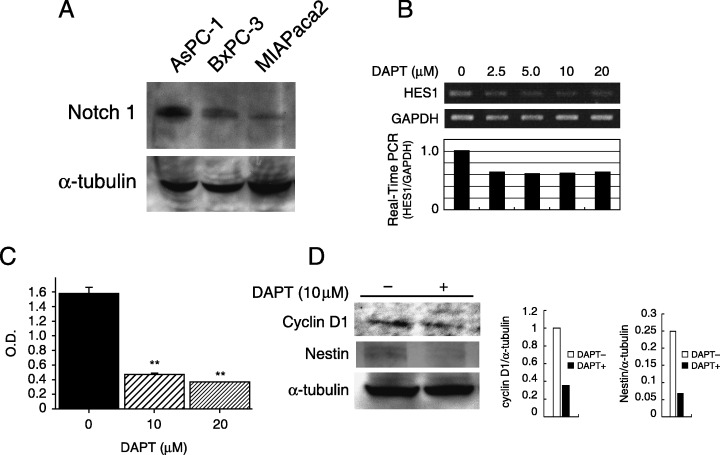
Inhibition of Notch signaling reduced pancreatic cancer growth. (A) Western blot analysis showed Notch‐1 protein expression in human pancreatic cancer cell lines (AsPC‐1, BxPC3 and MIAPaca2). α‐Tubulin was used as an internal control. (B) Treatment with _N_‐(_N_‐[3,5‐difluorophenacetyl]‐l‐alanyl)‐_S_‐phenylglycine _t_‐butyl ester (DAPT) reduced Hes‐1 mRNA expression in BxPC3 cells. The intensity of the band corresponding to Hes‐1 after treatment with DAPT was decreased in a dose‐dependent manner (upper panel). Real‐time reverse transcription–polymerase chain reaction also indicated the downregulation of Hes‐1 by DAPT (lower panel). (C) BxPC3 cells were treated with 10–20 ∝M DAPT for 72 h. MTT assay showed a 75–82% reduction in cell growth after DAPT treatment compared to control (**P < 0.01). (D) Western blot analysis showed downregulation of cyclin D1 and nestin expression in BxPC3 cells after incubation with DAPT for 48 h. The bands obtained were subjected to densitometry analysis and compared and normalized to α‐tubulin using Scion Image Software.
Discussion
A procedure for inducing carcinoma resembling human pancreatic cancer is well established in rats( 3 , 4 , 23 ) and hamsters.( 24 , 25 ) Pancreatic ductal adenocarcinoma develops within several months of implantation of the carcinogen DMBA into the pancreas of rats.( 3 , 4 , 23 ) However, an experimental pancreatic cancer model in mouse had not been established. Thus, we examined whether DMBA could produce ductal carcinoma in mouse pancreas. In the current study, we demonstrated clearly the frequent occurrence of pancreatic ductal adenocarcinoma in mice caused by administration of DMBA into the mouse pancreas. At 2 months after injection of DMBA, there was evidence of ductal adenocarcinoma in 60% of the mice pancreata. This is consistent with the results of rat experimental models that showed 40–70% at 1–10 months after implantation of DMBA.( 3 , 4 , 23 ) The profiles of genetic alterations in smad4, cyclin D1 and p53 in the carcinogen‐induced mice tumors were also similar to those of humans.( 22 ) In addition, we found tubular complexes, which are considered precursor lesions of pancreatic cancer,( 2 , 3 , 4 ) at 2 weeks and hyperplastic and dysplastic ductal metaplasia from 1 month after the injection of DMBA. This DMBA mouse model shows sarcomatoid undifferentiated carcinoma 3 months after the injection. Similarly, the occurrence of sarcomatoid carcinoma was demonstrated in _K‐ras_‐activated Ink4a null( 26 ) and Mist1‐driven K‐ras − p53+/– mice.( 27 ) In addition, this sarcomatoid carcinoma showed positive cytokeratin and negative vimentin or chymotrypsin immunoreactivity, indicating that this carcinoma originated from the ductal epithelium and not from stromal or acinar cells.
During normal mammalian development and homeostasis, Notch signaling plays an essential role in regulating cell fate, apoptosis, proliferation and migration.( 4 , 28 ) This is largely thought to occur through regulation of the expression of the Hes/Hey family of transcriptional repressors, although several other genes including p21 and cyclin D1 have been suggested to be direct targets.( 29 , 30 ) The pathway is activated through the interaction of Notch receptors with Delta‐like and Jagged ligands on neighboring cells.( 7 ) This leads to two proteolytic cleavages, which release the Notch intracellular domain, allowing it to enter the nucleus. Once within the nucleus, the Notch intracellular domain interacts with RBP‐Jκ/CBF1 and Mastermind to generate a large transcriptional activator complex.( 31 ) Recent studies have revealed that the Notch pathway is associated with several human cancers, such as cervical, lung, breast and pancreatic carcinoma and neuroblastoma.( 2 , 10 , 11 , 32 ) The activation of Notch signaling was also seen in metaplastic premalignant and malignant tumor lesions in the pancreas of TGFα transgenic mice, suggesting that Notch signaling is involved in not only the early but also the late stages of TGFα‐induced pancreatic carcinogenesis.( 2 ) Similarly, Notch‐1 and its target gene Hes‐1 were also overexpressed in lesions ranging from tubular complexes to carcinoma in the DMBA‐administered mouse pancreas. Therefore, this signal is activated commonly in the carcinogenesis of mouse pancreas induced by different mechanisms. Although we focused on Notch‐1 signaling in the present study because Notch‐1 is the most frequently detected receptor among the Notch family members screened for in human pancreatic cancer tissues (data not shown) and because recent studies clearly showed the requirement for Notch‐1 in pancreatic cancer development,( 33 , 34 ) this does not exclude the involvement of other Notch family members. Further studies about the cooperation of Notch ligands and receptors or their target genes in pancreatic carcinogenesis could provide future therapeutic targets in pancreatic cancer. Consistently, our data revealed that inhibition of Notch signaling significantly reduced the pancreatic cancer cell growth with downregulation of cyclin D1. In addition, activation of Notch signaling was seen frequently in human PanIN as well as invasive pancreatic cancer,( 2 , 12 ) suggesting that this signaling pathway could be a candidate therapeutic target for pancreatic carcinoma.
Tubular complexes are considered precursor lesions of pancreatic cancer as these lesions occur prior to tumor formation, ductular hyperplasia and carcinoma in situ that develop in the lesions.( 4 ) The tubular complexes were present at 2 weeks after the injection of DMBA in mouse pancreas in all cases examined. We detected Notch activation in these lesions but not or only very faintly in normal ducts. Thus, Notch signaling could be a marker to differentiate normal duct from very early premalignant ductal changes. However, we could not find the occurrence of carcinoma in all cases of DMBA‐injected pancreas, indicating that tubular complexes do not always convert to carcinoma cells. In the rat DMBA‐induced pancreatic cancer model, tubular complexes were formed by transdifferentiation of acinar cells and to a lesser extent islet cells and developed transiently in controls implanted with NaCl.( 3 ) The tubular complexes were also seen in the regeneration of caerulein‐treated pancreas in rat but they did not show continuous formation.( 35 ) Notch activation was demonstrated in the tubular complexes in this regenerated pancreas but its activation decreased within 1 week.( 35 ) In contrast, we demonstrated clearly by immunohistochemistry and RT‐PCR with microdissection that Notch activation continues from tubular complexes to carcinoma lesions. In this context, Notch signaling is required to form the tubular complexes and its continuous activation might lead to the transition from tubular complexes to premalignant lesions of the pancreas.
Semiquantitative RT‐PCR revealed that Pdx‐1 expression was more intense in precursor lesions than in carcinoma cells of the DMBA‐treated mouse pancreas. Pdx‐1 plays a crucial role in pancreatic development, as demonstrated by the fact that homozygous null animals lack pancreatic development.( 36 ) Pdx‐1 was shown to be upregulated in newly divided ductal cells as well as in islets in the process of pancreatic regeneration after 90% pancreatectomy, suggesting that Pdx‐1 is a gene associated with undifferentiated pancreatic progenitor cells.( 37 ) Therefore, the intense expression of Pdx‐1 in precursor lesions may reflect the dedifferentiated pancreatic ducts that resulted from the exposure to the chemical carcinogen DMBA. In addition, a recent study revealed that continuous expression of Pdx‐1 by transgenic approaches causes acinar‐to‐ductal metaplasia in mice pancreata, indicating the association of this gene with a very early stage of pancreatic tumorigenesis.( 38 ) Together with the current finding that there was decreased expression of Pdx‐1 in malignant lesions, it is suggested that Pdx‐1 is involved mainly in the dedifferentiated process of the pancreatic duct and the early stages of carcinogenesis but not or to only a very small extent in carcinoma development.
To clarify the molecular mechanism responsible for the poor prognosis of pancreatic cancer patients, we examined the expression of c‐_erb_B‐2,( 39 ) gelatinase A,( 40 ) CD44 variants,( 41 ) transforming growth factor β1 and its receptor,( 42 ) ROCK‐1( 43 ) and survivin,( 44 ) and demonstrated that their expressions were correlated with invasiveness or the frequency of metastasis in human pancreatic cancer. In addition to these aspects, we investigated the contribution of Notch signaling to the multipoint of carcinogenesis by analyzing the mouse pancreatic cancer model we generated in the current study. Although metaplastic epithelium producing mucin resembling human PanIN was seen after the formation of tubular complexes (Fig. 1C,D), this lesion cannot be designated as mPanIN as such a lesion must arise in the setting of a preexisting duct and not a metaplastic duct according to recent consensus criteria.( 21 ) However, ductal carcinoma arising from ductal metaplasia is also seen in several types of gene‐engineered pancreatic cancer models such as TGFα,( 2 ) Mist1‐driven K‐ras ( 27 ) or knockout PTEN mice,( 45 ) indicating pathways of carcinogenesis other than that through mPanIN formation. Activating K‐ras in the pancreas was shown to lead to the development of mPanIN lesions and infrequent progression to pancreatic carcinoma,( 26 , 46 ) suggesting that K‐ras activation is required to generate mPanIN and that another pathway in addition to this mutation is necessary for the progression to carcinoma. Thus, a DMBA model may be useful for understanding the mechanism underlying the transition from precursor lesions to carcinoma as such a model can show this progression without K‐ras activation. Notch signaling may be one of the candidates as its expression is continuous from tubular complex to carcinoma formation.
Acknowledgments
The authors wish to thank Professor Masaru Okabe at the Genome Information Research Center, Osaka University for kindly providing us with green mice. This work was supported in part by Grant‐in‐aid nos 14370172, 15590615 and 17380213 from the Ministry of Education, Science, Sports and Culture in Japan.
References
- 1.Hruban RH, Adsay NV, Albores‐Saavedra J_et al._Pancreatic intraepithelial neoplasia: a new nomenclature and classification system for pancreatic duct lesions. Am J Surg Pathol 2001; 25: 579 – 86. [DOI] [PubMed] [Google Scholar]
- 2.Miyamoto Y, Maitra A, Ghosh B_et al._Notch mediates TGFα‐induced changes in epithelial differentiation during pancreatic tumorigenesis. Cancer Cell 2003; 3: 565 – 76. [DOI] [PubMed] [Google Scholar]
- 3.Bockman DE, Guo J, Buchler P, Muller MW, Bergmann F, Friess H. Origin and development of the precursor lesions in experimental pancreatic cancer in rats. Lab Invest 2003; 83: 853 – 9. [DOI] [PubMed] [Google Scholar]
- 4.Jimenez RE, Z’graggen K, Hartwig W, Graeme‐Cook F, Warshaw AL, Fernandez‐del Castillo C. Immunohistochemical characterization of pancreatic tumors induced by dimethylbenzanthracene in rats. Am J Pathol 1999; 154: 1223 – 9. [DOI] [PMC free article] [PubMed] [Google Scholar]
- 5.Artavanis‐Tsakonas S, Rand MD, Lake RJ. Notch signaling: cell fate control and signal integration in development. Science 1999; 284: 770 – 6. [DOI] [PubMed] [Google Scholar]
- 6.Apelqvist A, Li H, Sommer L_et al._Notch signalling controls pancreatic cell differentiation. Nature 1999; 400: 877 – 81. [DOI] [PubMed] [Google Scholar]
- 7.Mumm JS, Kopan R. Notch signaling: from the outside in. Dev Biol 2000; 228: 151 – 65. [DOI] [PubMed] [Google Scholar]
- 8.Jensen J, Heller RS, Funder‐Nielsen T_et al._Independent development of pancreatic α‐ and β‐cells from neurogenin3‐expressing precursors: a role for the notch pathway in repression of premature differentiation. Diabetes 2000; 49: 163 – 76. [DOI] [PubMed] [Google Scholar]
- 9.Jensen J, Pedersen EE, Galante P_et al._Control of endodermal endocrine development by Hes‐1. Nature Genet 2000; 24: 36 – 44. [DOI] [PubMed] [Google Scholar]
- 10.Radtke F, Raj K. The role of Notch in tumorigenesis: oncogene or tumour suppressor? Nature Rev Cancer 2003; 3: 756 – 67. [DOI] [PubMed] [Google Scholar]
- 11.Nickoloff BJ, Osborne BA, Miele L. Notch signaling as a therapeutic target in cancer: a new approach to the development of cell fate modifying agents. Oncogene 2003; 22: 6598 – 608. [DOI] [PubMed] [Google Scholar]
- 12.Buchler P, Gazdhar A, Schubert M_et al._The Notch signaling pathway is related to neurovascular progression of pancreatic cancer. Ann Surg 2005; 242: 791 – 800. [DOI] [PMC free article] [PubMed] [Google Scholar]
- 13.Adler SH, Chiffoleau E, Xu L_et al._Notch signaling augments T cell responsiveness by enhancing CD25 expression. J Immunol 2003; 17: 2896 – 903. [DOI] [PubMed] [Google Scholar]
- 14.Jensen J, Serup P, Karlsen C, Nielsen TF, Madsen OD. mRNA profiling of rat islet tumors reveals Nkx 6.1 as a b‐cell‐specific homeodomain transcription factor. J Biol Chem 1996; 271: 18749 – 58. [DOI] [PubMed] [Google Scholar]
- 15.Zamurovic N, Cappelen D, Rohner D, Susa M. Coordinated activation of Notch, Wnt, and transforming growth factor‐β signaling pathways in morphogenic protein 2‐induced osteogenesis. J Biol Chem 2004; 279: 37704 – 15. [DOI] [PubMed] [Google Scholar]
- 16.Feder JN, Li L, Jan LY, Jan YN. Genomic cloning and chromosomal localization of HRY, the human homolog to the Drosophila segmentation gene, hairy. Genomics 1994; 20: 56 – 61. [DOI] [PubMed] [Google Scholar]
- 17.Tso JY, Sun XH, Kao TH, Reece KS, Wu R. Isolation and characterization of rat and human glyceraldehyde‐3‐phosphate dehydrogenase cDNAs: genomic complexity and molecular evolution of the gene. Nucl Acids Res 1985; 13: 2485 – 502. [DOI] [PMC free article] [PubMed] [Google Scholar]
- 18.Cazorla M, Hernandez L, Fernandez PL_et al._Ki‐ras gene mutations and absence of p53 gene mutations in spontaneous and urethane‐induced early lung lesions in CBA/J mice. Mol Carcinogenesis 1998; 21: 251 – 60. [DOI] [PubMed] [Google Scholar]
- 19.Satoh K, Shimosegawa T, Moriizumi S, Koizumi M, Toyota T. K‐ras mutation and p53 protein accumulation in intraductal mucin‐hypersecreting neoplasms of the pancreas. Pancreas 1996; 12: 362 – 8. [DOI] [PubMed] [Google Scholar]
- 20.Dovey HF, John V, Anderson JP_et al._Functional γ‐secretase inhibitors reduce β‐amyloid peptide levels in brain. J Neurochem 2001; 76: 173 – 81. [DOI] [PubMed] [Google Scholar]
- 21.Hruban RH, Adsay NV, Albores‐Saavedra J_et al._Pathology of genetically engineered mouse models of pancreatic exocrine cancer: consensus report and recommendations. Cancer Res 2006; 66: 95 – 106. [DOI] [PubMed] [Google Scholar]
- 22.Maitra A, Adsay NV, Argani P_et al._Multicomponent analysis of the pancreatic adenocarcinoma progression model using a pancreatic intraepithelial neoplasia tissue microarray. Mod Pathol 2003; 16: 902 – 12. [DOI] [PubMed] [Google Scholar]
- 23.Rivera JA, Graeme‐Cook F, Werner J_et al._A rat model of pancreatic ductal adenocarcinoma: targeting chemical carcinogens. Surgery 1997; 122: 82 – 90. [DOI] [PubMed] [Google Scholar]
- 24.Pour P, Althoff J, Kruger FW, Mohr U. A potent pancreatic carcinogen in Syrian hamsters: _N_‐nitrosobis (2‐oxopropyl) amine. J Natl Cancer Inst 1977; 58: 1449 – 53. [DOI] [PubMed] [Google Scholar]
- 25.Mizumoto K, Tsutsumi M, Denda A, Konishi Y. Rapid production of pancreatic carcinoma by initiation with _N_‐nitroso‐bis (2‐oxopropyl) amine and repeated augmentation pressure in hamsters. J Natl Cancer Inst 1988; 80: 1564 – 7. [DOI] [PubMed] [Google Scholar]
- 26.Aguirre AJ, Bardeesy N, Sinha M_et al._Activated Kras and Ink4a/Arf deficiency cooperate to produce metastatic pancreatic ductal adenocarcinoma. Genes Dev 2003; 17: 3112 – 26. [DOI] [PMC free article] [PubMed] [Google Scholar]
- 27.Tuveson DA, Zhu L, Gopinathan AR_et al._Mist1–KrasG12D knock‐in mice develop mixed differentiation metastatic exocrine pancreatic carcinoma and hepatocellular carcinoma. Cancer Res 2006; 66: 242 – 7. [DOI] [PubMed] [Google Scholar]
- 28.Gridley T. Notch signaling and inherited disease syndromes. Hum Mol Genet 2003; 12: 9 – 13. [DOI] [PubMed] [Google Scholar]
- 29.Rangarajan A, Talora C, Okuyama R_et al._Notch signaling is a direct determinant of keratinocyte growth arrest and entry into differentiation. EMBO J 2001; 20: 3427 – 36. [DOI] [PMC free article] [PubMed] [Google Scholar]
- 30.Ronchini C, Capobianco AJ. Induction of cyclin D1 transcription and CDK2 activity by Notch (ic): implication for cell cycle disruption in transformation by Notch (ic). Mol Cell Biol 2001; 21: 5925 – 34. [DOI] [PMC free article] [PubMed] [Google Scholar]
- 31.Jeffries S, Robbins DJ, Capobianco AJ. Characterization of a high‐molecular‐weight Notch complex in the nucleus of Notch (ic)‐transformed RKE cells and in a human T‐cell leukemia cell line. Mol Cell Biol 2001; 22: 3927 – 41. [DOI] [PMC free article] [PubMed] [Google Scholar]
- 32.Stylianou S, Clarke RB, Brennan K. Aberrant activation of notch signaling in human breast cancer. Cancer Res 2006; 66: 1517 – 25. [DOI] [PubMed] [Google Scholar]
- 33.Wang Z, Banerjee S, Li Y, Rahman KM, Zhang Y, Sarkar FH. Down‐regulation of notch‐1 inhibits invasion by inactivation of nuclear factor‐κB, vascular endothelial growth factor, and matrix metalloproteinase‐9 in pancreatic cancer cells. Cancer Res 2006; 66: 2778 – 84. [DOI] [PubMed] [Google Scholar]
- 34.Wang Z, Zhang Y, Li Y, Banerjee S, Liao J, Sarkar FH. Down‐regulation of Notch‐1 contributes to cell growth inhibition and apoptosis in pancreatic cancer cells. Mol Cancer Therapeutics 2006; 5: 483 – 93. [DOI] [PubMed] [Google Scholar]
- 35.Jensen JN, Cameron E, Garay MV, Starkey TW, Gianani R, Jensen J. Recapitulation of elements of embryonic development in adult mouse pancreatic regeneration. Gastroenterology 2005; 128: 728 – 41. [DOI] [PubMed] [Google Scholar]
- 36.Ahlgren U, Jonsson J, Edlund H. The morphogenesis of the pancreatic mesenchyme is uncoupled from that of the pancreatic epithelium in IPF1/PDX1‐deficient mice. Development 1996; 122: 1409 – 16. [DOI] [PubMed] [Google Scholar]
- 37.Sharma A, Zangen DH, Reitz P_et al._The homeodomain protein IDX‐1 increases after an early burst of proliferation during pancreatic regeneration. Diabetes 1999; 48: 507 – 13. [DOI] [PubMed] [Google Scholar]
- 38.Miyatsuka T, Kaneto H, Shiraiwa T_et al._Persistent expression of PDX‐1 in the pancreas caused acinar‐to‐ductal metaplasia through Stat3 activation. Genes Dev 2006; 20: 1435 – 40. [DOI] [PMC free article] [PubMed] [Google Scholar]
- 39.Satoh K, Sasano H, Shimosegawa T_et al._An immunohistochemical study of the c‐erbB‐2 oncogene product in intraductal mucin‐hypersecreting neoplasms and in ductal cell carcinomas of the pancreas. Cancer 1993; 72: 51 – 6. [DOI] [PubMed] [Google Scholar]
- 40.Satoh K, Ohtani H, Shimosegawa T, Koizumi M, Sawai T, Toyota T. Infrequent stromal expression of gelatinase A and intact basement membrane in intraductal neoplasms of the pancreas. Gastroenterology 1994; 107: 1488 – 95. [DOI] [PubMed] [Google Scholar]
- 41.Satoh K, Shimosegawa T, Koizumi M, Toyota T. Expression of CD44 in duct cell carcinomas and in intraductal neoplasms of the pancreas. Anticancer Res 1997; 17: 215 – 19. [PubMed] [Google Scholar]
- 42.Satoh K, Shimosegawa T, Hirota M, Koizumi M, Toyota T. Expression of transforming growth factor β1 (TGFβ1) and its receptors in pancreatic duct cell carcinoma and in chronic pancreatitis. Pancreas 1998; 16: 468 – 74. [DOI] [PubMed] [Google Scholar]
- 43.Kaneko K, Satoh K, Masamune A, Satoh A, Shimosegawa T. Expression of ROCK‐1 in human pancreatic cancer: its down‐regulation by morpholino oligo antisense can reduce the migration of pancreatic cancer cells in vitro. Pancreas 2002; 24: 251 – 7. [DOI] [PubMed] [Google Scholar]
- 44.Satoh K, Kaneko K, Hirota M, Masamune A, Satoh A, Shimosegawa T. Expression of survivin is correlated with cancer cell apoptosis and is involved in the development of human pancreatic duct cell tumors. Cancer 2001; 92: 271 – 8. [DOI] [PubMed] [Google Scholar]
- 45.Stanger BZ, Stiles B, Lauwers GY_et al._Pten constrains centroacinar cell expansion and malignant transformation in the pancreas. Cancer Cell 2005; 8: 185 – 95. [DOI] [PubMed] [Google Scholar]
- 46.Hingorani SR, Petricoin EF, Maitra A_et al._Preinvasive and invasive ductal pancreatic cancer and its early detection in the mouse. Cancer Cell 2003; 4: 437 – 50. [DOI] [PubMed] [Google Scholar]