A Practical Guide to Single Molecule FRET (original) (raw)
. Author manuscript; available in PMC: 2013 Sep 10.
Published in final edited form as: Nat Methods. 2008 Jun;5(6):507–516. doi: 10.1038/nmeth.1208
Abstract
Despite the explosive growth in the biological applications of single molecule methods over the last decade, these techniques have thus far been practiced mostly by researchers who are biophysically oriented. This is partly because of the lack of commercial instruments in many cases and also because of the perceived steep learning curve and need for expensive equipments. We wish to provide a practical guide to using Förster (or Fluorescence) Resonance Energy Transfer (FRET) at the single molecule level, focusing on the study of immobilized molecules that allow measurements of single molecule reaction trajectories from about 1 millisecond to many minutes. An instrument can be built at a reasonable cost using various off-the-shelf components and operated reliably using current well-established protocols and freely available software.
The future holds the promise of personalized DNA sequencing and high throughput screening for pathogens at affordable cost and viable time. These promises are riding high on a surge of single-molecule based technologies that enable us to manipulate and probe individual molecules. Using this approach, several important biological riddles that have intrigued scientists for a long time are coming under the microscope. As Feynman famously said “It is very easy to answer many of these fundamental biological questions; you just look at the thing!”1. Single-molecule methods are allowing us to do just that2, 3. They may one day become an elementary tool for characterizing proteins, signaling pathways or any biological phenomenon. In the hopes of facilitating this objective, we provide a brief, but practical guide for single-molecule FRET4 measurements (smFRET)5-7, one of the most general and adaptable single-molecule techniques. Since its humble beginning under non-aqueous conditions in 19968, smFRET has rapidly developed to answer fundamental questions about replication, recombination, transcription, translation, RNA folding and catalysis, non-canonical DNA dynamics, protein folding and conformational changes, various motor proteins, membrane fusion proteins, ion channels, signal transduction, to name just a few, and the list keeps growing at a fast pace. Since it is not the purpose of this review to survey the vast literature on such studies, we refer the reader to reviews in the field and the references therein6, 9-13.
In FRET measurements, the extent of non-radiative energy transfer between two fluorescent dye molecules, termed donor and acceptor, reports the intervening distance which can be estimated from the ratio of acceptor to total emission intensity (Fig. 1)4, 14, 15. This efficiency of energy transfer, E is given as E = [1 + (R/_R_0)6]−1, where R is the inter-dye distance and _R_0 is the Förster radius at which E = 0.5 (Fig. 1a). Conformational dynamics of single molecules can be observed in real-time by tracking FRET changes (Fig. 1b). The advantage of the FRET technique lies in being a ratiometric method enabling us to measure the internal distance in the molecular frame rather than in the laboratory frame and hence making it largely immune to instrumental noise and drift. FRET measurement of freely diffusing single molecules is simpler to implement (commercial solutions are also available e.g. MicroTime200 from PicoQuant) and powerful in revealing population distributions of inter-dye distances16-19. However, the ability to monitor individual molecules for long stretches of time adds a whole new dimension with dynamic information ranging from milliseconds to minutes. Though confocal microscopy can be employed20, 21, smFRET time trajectories are most commonly acquired by imaging surface immobilized molecules with the aid of total internal reflection (TIR) microscopy that allows high throughput data sampling5, 22. TIR setups have been successfully adapted by numerous groups and can be assembled easily following a step-by-step guideline7 by using off-the-shelf components that cost about as much as an ultracentrifuge. Here, we review this FRET method and also provide a list of vendors for various reagents and equipment used in our laboratory (Supplementary Tables 1 and 2 online; Listed items and vendors are not sole options and one may find other alternatives). All data acquisition and analysis programs are freely available online (http://bio.physics.uiuc.edu) and instructions on preparation of polymer-passivated surface and a web link to demonstration movies are included in Supplementary Protocol online. Though we mainly discuss the two color FRET scheme in this review, higher order FRET schemes can also be applied to probe multi-component interactions or spatiotemporal relationships between different conformational changes in large molecular complexes (Box 1).
Figure 1.

Single molecule FRET. (a) FRET Efficiency, E as a function of inter-dye distance (R) for a _R_0 = 50 Å. Donor dye directly excited with incident laser either fluoresces or transfers energy to acceptor dye depending upon its proximity. At R = _R_0, E = 0.5 while at smaller distances, it is > 0.5 and vice versa according to the function shown by the blue line. Notice the linearity of the E values adjacent to _R_0. (b) Example of a two color smFRET data. Data is acquired in the form of intensities of donor and acceptor (top panel) from which apparent FRET efficiency (bottom panel) is calculated. A mutant hairpin ribozyme93 which carries the donor and acceptor on different arms of the same molecule undergoes transitions between three FRET states (E1, E2 and E3). The anti-correlated nature of the donor and acceptor signal indicates that these intensity changes are due to energy transfer. Dye molecules also show transitions to dark states e.g. acceptor intensity transiently drops to zero (∼9 s) or completely photobleaches (∼18.5 s).
Box 1.
FRET schemes
Single pair FRET (Box Fig. 1a) is a powerful technique, however it is important to realize that global conformational changes during biomolecular interactions, whether protein folding or protein-nucleic acid interactions are seldom one dimensional. In the absence of crystal structures, interpretation of inter-dye distance changes can be reconciled with several different yet not necessarily mutually exclusive models. There is hence, an ever increasing interest in extending the reach of FRET to three dimensions. Here we discuss some of the FRET schemes in elementary or developmental stages.
Three color cascade scheme: Limited distance range of FRET has prompted researchers to use cascades of energy transfer cassettes to extend the effective R0 values. For example, in a three color cascade, an intermediate energy acceptor relays the energy gained from the donor to a lower energy acceptor (Box Fig. 1b). This scheme can be beneficial in probing changes in large complexes like ribosomes or nucleosomes.
Three color bifurcate scheme: One dye can act as the donor for two independent acceptors that can be spectrally separated (Box Fig. 1c). Depending on its proximity from either of the acceptors, the donor quenches with increase in corresponding acceptor emission. A reverse approach would be with two independent donors (spectrally separable yet excitable by the same wavelength of light) that can selectively quench depending on which one is in vicinity of a single acceptor.
General three color scheme: A general case of the above two would be when energy transfer between the three dyes is not restricted and hence detailed calculations must be carried out to estimate the three inter-dye distances (Box Fig. 1d). This allows one to explicitly define an unambiguous reference plane in the 3D conformational space of the biomolecule.
Two FRET pair scheme: For large complexes, employment of two independent FRET pairs can report on conformational changes in separate regions of the macromolecule in real time (Box Fig. 1e). Realization of such schemes will depend on the development of bluer dyes that can act as efficient single molecule donors.
Box Figure 1.

Single molecule FRET schemes.
Experimental design
Single molecule fluorescence dyes
An ideal fluorophore for single molecule studies must be bright (extinction coefficient, ε > 50,000 M−1cm−1; quantum yield, QY > 0.1), photostable with minimal photophysical/chemical and aggregation effects, small and water soluble with sufficient forms of bio-conjugation chemistries. In addition, an excellent smFRET pair should have (1) large spectral separation between donor and acceptor emissions and (2) similar quantum yields and detection efficiencies. While fluorescent proteins have been used for smFRET studies23, low photostability and photo-induced blinking have hindered further applications. Semiconductor quantum dots (QDs) have also been employed as a smFRET donor24 by suppressing their blinking chemically25, but the large size (> 20 nm diameter for commercial QDs) and lack of a monovalent conjugation scheme limit their use. Consequently, the most popular single-molecule fluorophores are small (< 1 nm) organic dyes26. We have compared three FRET pairs with absorbance from 500-700 nm from different vendors (Cyanine, Alexa- and Atto-dyes) in Table 1. While cyanine dyes (Cy3 and Cy5; donor and acceptor respectively) have long been the favorites, their counterparts seem to be comparable in their relevant properties. None of the bluer dyes, for example those that can be excited at 488 nm, were as photostable. A Cy3 replacement for custom RNA synthesis, Dy547, is even more photostable than Cy3 (Sua Myong, personal communication). Tetramethylrhodamine is a viable alternative and has an almost identical spectrum to Cy3 but with a lower extinction coefficient. However, it has the tendency to change its intensity between three different levels spontaneously (unpublished observations). Near infrared dyes like Cy5.5 and Cy7 also serve as efficient single molecule dyes and can be used in multi-color schemes (discussed later).
Table 1. Comparison of single molecule FRET dyes.
| Dye | Excitation _λ_max (nm) | Emission _λ_max (nm) | Brightnessa | Photostability (s) b (in Trolox/_β_ME) |
|---|---|---|---|---|
| Donors | ||||
| Cy3 | 550 | 565 | 1.0 | 91/50 |
| ATTO550 | 554 | 577 | 1.9 | 72/27c |
| Alexa555 | 555 | 567 | 0.8 | 65/35 |
| Acceptors | ||||
| Cy5 | 655 | 667 | 1.0 | 82/25 |
| ATTO647N | 644 | 664 | 1.3 | 62/31 |
| Alexa647 | 650 | 667 | 1.2 | 58/20c |
Enhancing photostability
Molecular oxygen is an efficient quencher of a dye's triplet state, but is also a source of a highly reactive oxygen species that ultimately causes photobleaching27. While oxygen removal reduces photobleaching, it prolongs the residence time in the triplet dark state28 causing millisecond or longer fluorescence intermittency or an early onset of signal saturation. A vitamin E analog named Trolox (2 mM; 100× stock prepared in dimethyl sulfoxide (DMSO), pH adjustment and filtration required) is an excellent triplet state quencher which suppresses blinking and stimulates long lasting emission of the popular cyanine dyes in combination with an enzymatic oxygen scavenging system28. Trolox should also provide a major improvement in time resolution as it delays the onset of emission saturation with increasing laser intensity. The reductant β-mercaptoethanol (βME;142 mM) is a less efficient triplet state quencher and it induces long-lived dark states of Cy528, a side effect which has been exploited for super-resolution photoswitching imaging applications29. A plethora of other triplet state quenchers or anti-fade agents exist that may prove beneficial for non cyanine dyes30.
The most popular enzymatic oxygen scavenging system31 is a mix of glucose oxidase (165 U/ml), catalase (2170 U/ml), and β-D-glucose (0.4% w/w) (or 0.8% w/w dextrose monohydrate). Glucose oxidase must be added just prior to imaging and the sample kept isolated from air such that the solution pH does not drop significantly due to gluconic acid production, a byproduct of the reaction. Other options could be the protocatechuic acid/protocatechuate-3,4-dioxygenase combination32 which provides ∼40% improvement over the previous method (Nils Walter, personal communication). If highly purified forms of these enzymes are not commercially available, care must be taken to ensure the absence of contaminating activity, especially that of ribonucleases.
Conjugation
If structural information is available, the labeling sites should be chosen so that, the inter-dye distance changes from less to greater than the _R_0 value (or vice versa) for maximal sensitivity. Some guidelines exist for the FRET values33 expected for labeled nucleic acids34, 35. Common conjugation strategies for nucleic acids and proteins are summarized in Table 2. Nucleic acids are best labeled during synthesis or with amine modified bases that can be separated from unlabeled molecules by poly-acrylamide gel electrophoresis. For nucleic acid-protein interactions, it is advantageous to label nucleic acids because of the ease of conjugation, handling, purification, and flexibility in dye placement. In studies involving protein interactions with the DNA backbone, dyes should be conjugated internally using linker groups to prevent backbone disruption. It is economical to distribute the modifications to two or more strands of DNA (or RNA) and anneal them to generate the final construct. As a general approach to label proteins site-specifically, we have tried to label an unnatural amino-acid containing a ketone group36 genetically encoded in a E. coli Rep helicase using Cy3 or Cy5-hydrizide.
Table 2. Conjugation strategies for dyes or biotin.
| Chemistry/Method | Reactive Group | Remark |
|---|---|---|
| DNA/RNA | ||
| Phosphoramidite or acetoxyethoxy methyl (ACE) solid support synthesis | Direct incorporation into the backbone | |
| Amine reactive (-NH2) | succinimidyl (NHS) ester | Amino C6- dT/dC (for internal labeling without backbone disruption) |
| Thiol reactive (-SH) | Maleimide | Thiol modifier on 3′or 5′ end |
| Proteins | ||
| Amine reactive (-NH2) | succinimidyl (NHS) ester | N-terminal or Lysine amine groupa |
| Thiol reactive (-SH) | Maleimide | Cysteine thiol groupb |
| Ketone reactive (=CO) | Hydrazine | Unnatural amino acid with ketone groupc |
Even with acceptable protein yields, the fluorescence labeling yield was poor. The extremely low yield of ketone group labeling on proteins larger than 100 residues even under denaturing conditions seems general (Richard Ebright, personal communication). The low occurrence of cysteine (cys) residues in most proteins compared to lysines makes them ideal for specific labeling. Therefore, labeling of cysteine residues (introduced via site-directed mutagenesis37, 38) with maleimide based reactions remains the most popular labeling scheme, though there are recently developed but less general alternatives26, 39. While labeling choices have the largest impact on the success or failure of smFRET experiments, the choice of equipment used to detect smFRET is also important.
Single molecule detection
Total Internal Reflection Spectroscopy
In TIR microscopy40, 41, one creates an evanescent field of excitation light that extends only ∼ 100-200 nm from the surface the sample is bound to, which greatly reduces background fluorescence (Fig. 2a,b). A solid-state laser at 532 nm (∼50 mW) is suitable for the FRET pairs discussed here and a HeNe laser at 633 nm (∼30 mW) or diode lasers of similar wavelengths can be added for checking the presence of the acceptor. The laser intensity is attenuated using a half-waveplate and a polarizing beam splitting cube (or with neutral density filters). By exciting a large area (∼0.05 mm2 in size) and using camera based detection, hundreds of molecules are imaged in parallel. A laser table with air-floated legs is typically used, but a ∼25 mm thick breadboard with uniformly spaced threaded holes mounted on a regular laboratory bench or desk is stable enough for TIR smFRET. There are two types of TIR, prism type (PTIR) and objective type (OTIR) (Fig. 2a,b).
Figure 2.

Schematic for smFRET spectroscopy. Labels - M, mirror; DM, dichroic mirror; L, lens; CCD, charge coupled device camera; BE, beam expander; PBS, polarizing beam splitter; λ/2, half waveplate (a) TIR excitation and single FRET pair emission detection. Tethered single molecules are either excited by PTIR or OTIR. Fluorescence is collected using the objective and the slit generates a final imaging area that is half of the CCD imaging area. The collimated image is split into the donor and acceptor emissions and imaged side by side on the CCD camera (see camera image in inset). (b) TIR excitation schemes (enlarged view of the box in (a)). In PTIR, laser beam focused at a large incident angle (_θ_c > 68°) on the prism placed on the top of the sample creates an evanescent field (EF) at the quartz/water interface on the slide. Alternately in OTIR excitation, the focused laser beam strikes at the periphery of the objective back focal plane causing TIR at the glass/water interface on the coverslip close to the objective. (c) Emission detection for three color scheme. Image is framed using a slit such that final image size covers one-third of the CCD chip. A set of dichroics allow separation of the individual emissions from the three fluorophores and imaging them simultaneously.
In PTIR, an inverted microscope is adapted to hold a fused silica prism on top of the sample channel and the fluorescence is collected from the objective below40, 41 (Fig. 2a). After the incident laser beam is focused using a long focal length lens, it enters the prism, passes through refractive index matching oil and is internally reflected at the quartz-water interface (Fig. 2a,b and Supplementary Methods online). The fluorescence signal is collected using a long working distance water immersion objective (60×, 1.2 numerical aperture (NA)). A PTIR is necessary for fluid injection experiments because its imaging surface, made of a 1 mm thick slide, does not bow upon pressure change during flow. Expensive (but recyclable) quartz slides are needed to minimize fluorescence background, and the prism needs to be reassembled every time a new sample is loaded. The need to readjust the illumination path is minimized if the prism is reproducibly placed on the same location relative to the microscope body.
OTIR relies on using a high NA oil objective to create an evanescent field. Focusing the beam at the back focal plane generates a parallel beam exiting the objective and then translating it to the periphery of the objective produces TIR at the glass/water interface40, 41 (Fig. 2a,b). Fluorescence from the molecules tethered to the coverslip surface is collected using the same objective. OTIR has higher photon collection efficiency, frees up the space above the sample for additional sample control, and has commercial options. Aided largely by the use of a low fluorescence objective, UPlanSApo (100×, 1.4 NA, Olympus), we can acquire smFRET data of Cy3/Cy5 pair with signal-to-noise ratio and imaging area comparable to that of prism-type (unpublished results).
Emission Detection
TIR Microscopy has gained popularity partly spurred by the new wave of highly sensitive and fast frame transfer electron-multiplying charged couple device (EM-CCD) cameras3, 42. smFRET setups usually employ EM-CCDs that have high quantum efficiency (85-95%) in the 450 – 700 nm range, low effective read out noise (< 1 electron rms) even at the fastest readout speed (≥ 10 MHz), fast vertical shift speeds (≤ 1 μsec/row; to achieve faster frame rates) and a low multiplication noise. Using a 512 × 512 pixel EM-CCD, we can acquire data at 33 Hz (at full frame) to 125 Hz (with 2×2 binning).
The scattered light of the excitation laser is rejected from the fluorescence collected with the objective using a long pass filter. A vertical slit is introduced at the imaging plane just outside the microscope side port to limit the image area such that the final image incident on the CCD is half the size of the CCD chip (Fig. 2a). Donor and acceptor fluorescence emission is then split using a dichroic mirror. By adjusting an offset with the dichroic and an additional mirror, both donor and acceptor emission can be imaged side by side on the CCD camera (Fig. 2a inset). This optical layout maps the imaging area of ∼75 μm × 37 μm on the CCD chip. A straightforward extension using a narrower slit corresponding to a third of the CCD area enables three-color FRET detection (Fig. 2c). Without additional bandpass filters, there is a sizeable crosstalk between the detection channels (for example, 40% of Cy5 emission leaks into the Cy5.5 channel if Cy5.5 is used as a second acceptor), but careful calibration and correction can recover the original intensities43. Our recent test indicates that Cy7 is a promising fluorophore which can replace Cy5.5 in the original single-molecule three-color FRET scheme; photostability and brightness of Cy7 were comparable to those of Cy5.5 while Cy7's emission can be better discriminated against Cy5 emission. A relatively low detection efficiency of EMCCD camera at the Cy7 emission wavelength is currently an issue, but this should not be a problem for confocal measurements because the silicon avalanche photodiode maintains high quantum yield of detection at these wavelengths. Reduced transmission in this spectral region can be alleviated to some degree with infrared optimized objectives and optics.
Sample Preparation to Data acquisition
Surface immobilization
While quartz slides are absolutely necessary for PTIR, a thin coverslip forms the imaging surface of OTIR and regular glass coverslips are usually adequate for single-molecule fluorescence imaging in OTIR. For stable and specific, yet non-perturbing immobilization of the sample to the slide or coverslip, a biotin-strepavidin linkage is commonly used5, 22, 44. An effective method for studies involving only nucleic acids employs biotinylated bovine serum albumin (biotinBSA) which adsorbs to glass/quartz surfaces and binds the biotinylated molecules through the multivalent streptavidin protein (neutravidin is a less expensive alternative) (Fig. 3a). For protein studies, non-specific binding to the surface must be suppressed via an additional passivating agent, the most popular being polyethylene glycol (PEG)45. A precleaned surface-activated slide is aminosilanized and reacted with the N-hydroxysuccinimide (NHS) ester modified PEG which also includes a small fraction of biotin-PEG-NHS ester for specific tethering (Fig. 3b)44 (Supplementary Protocol online). Adhesion of nucleic acids to the PEG surface at pH < 7.0 can be reduced by further passivating the surface with sulfodisuccinimidyltartrate46. Strong interaction between denatured protein and linear PEG can be eliminated using branched PEG instead and they may serve as better passivating agents47, 48. Histidine-tagged proteins can also be attached to the surface using chelated Ni2+ or Cu2+ groups49 however, optimal orientational positioning and elimination of surface artifacts might sometimes require a spacer between the histidine-tag sequence and the protein (Fig. 3c). Several of these PEGylated options are commercially available also (http://www.proteinslides.com/index.html). More stringent rejection of nonspecific binding can be achieved by repeating the PEGylation reaction two or three times (Yuji Ishitsuka, personal communication).
Figure 3.

Surface immobilization strategies for smFRET experiments. (a) Biotin-BSA proteins bound non-specifically to the surface tether biotinylated molecules with the aid of multivalent avidin proteins (e.g. neutravidin). (b) Mixture of biotin-PEG and PEG is covalently attached to amino silanized slide surface. Biotins on the PEG can bind DNA (or protein) engineered with a biotin moiety with the help of a sandwiched neutravidin protein. PEG coating prevents the non-specific binding. (c) PEG coated surfaces can be engineered to carry Ni2+ or Cu2+ chelated on iminodiacetic acid (IDA) (or nitrilotriacetic acid (NTA)) groups that bind efficiently to 6× His-tagged proteins while retaining functional activity. (d) Using dimyristoyl phospatidylcholine (DMPC) at room temperature, vesicles selectively permeable to small molecules can be used to trap biomolecules. A fraction of biotinylated lipid allows specific tethering of the vesicles to the biotin-PEG surface. D and A labels stand for donor and acceptor dyes.
Encapsulation of single molecules inside surface-tethered phospholipid vesicles50-52 mimic cellular entrapment, reduces perturbation to the system, and does not require tether attachment to the molecule. With the adoption of semi-permeable vesicles53, this approach enables the study of repeated collisions between the same set of weakly interacting molecules under different solution conditions without suffering from high background (Fig. 3d).
The sample chamber
An air-tight sample chamber is created by sandwiching double sided tape or parafilm between a pre-cleaned slide and a coverslip (see Supplementary Protocol online) and by applying epoxy as necessary. Simple pipetting or pumping through two holes pre-drilled in the slide allows exchange of solution without drying (Fig. 4). The assembled chamber is checked for non-specific binding before application of streptavidin by imaging the surface in the presence of 1 nM labeled DNA and/or protein. If the non-specifically bound fluorescent spot density is < 10% of specifically tethered molecules (typically, specific attachment with ‘good’ density provides ∼ 0.1-0.2 spots/μm2), the slide preparation is deemed acceptable. After streptavidin, biotinlyated biomolecules are added in low concentrations (20-100 pM in buffer containing 0.1 mg/ml BSA to reduce loss of molecules to other surfaces) to achieve immobilization at the desired single molecule density. Higher density increases the chance of overlapping neighboring molecules. Movies of such tethered molecules are acquired and saved on the hard disk directly using a custom program written in Visual C++.
Figure 4.
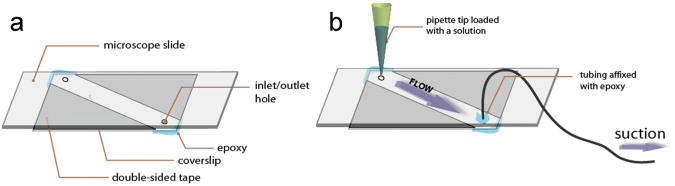
Sample Chamber. (a) A sample chamber is made by sandwiching a microscope slide and a coverslip with double-sided tape and by sealing with epoxy. The holes on the slide are used for the inlet and outlet of solution exchange. (b) A syringe is connected to the chamber through tubing and a pipette tip that contains a solution is snugly plugged into an inlet hole. When the syringe is pulled, the solution is introduced into a chamber. Reproduced from ref. 7 with permission from Cold Spring Harbor Laboratory Press.
Calibration
Crosstalk between the detection channels needs to be corrected before estimating the true FRET efficiency. With donor-only and acceptor-only molecules excited at donor excitation wavelengths, we determine the leakage of donor emission into the acceptor channel(s) and direct excitation of acceptor(s) respectively. With acceptor only molecules excited directly (close to its absorption maximum), we determine the leakage of acceptor emission into the donor detection channel.
Mapping between donor and acceptor images is made with an image of surface-tethered fluorescent microspheres with substantial emission in all detection channels. We manually select 3-4 fluorescence peaks in the donor image and their corresponding peaks in the acceptor image and an automated algorithm generates a linear transformation between the two images that corrects for offset, rotation, rescaling and distortion.
Data processing and analysis
Data processing algorithms
To convert the movie files into single-molecule time trajectories, we first identify isolated single molecule peaks from a composite image of donor and acceptor channels (average of first ten frames) built using the mapping generated (vide supra). Donor and acceptor spots that co-localize are selected for final analysis to eliminate partially labeled molecules. Next, the local background is subtracted from the peaks and intensities from 7 × 7 pixels (depending on overall magnification) surrounding the peak (corresponding to ∼ 1 μm2 area) are integrated to recover donor and acceptor intensities for each single molecule for every frame. In experiments where only transient presence of the donor labeled molecule is anticipated54, the first step can be carried out for each set of ten successive frames.
FRET efficiency
After correcting for the cross talk and background (determined from intensity traces after dye photobleaching) in both channels, apparent FRET efficiency is calculated as _E_app = _I_A/(_I_A + _I_D) where _I_A and _I_D represent acceptor and donor intensities, respectively. Eapp provides only an approximate indicator of the inter-dye distance because of uncertainty in the orientation factor _κ_2 between the two fluorophores and the required instrumental corrections. As a rule of thumb, if fluorescence anisotropy r of both fluorophores is less than 0.2, _κ_2 is close to 2/334, 55. We found that in general r > 0.2 for popular smFRET fluorophores conjugated to nucleic acids or proteins so care must be taken in extracting the absolute distance information. Nevertheless, in every case we tested, apparent FRET was a monotonic function of distance. In order to determine actual FRET efficiency, one has to determine the correction factor, γ, which accounts for the differences in quantum yield and detection efficiency between the donor and the acceptor. γ is calculated as the ratio of change in the acceptor intensity, _ΔI_A to change in the donor intensity, _ΔI_D upon acceptor photobleaching (γ = _ΔI_A_IΔI_D)21, 56. Corrected FRET efficiency is then calculated using the expression,
Proteins can change the photophysical properties of a fluorophore. For example, we and others have observed that the fluorescence of DNA-conjugated Cy3 increases when a protein binds nearby57, 58. This effect changes the FRET efficiency through a change in γ. Similarly, photoinduced electron transfer between DNA bases and dye can quench dyes and this phenomenon can be influenced by protein binding in the vicinity59-61.
Interpreting data: pitfalls and tips
High throughput TIR based experiments help us acquire statistically significant amounts of data rapidly. The main challenge then is the data analysis and interpretation that can sometimes be baffling due to potential artifacts or ambiguities. Here are some pointers on what to watch out for.
- Do not dwell on ‘interesting’ effects observed in a small fraction (< 5%) of molecules because at that level, many artifacts cannot be distinguished from real events. Instead, improve the biological constructs and assay conditions so that the majority of the molecules function similarly.
- If the correction factor γ is close to 1, the total fluorescence signal (sum of donor and acceptor intensities), I total, should remain constant. Continual changes in _I_total may be a sign of non-specific attachment. Additional sources for intensity noise include transient binding of fluorescent impurities, changes in dye properties due to interaction with proteins or the surface, or gradual loss of focus.
- Long movies that show single step photobleaching events should be acquired to ascertain that the signal acquired is indeed from single molecules.
- Reversible switching off (termed blinking) of Cy5 (or similar dyes)62 is a well-known artifact (see Fig. 1b) that has been frequently misinterpreted as a large conformation change to a state with very low FRET, for example macromolecular unfolding. The rule of thumb is that if FRET drops instantaneously to the level of donor only (_E_app = 0), consider it blinking. If a very low FRET state shows up even in the presence of blinking suppressants like Trolox, and if a direct excitation of acceptor confirms its activity, one can rule out blinking. Photophysical phenomenon like blinking can also be distinguished by their known dependence on excitation intensity28.
While the analysis of single molecule data is system dependent, some commonly used tools are worth mentioning. Information on equilibrium properties is best gleaned through the smFRET histogram generated by averaging each molecule's FRET efficiency over the first 3-10 data points. We typically obtain 10-20 short (∼5 s) movies of different areas of the sample for an unbiased overview of population distribution. Time trajectories of individual molecules (from long movies) in equilibrium convey valuable kinetics information of the system via dwell times in each conformational state. For example, for a two state system undergoing stochastic transitions, the transition rates are determined from exponential decay fits to the dwell time distribution of each state63 or by performing the autocorrelation analysis combined with equilibrium determination if the transitions are too fast for reliable dwell time determination64. For more complicated transitions between distinctly identifiable multiple states, a Hidden Markov Model (HMM) analysis can be used for an unbiased estimate of the number of FRET states populated, to estimate the rates of interconversion among them and to determine the most likely time evolution of each state65 (available for download at http://bio.physics.uiuc.edu/HaMMy.html). A transition density plot of initial to final FRET values for each transition obtained from HMM (or other) analysis provides a visually attractive and objective compilation of the data57, 65-67. Other information theory based approaches are also available for confocal single molecule data obtained photon by photon68-70. The advantages of single molecule experiments become more obvious in non-equilibrium conditions where one can follow, for example, the reaction pathway of a single enzyme undergoing a series of transitions to achieve its catalytic cycle. A powerful, visual method of presenting the non-equilibrium smFRET data of many molecules was developed for ribosome studies71.
Limitations of smFRET
It is crucial to point out some of the limitations of the technique before one designs a first smFRET experiment. (1) smFRET requires attachment of at least two extrinsic dyes to the molecule(s) of interest since (semi-) intrinsic chromophores such as 2-aminopurine and tryptophan are not sufficiently bright or photostable for single-molecule measurement. In some cases site-specific labeling is not trivial, especially for large RNA molecules72, 73 and many proteins74, 75. Note that smFRET is relatively insensitive to incomplete labeling. If the donor is missing, the molecule is simply not observed; if the acceptor is missing, this donor-only species shows up as a zero-FRET population. (2) Since single-molecule detection is achieved via spatial separation, weakly interacting fluorescent species are difficult to study (but not always, vide supra). (3) FRET is insensitive to distance changes outside the 2 - 8 nm inter-dye distance range for _R_0 = 5 nm. However, distance changes as small as 0.3 nm can be detected from single-molecules between 0.6_R_0 and 1.5_R_0 where FRET is almost a linear function of R. (4) To achieve adequate signal-to-noise ratio, ∼100 total photons need to be detected. Considering that more than 105 photons can be collected from single dye molecules before photobleaching, more than 103 data points can be obtained. (5) Time resolution is limited by the frame rate of the CCD camera (in best case = 1 ms). (6) Absolute distance estimation is challenging due to the dependence of the fluorescence properties and energy transfer on the environment and orientation of the dyes. So, smFRET has been employed mostly for problems where precise distance information is not vital. Nevertheless, reasonable estimates of orientation factors can be made76 and control experiments with each dye can provide good approximations of the inter-dye distances77, 78. Concerns about these issues could be further alleviated by using a redundant number of distance constraints in triangulation studies79, 80.
Advanced smFRET techniques
Some of the new and exciting technical developments still at the proof-of-principle stage are summarized below.
As the system under study becomes complex, additional information is needed to resolve ambiguities. For this purpose, three-color smFRET was realized by using Cy3 (donor), Cy5 (acceptor 1), and Cy5.5 (acceptor 2) as three distinct fluorophores and optimizing confocal detection optics and developing a new data analysis scheme43. Using this technique, correlated motions of different segments of a DNA four-way (Holliday) junction were detected. The three-color smFRET also works on a TIRF-based setup and led to a direct observation of protein motion on single stranded DNA (unpublished results). Three-color single molecule detection was also used to distinguish multiple species and to observe interactions among three different molecules81, 82. A multi-color excitation scheme for further distinguishing different molecular species83, 84 has recently been extended to three-color FRET85. Promise has also been shown for extending FRET further with several fluorophores on single DNA molecules86.
As the importance of mechanical factors in biology is recognized, a missing dimension of controlled manipulation with force is being added to smFRET, with the ultimate goal of measuring conformational changes via fluorescence as a function of force applied by techniques such as optical and magnetic tweezers. Optical tweezers have been combined with single molecule fluorescence dequenching87 and FRET88 to report on the force-induced unzipping of DNA hairpin. Magnetic tweezers were used to build a FRET vs. force calibration curve for an entropic spring made of a single stranded DNA89. More recently, the low-force response of single Holliday junctions was tracked using a hybrid instrument combining FRET and optical tweezers to map out the 2D folding landscape90. smFRET was also combined with the single channel recording of a simple dimeric gramicidin channel91, 92.
Final Notes
We have discussed practical issues on the well-established TIR-based smFRET and also briefly mentioned more futuristic technical developments. Two areas that are still lacking in development are measurements in living cell, which probably requires substantial improvements of probes, and analysis of membrane protein dynamics, which is already challenging at the ensemble level. Nevertheless, smFRET is one of the powerful tools at hand for ‘looking’ at real-time dynamics and interactions of single biomolecules. All we need now is to open our ‘single-molecule’ eyes to the vast array of biomolecular interactions that demand careful scrutiny.
Supplementary material
Supplementary materials
Supplementary Table 1: List of Materials and Reagents
Supplementary Table 2: List of Optics and Instruments
Supplementary Protocol: Polyethylene Glycol (PEG) surface passivation protocol
Supplementary Methods: TIR excitation and emission set up
Acknowledgments
We acknowledge I. Rasnik, S. Mckinney, C. Joo, R. Clegg, S. Myong and members of Ha group at University of Illinois and K. Drexhage at Universität Siegen for expert advise and discussion, S. Syed at University of Illinois for procurement of the dyes and reagents and P. Cornish, M. Brenner and L. Supriya for carefully reading the manuscript. C. Joo prepared the video instruction on PEG slide preparation. Author's work on single molecule FRET was funded by National Institutes of Health, National Science Foundation career award and Howard Hughes Medical Institute. S. H. was also supported by Research Settlement Fund for the new faculty at Seoul National University (Korea), Ministry of Science and Technology grant (No. RH0-2005-000-01003-0, 2007), and Basic Science Research Grant from the Korea Research Foundation.
Footnotes
Competing interests statement: The authors declare no competing financial interests.
References
- 1.Feynman RP. There's plenty of room at the bottom. J Microelectromech Syst. 1992;1:60–66. [Google Scholar]
- 2.Bustamante C, Bryant Z, Smith SB. Ten years of tension: single-molecule DNA mechanics. Nature. 2003;421:423–427. doi: 10.1038/nature01405. [DOI] [PubMed] [Google Scholar]
- 3.Moerner WE, Fromm DP. Methods of single-molecule fluorescence spectroscopy and microscopy. Rev Sci Inst. 2003;74:3597–3619. [Google Scholar]
- 4.Forster T. Experimental and Theoretical Investigation of the Intermolecular Transfer of Electronic Excitation Energy. Zeitschrift Naturforsch A. 1949;4:321–327. [Google Scholar]
- 5.Ha T. Single-molecule fluorescence resonance energy transfer. Methods. 2001;25:78–86. doi: 10.1006/meth.2001.1217. [DOI] [PubMed] [Google Scholar]
- 6.Weiss S. Fluorescence spectroscopy of single biomolecules. Science. 1999;283:1676–1683. doi: 10.1126/science.283.5408.1676. [DOI] [PubMed] [Google Scholar]
- 7.Joo C, Ha T. In: Single molecule techniques: A Laboratory Manual. Selvin P, Ha T, editors. Cold Spring Harbor Laboratory Press, Cold Spring Harbor; NY: 2007. pp. 3–36. [Google Scholar]
- 8.Ha T, et al. Probing the interaction between two single molecules: fluorescence resonance energy transfer between a single donor and a single acceptor. Proc Natl Acad Sci U S A. 1996;93:6264–6268. doi: 10.1073/pnas.93.13.6264. [DOI] [PMC free article] [PubMed] [Google Scholar]
- 9.Kapanidis AN, et al. Alternating-laser excitation of single molecules. Acc Chem Res. 2005;38:523–533. doi: 10.1021/ar0401348. [DOI] [PubMed] [Google Scholar]
- 10.Michalet X, Weiss S, Jager M. Single-molecule fluorescence studies of protein folding and conformational dynamics. Chem Rev. 2006;106:1785–1813. doi: 10.1021/cr0404343. [DOI] [PMC free article] [PubMed] [Google Scholar]
- 11.Seidel R, Dekker C. Single-molecule studies of nucleic acid motors. Curr Opin Struct Biol. 2007;17:80–86. doi: 10.1016/j.sbi.2006.12.003. [DOI] [PubMed] [Google Scholar]
- 12.Smiley RD, Hammes GG. Single molecule studies of enzyme mechanisms. Chem Rev. 2006;106:3080–3094. doi: 10.1021/cr0502955. [DOI] [PubMed] [Google Scholar]
- 13.Zhuang XW. Single-molecule RNA science. Annu Rev Biophys Biomol Struct. 2005;34:399–414. doi: 10.1146/annurev.biophys.34.040204.144641. [DOI] [PubMed] [Google Scholar]
- 14.Forster T. In: Modern Quantum Chemistry. O S, editor. Academic Press; New York: 1967. pp. 93–137. [Google Scholar]
- 15.Stryer L, Haugland RP. Energy transfer: a spectroscopic ruler. Proc Natl Acad Sci U S A. 1967;58:719–726. doi: 10.1073/pnas.58.2.719. [DOI] [PMC free article] [PubMed] [Google Scholar]
- 16.Deniz AA, et al. Single-pair fluorescence resonance energy transfer on freely diffusing molecules: observation of Forster distance dependence and subpopulations. Proc Natl Acad Sci U S A. 1999;96:3670–3675. doi: 10.1073/pnas.96.7.3670. [DOI] [PMC free article] [PubMed] [Google Scholar]
- 17.Best RB, et al. Effect of flexibility and cis residues in single-molecule FRET studies of polyproline. Proc Natl Acad Sci U S A. 2007;104:18964–18969. doi: 10.1073/pnas.0709567104. [DOI] [PMC free article] [PubMed] [Google Scholar]
- 18.Merchant KA, Best RB, Louis JM, Gopich IV, Eaton WA. Characterizing the unfolded states of proteins using single-molecule FRET spectroscopy and molecular simulations. Proc Natl Acad Sci U S A. 2007;104:1528–1533. doi: 10.1073/pnas.0607097104. [DOI] [PMC free article] [PubMed] [Google Scholar]
- 19.Schuler B, Eaton WA. Protein folding studied by single-molecule FRET. Curr Opin Struct Biol. 2008 doi: 10.1016/j.sbi.2007.12.003. [DOI] [PMC free article] [PubMed] [Google Scholar]
- 20.Ha T, Chemla DS, Enderle T, Weiss S. Single molecule spectroscopy with automated positioning. App Phys Lett. 1997;70:782–784. [Google Scholar]
- 21.Sabanayagam CR, Eid JS, Meller A. High-throughput scanning confocal microscope for single molecule analysis. App Phys Lett. 2004;84:1216–1218. [Google Scholar]
- 22.Zhuang X, et al. A single-molecule study of RNA catalysis and folding. Science. 2000;288:2048–2051. doi: 10.1126/science.288.5473.2048. [DOI] [PubMed] [Google Scholar]
- 23.Brasselet S, Peterman EJG, Miyawaki A, Moerner WE. Single-molecule fluorescence resonant energy transfer in calcium concentration dependent cameleon. J Phys Chem B. 2000;104:3676–3682. [Google Scholar]
- 24.Hohng S, Ha T. Single-molecule quantum-dot fluorescence resonance energy transfer. Chemphyschem. 2005;6:956–960. doi: 10.1002/cphc.200400557. [DOI] [PubMed] [Google Scholar]
- 25.Hohng S, Ha T. Near-complete suppression of quantum dot blinking in ambient conditions. J Am Chem Soc. 2004;126:1324–1325. doi: 10.1021/ja039686w. [DOI] [PubMed] [Google Scholar]
- 26.Kapanidis AN, Weiss S. Fluorescent probes and bioconjugation chemistries for single-molecule fluorescence analysis of biomolecules. J Chem Phys. 2002;117:10953–10964. [Google Scholar]
- 27.Hubner CG, Renn A, Renge I, Wild UP. Direct observation of the triplet lifetime quenching of single dye molecules by molecular oxygen. J Chem Phys. 2001;115:9619–9622. [Google Scholar]
- 28.Rasnik I, McKinney SA, Ha T. Nonblinking and long-lasting single-molecule fluorescence imaging. Nat Meth. 2006;3:891–893. doi: 10.1038/nmeth934. [DOI] [PubMed] [Google Scholar]
- 29.Rust MJ, Bates M, Zhuang X. Sub-diffraction-limit imaging by stochastic optical reconstruction microscopy (STORM) Nat Meth. 2006;3:793–795. doi: 10.1038/nmeth929. [DOI] [PMC free article] [PubMed] [Google Scholar]
- 30.Widengren J, Chmyrov A, Eggeling C, Lofdahl PA, Seidel C. Strategies to Improve Photostabilities in Ultrasensitive Fluorescence Spectroscopy. J Phys Chem A. 2007;111:429–440. doi: 10.1021/jp0646325. [DOI] [PubMed] [Google Scholar]
- 31.Benesch RE, Benesch R. Enzymatic removal of oxygen for polarography and related methods. Science. 1953;118:447–448. doi: 10.1126/science.118.3068.447. [DOI] [PubMed] [Google Scholar]
- 32.Aitken CE, Marshall RA, Puglisi J. An oxygen scavenging system for improvement of dye stability in single-molecule fluorescence experiments. Biophys J. 2007;107:117689. doi: 10.1529/biophysj.107.117689. biophysj. [DOI] [PMC free article] [PubMed] [Google Scholar]
- 33.Wu PG, Brand L. Resonance Energy-Transfer - Methods and Applications. Anal Biochem. 1994;218:1–13. doi: 10.1006/abio.1994.1134. [DOI] [PubMed] [Google Scholar]
- 34.Clegg RM. Fluorescence resonance energy transfer and nucleic acids. Methods Enzymol. 1992;211:353–388. doi: 10.1016/0076-6879(92)11020-j. [DOI] [PubMed] [Google Scholar]
- 35.Murphy MC, Rasnik I, Cheng W, Lohman TM, Ha T. Probing single-stranded DNA conformational flexibility using fluorescence spectroscopy. Biophys J. 2004;86:2530–2537. doi: 10.1016/S0006-3495(04)74308-8. [DOI] [PMC free article] [PubMed] [Google Scholar]
- 36.Ryu YH, Schultz PG. Efficient incorporation of unnatural amino acids into proteins in Escherichia coli. Nat Meth. 2006;3:263–265. doi: 10.1038/nmeth864. [DOI] [PubMed] [Google Scholar]
- 37.Higuchi R, Krummel B, Saiki RK. A general method of in vitro preparation and specific mutagenesis of DNA fragments: study of protein and DNA interactions. Nucleic Acids Res. 1988;16:7351–7367. doi: 10.1093/nar/16.15.7351. [DOI] [PMC free article] [PubMed] [Google Scholar]
- 38.Braman J. In Vitro Mutagenesis Protocols. 2nd. Vol. 182. Humana Press; Totowa, NJ: 2001. [Google Scholar]
- 39.Pennington MW. Site-specific chemical modification procedures. Methods Mol Biol. 1994;35:171–185. doi: 10.1385/0-89603-273-6:171. [DOI] [PubMed] [Google Scholar]
- 40.Axelrod D. Noninvasive techniques in cell biology. Wiley-Liss; New York: 1990. [Google Scholar]
- 41.Axelrod D. Total internal reflection fluorescence microscopy in cell biology. Methods Enzymol. 2003;361:1–33. doi: 10.1016/s0076-6879(03)61003-7. [DOI] [PubMed] [Google Scholar]
- 42.Michalet X, et al. Detectors for single-molecule fluorescence imaging and spectroscopy. J Mod Opt. 2007;54:239–281. doi: 10.1080/09500340600769067. [DOI] [PMC free article] [PubMed] [Google Scholar]
- 43.Hohng S, Joo C, Ha T. Single-molecule three-color FRET. Biophys J. 2004;87:1328–1337. doi: 10.1529/biophysj.104.043935. [DOI] [PMC free article] [PubMed] [Google Scholar]
- 44.Ha T, et al. Initiation and re-initiation of DNA unwinding by the Escherichia coli Rep helicase. Nature. 2002;419:638–641. doi: 10.1038/nature01083. [DOI] [PubMed] [Google Scholar]
- 45.Sofia SJ, Premnath VV, Merrill EW. Poly(ethylene oxide) Grafted to Silicon Surfaces: Grafting Density and Protein Adsorption. Macromolecules. 1998;31:5059–5070. doi: 10.1021/ma971016l. [DOI] [PubMed] [Google Scholar]
- 46.Schroeder CM, Blainey PC, Kim S, Xie XS. In: Single molecule techniques: A Laboratory Manual. Selvin P, Ha T, editors. Cold Spring Harbor Laboratory Press, Cold Spring Harbor; NY: 2007. pp. 461–492. [Google Scholar]
- 47.Heyes CD, Kobitski AY, Amirgoulova EV, Nienhaus GU. Biocompatible surfaces for specific tethering of individual protein molecules. J Phys Chem B. 2004;108:13387–13394. [Google Scholar]
- 48.Heyes CD, Groll J, Moller M, Nienhaus GU. Synthesis, patterning and applications of star-shaped poly(ethylene glycol) biofunctionalized surfaces. Mol BioSyst. 2007;3:419–430. doi: 10.1039/b700055n. [DOI] [PubMed] [Google Scholar]
- 49.Cha T, Guo A, Zhu XY. Enzymatic activity on a chip: The critical role of protein orientation. Proteomics. 2005;5:416–419. doi: 10.1002/pmic.200400948. [DOI] [PubMed] [Google Scholar]
- 50.Rhoades E, Gussakovsky E, Haran G. Watching proteins fold one molecule at a time. Proc Natl Acad Sci U S A. 2003;100:3197–3202. doi: 10.1073/pnas.2628068100. [DOI] [PMC free article] [PubMed] [Google Scholar]
- 51.Okumus B, Wilson TJ, Lilley DM, Ha T. Vesicle encapsulation studies reveal that single molecule ribozyme heterogeneities are intrinsic. Biophys J. 2004;87:2798–2806. doi: 10.1529/biophysj.104.045971. [DOI] [PMC free article] [PubMed] [Google Scholar]
- 52.Benitez JJ, et al. Probing transient copper chaperone-Wilson disease protein interactions at the single-molecule level with nanovesicle trapping. J Am Chem Soc. 2008;130:2446–2447. doi: 10.1021/ja7107867. [DOI] [PMC free article] [PubMed] [Google Scholar]
- 53.Cisse I, Okumus B, Joo C, Ha T. Fueling protein-DNA interactions inside porous nanocontainers. Proc Natl Acad Sci U S A. 2007 doi: 10.1073/pnas.0610673104. [DOI] [PMC free article] [PubMed] [Google Scholar]
- 54.Myong S, Rasnik I, Joo C, Lohman TM, Ha T. Repetitive shuttling of a motor protein on DNA. Nature. 2005;437:1321–1325. doi: 10.1038/nature04049. [DOI] [PubMed] [Google Scholar]
- 55.Van der Meer BW. Resonance Energy Transfer. Wiley; Chichester: 1999. [Google Scholar]
- 56.Ha T, et al. Single-molecule fluorescence spectroscopy of enzyme conformational dynamics and cleavage mechanism. Proc Natl Acad Sci U S A. 1999;96:893–898. doi: 10.1073/pnas.96.3.893. [DOI] [PMC free article] [PubMed] [Google Scholar]
- 57.Joo C, et al. Real-time observation of RecA filament dynamics with single monomer resolution. Cell. 2006;126:515–527. doi: 10.1016/j.cell.2006.06.042. [DOI] [PubMed] [Google Scholar]
- 58.Luo G, Wang M, Konigsberg WH, Xie XS. Single-molecule and ensemble fluorescence assays for a functionally important conformational change in T7 DNA polymerase. Proc Natl Acad Sci U S A. 2007;104:12610–12615. doi: 10.1073/pnas.0700920104. [DOI] [PMC free article] [PubMed] [Google Scholar]
- 59.Clegg RM, Murchie AI, Zechel A, Lilley DM. Observing the helical geometry of double-stranded DNA in solution by fluorescence resonance energy transfer. Proc Natl Acad Sci U S A. 1993;90:2994–2998. doi: 10.1073/pnas.90.7.2994. [DOI] [PMC free article] [PubMed] [Google Scholar]
- 60.Cooper JP, Hagerman PJ. Analysis of fluorescence energy transfer in duplex and branched DNA molecules. Biochemistry. 1990;29:9261–9268. doi: 10.1021/bi00491a022. [DOI] [PubMed] [Google Scholar]
- 61.Lee SP, Porter D, Chirikjian JG, Knutson JR, Han MK. A fluorometric assay for DNA cleavage reactions characterized with BamHI restriction endonuclease. Anal Biochem. 1994;220:377–383. doi: 10.1006/abio.1994.1353. [DOI] [PubMed] [Google Scholar]
- 62.Ha TJ, et al. Temporal fluctuations of fluorescence resonance energy transfer between two dyes conjugated to a single protein. Chem Phys. 1999;247:107–118. [Google Scholar]
- 63.Colquhoun D, Hawkes AG. In: Single Channel Recording. Sakmann B, Neher E, editors. Plenum Press; New York: 1995. pp. 397–482. [Google Scholar]
- 64.Kim HD, et al. Mg2+-dependent conformational change of RNA studied by fluorescence correlation and FRET on immobilized single molecules. Proc Natl Acad Sci U S A. 2002;99:4284–4289. doi: 10.1073/pnas.032077799. [DOI] [PMC free article] [PubMed] [Google Scholar]
- 65.McKinney SA, Joo C, Ha T. Analysis of single-molecule FRET trajectories using hidden Markov modeling. Biophys J. 2006;91:1941–1951. doi: 10.1529/biophysj.106.082487. [DOI] [PMC free article] [PubMed] [Google Scholar]
- 66.Munro JB, Altman RB, O'Connor N, Blanchard SC. Identification of two distinct hybrid state intermediates on the ribosome. Mol Cell. 2007;25:505–517. doi: 10.1016/j.molcel.2007.01.022. [DOI] [PMC free article] [PubMed] [Google Scholar]
- 67.Myong S, Bruno MM, Pyle AM, Ha T. Spring-loaded mechanism of DNA unwinding by hepatitis C virus NS3 helicase. Science. 2007;317:513–516. doi: 10.1126/science.1144130. [DOI] [PMC free article] [PubMed] [Google Scholar]
- 68.Yang H, Xie XS. Probing single-molecule dynamics photon by photon. J Chem Phys. 2002;117:10965–10979. [Google Scholar]
- 69.Andrec M, Levy RM, Talaga DS. Direct determination of kinetic rates from single-molecule photon arrival trajectories using hidden Markov models. J Phys Chem A. 2003;107:7454–7464. doi: 10.1021/jp035514+. [DOI] [PMC free article] [PubMed] [Google Scholar]
- 70.Schroder GF, Grubmuller H. Maximum likelihood trajectories from single molecule fluorescence resonance energy transfer experiments. J Chem Phys. 2003;119:9920–9924. [Google Scholar]
- 71.Blanchard SC, Gonzalez RL, Kim HD, Chu S, Puglisi JD. tRNA selection and kinetic proofreading in translation. Nat Struct Mol Biol. 2004;11:1008–1014. doi: 10.1038/nsmb831. [DOI] [PubMed] [Google Scholar]
- 72.Smith GJ, Sosnick TR, Scherer NF, Pan T. Efficient fluorescence labeling of a large RNA through oligonucleotide hybridization. RNA. 2005;11:234–239. doi: 10.1261/rna.7180305. [DOI] [PMC free article] [PubMed] [Google Scholar]
- 73.Dorywalska M, et al. Site-specific labeling of the ribosome for single-molecule spectroscopy. Nucleic Acids Res. 2005;33:182–189. doi: 10.1093/nar/gki151. [DOI] [PMC free article] [PubMed] [Google Scholar]
- 74.Deniz AA, et al. Single-molecule protein folding: diffusion fluorescence resonance energy transfer studies of the denaturation of chymotrypsin inhibitor 2. Proc Natl Acad Sci U S A. 2000;97:5179–5184. doi: 10.1073/pnas.090104997. [DOI] [PMC free article] [PubMed] [Google Scholar]
- 75.Jager M, Nir E, Weiss S. Site-specific labeling of proteins for single-molecule FRET by combining chemical and enzymatic modification. Protein Sci. 2006;15:640–646. doi: 10.1110/ps.051851506. [DOI] [PMC free article] [PubMed] [Google Scholar]
- 76.Dale RE, Eisinger J, Blumberg WE. Orientational Freedom of Molecular Probes - Orientation Factor in Intra-Molecular Energy-Transfer. Biophys J. 1979;26:161–193. doi: 10.1016/S0006-3495(79)85243-1. [DOI] [PMC free article] [PubMed] [Google Scholar]
- 77.Schuler B, Lipman EA, Steinbach PJ, Kumke M, Eaton WA. Polyproline and the “spectroscopic ruler” revisited with single-molecule fluorescence. Proc Natl Acad Sci U S A. 2005;102:2754–2759. doi: 10.1073/pnas.0408164102. [DOI] [PMC free article] [PubMed] [Google Scholar]
- 78.Rothwell PJ, et al. Multiparameter single-molecule fluorescence spectroscopy reveals heterogeneity of HIV-1 reverse transcriptase:primer/template complexes. Proc Natl Acad Sci U S A. 2003;100:1655–1660. doi: 10.1073/pnas.0434003100. [DOI] [PMC free article] [PubMed] [Google Scholar]
- 79.Rasnik I, Myong S, Cheng W, Lohman TM, Ha T. DNA-binding orientation and domain conformation of the E. coli rep helicase monomer bound to a partial duplex junction: single-molecule studies of fluorescently labeled enzymes. J Mol Biol. 2004;336:395–408. doi: 10.1016/j.jmb.2003.12.031. [DOI] [PubMed] [Google Scholar]
- 80.Andrecka J, et al. Single-molecule tracking of mRNA exiting from RNA polymerase II. Proc Natl Acad Sci U S A. 2008;105:135–140. doi: 10.1073/pnas.0703815105. [DOI] [PMC free article] [PubMed] [Google Scholar]
- 81.Clamme JP, Deniz AA. Three-color single-molecule fluorescence resonance energy transfer. Chemphyschem. 2005;6:74–77. doi: 10.1002/cphc.200400261. [DOI] [PubMed] [Google Scholar]
- 82.Heinze KG, Jahnz M, Schwille P. Triple-color coincidence analysis: One step further in following higher order molecular complex formation. Biophys J. 2004;86:506–516. doi: 10.1016/S0006-3495(04)74129-6. [DOI] [PMC free article] [PubMed] [Google Scholar]
- 83.Kapanidis AN, et al. Fluorescence-aided molecule sorting: Analysis of structure and interactions by alternating-laser excitation of single molecules. Proc Natl Acad Sci U S A. 2004;101:8936–8941. doi: 10.1073/pnas.0401690101. [DOI] [PMC free article] [PubMed] [Google Scholar]
- 84.Muller BK, Zaychikov E, Brauchle C, Lamb DC. Pulsed interleaved excitation. Biophys J. 2005;89:3508–3522. doi: 10.1529/biophysj.105.064766. [DOI] [PMC free article] [PubMed] [Google Scholar]
- 85.Lee NK, et al. Three-color alternating-laser excitation of single molecules: Monitoring multiple interactions and distances. Biophys J. 2007;92:303–312. doi: 10.1529/biophysj.106.093211. [DOI] [PMC free article] [PubMed] [Google Scholar]
- 86.Heilemann M, et al. Multistep energy transfer in single molecular photonic wires. J Am Chem Soc. 2004;126:6514–6515. doi: 10.1021/ja049351u. [DOI] [PubMed] [Google Scholar]
- 87.Lang M, Fordyce P, Engh A, Neuman K, Block S. Combined fluorescence & force microscopy. Biophys J. 2003;84:301a–301a. [Google Scholar]
- 88.Tarsa PB, et al. Detecting force-induced molecular transitions with fluorescence resonant energy transfer. Angew Chem Int Ed. 2007;46:1999–2001. doi: 10.1002/anie.200604546. [DOI] [PMC free article] [PubMed] [Google Scholar]
- 89.Shroff H, et al. Biocompatible force sensor with optical readout and dimensions of 6 nm(3) Nano Lett. 2005;5:1509–1514. doi: 10.1021/nl050875h. [DOI] [PubMed] [Google Scholar]
- 90.Hohng S, et al. Fluorescence-force spectroscopy maps two-dimensional reaction landscape of the holliday junction. Science. 2007;318:279–283. doi: 10.1126/science.1146113. [DOI] [PMC free article] [PubMed] [Google Scholar]
- 91.Borisenko V, et al. Simultaneous optical and electrical recording of single gramicidin channels. Biophys J. 2003;84:612–622. doi: 10.1016/S0006-3495(03)74881-4. [DOI] [PMC free article] [PubMed] [Google Scholar]
- 92.Harms GS, et al. Probing conformational changes of gramicidin ion channels by single-molecule patch-clamp fluorescence microscopy. Biophys J. 2003;85:1826–1838. doi: 10.1016/S0006-3495(03)74611-6. [DOI] [PMC free article] [PubMed] [Google Scholar]
- 93.Tan E, et al. A four-way junction accelerates hairpin ribozyme folding via a discrete intermediate. Proc Natl Acad Sci U S A. 2003;100:9308–9313. doi: 10.1073/pnas.1233536100. [DOI] [PMC free article] [PubMed] [Google Scholar]
- 94.Haugland R. Handbook of Fluorescence Probes and Research Products. 9th. Molecular Probes; Eugene, OR: 2002. [Google Scholar]
- 95.Jager M, Michalet X, Weiss S. Protein-protein interactions as a tool for site-specific labeling of proteins. Protein Sci. 2005;14:2059–2068. doi: 10.1110/ps.051384705. [DOI] [PMC free article] [PubMed] [Google Scholar]
- 96.Ratner V, Kahana E, Eichler M, Haas E. A General Strategy for Site-Specific Double Labeling of Globular Proteins for Kinetic FRET Studies. Bioconjug Chem. 2002;13:1163–1170. doi: 10.1021/bc025537b. [DOI] [PubMed] [Google Scholar]
Associated Data
This section collects any data citations, data availability statements, or supplementary materials included in this article.
Supplementary Materials
Supplementary materials
Supplementary Table 1: List of Materials and Reagents
Supplementary Table 2: List of Optics and Instruments
Supplementary Protocol: Polyethylene Glycol (PEG) surface passivation protocol
Supplementary Methods: TIR excitation and emission set up