Pulsed infrared light alters neural activity in rat somatosensory cortex in vivo (original) (raw)
. Author manuscript; available in PMC: 2012 Jul 1.
Abstract
Pulsed infrared light has shown promise as an alternative to electrical stimulation in applications where contact free or high spatial precision stimulation are desired. Infrared neural stimulation (INS) is well characterized in the peripheral nervous system; however, to date, research has been limited in the central nervous system. In this study, pulsed infrared light (λ=1.875 μm, pulse width=250 μs, radiant exposure=0.01–0.55 J/cm2, fiber size=400 μm, repetition rate=50–200 Hz) was used to stimulate the somatosensory cortex of anesthetized rats, and its efficacy was assessed using intrinsic optical imaging and electrophysiology techniques. INS was found to evoke an intrinsic response of similar magnitude to that evoked by tactile stimulation (0.3–0.4% change in intrinsic signal magnitude). A maximum deflection in the intrinsic signal was measured to range from 0.05% to 0.4% in response to INS, and the activated region of cortex measured approximately 2 mm in diameter. The intrinsic signal magnitude increased with faster laser repetition rates and increasing radiant exposures. Single unit recordings indicated a statistically significant decrease in neuronal firing that was observed at the onset of INS stimulation (0.5 s stimulus) and continued up to 1 s after stimulation onset. The pattern of neuronal firing differed from that observed during tactile stimulation, potentially due to a different spatial integration field of the pulsed infrared light compared to tactile stimulation. The results demonstrate that INS can be used safely and effectively to manipulate neuronal firing.
Keywords: Infrared neural stimulation, INS, laser stimulation, optical imaging, cerebral cortex, electrical stimulation, tactile
1. Introduction
Infrared neural stimulation (INS) represents a relatively new stimulation modality that exhibits high spatial precision and can be delivered in a contact free method for the stimulation of neural tissue (Wells et al., 2005b). Investigations into the use of pulsed infrared light to stimulate neural tissue by our group began in the peripheral nervous system (PNS) where we, and others, have demonstrated the ability of INS to reliably evoke action potentials in peripheral nerves (Fried et al., 2008; Teudt et al., 2007; Wells et al., 2007b). Pulsed infrared light can also stimulate auditory ganglion cells in the cochlea with high spatial precision establishing INS as a possible alternative to electrical stimulation for cochlear implants (Izzo et al., 2008; Rajguru et al., 2010b; Richter et al., 2010). Most recently, embryonic quail hearts were paced by pulsed infrared light, suggesting the possibility of optically based pacemakers (Jenkins et al., 2010). In the central nervous system (CNS) the first application of INS was demonstrated by our group in thalamocortical brain slices (Cayce et al., 2010).
For each of these applications, the parameter set for INS had to be established. Stimulation of the sciatic and facial nerve required low frequency stimulation (maximum of 5 Hz) to evoke stimulus locked compound muscle action potentials; the threshold radiant exposures were 0.4 J/cm2 and 0.7 J/cm2 for the Sciatic and Facial nerves, respectively (Teudt et al., 2007; Wells et al., 2007b). Stimulation of rat cavernous nerves with infrared light at a radiant exposure of 1 J/cm2 at 10 Hz for 60s produced a complex intracavernosal pressure response with no functional loss (Fried et al., 2008). In cochlear studies, effective non-damaging stimulation parameters, consisting of high frequency (at least 200 Hz), short pulse width stimulation, evoked potentials in the inferior colliculus (Izzo et al., 2008; Rajguru et al., 2010a; Richter et al., 2010). The pacing of embryonic hearts required radiant exposures of 0.8 J/cm2 at 2 Hz (Jenkins et al., 2010). The different stimulation parameters across each of these studies illustrates that each new INS application requires the identification of unique laser parameters to best activate a new target tissue.
The differences in anatomy and physiology of the CNS compared to the PNS present a new set of challenges in applying INS to activate neural tissue. Unlike the PNS where axons of both afferent and efferent neurons are organized in parallel bundles in fascicles of nerves, the brain contains complex neuronal networks with interwoven architectures. In addition, cellular composition of the CNS (e.g. neurons, support cells such as astrocytes, ogliodendrocytes, and microglia) may affect neuronal responses in ways not seen in PNS studies. Thus, even though INS is an effective means of stimulation in the PNS, fully realizing the potential of INS to activate CNS tissue will require complete characterization of stimulation parameters for each CNS structure. This study represents a further step towards this goal.
To approach in vivo cortical application, we first investigated feasibility of CNS stimulation with infrared light by applying INS to thalamocortical brain slices in vitro (Cayce et al., 2010). The thalamocortical brain slice model preserves a three-neuron network between cortical and thalamic neurons present in vivo (Agmon and Connors, 1991; Blanton et al., 1989; Kao and Coulter, 1997). In the slice study, we demonstrated that pulsed infrared light could stimulate CNS neurons and evoked potentials could be blocked with tetrodotoxin (TTX). Parametric studies showed that the absorption coefficient of a given wavelength determined stimulation threshold. An increase in spot size and higher repetition rates both reduced stimulation threshold. The results from this study supported previous findings that suggest a temperature gradient (dT/dz or dT/dt) is the most likely mechanism by which pulsed infrared light induces neural activation (Wells et al., 2007a). While the brain slice model was ideal for establishing feasibility, there are fundamental differences between an in vitro brain-slice and an in vivo application.
The purpose of this study was to examine whether pulsed infrared light could be used to regulate cortical neuronal activity in vivo and to investigate laser parameters that activated cortex without causing damage. Both electrophysiological and intrinsic optical imaging techniques were used to characterize signals generated by INS. Because intrinsic optical imaging offers a large field of view (~10mm) and high spatial resolution (10 μm), it has been an effective way to examine functional organization in cerebral cortex and to guide microelectrode placement to characterize neuronal responses (Hillman, 2007; Roe, 2007). In this study, we chose the rat somatosensory cortex corresponding to the forepaw and barrel fields because these areas have been well characterized (Chapin and Lin, 1984; Dunn et al., 2005; Petersen, 2007; Tsytsarev et al., 2010) and lend themselves well to assessment of INS effects. We report that INS can manipulate somatosensory cortex activity without apparent detriment to cortical function. This study represents the first successful application of INS to cortical structures in vivo, where INS has potential clinical use and shows promise to be a useful tool for future studies of neuronal circuitry.
2. Methods
2.1. Surgical Procedures
All procedures were performed in accordance with protocols approved by the Vanderbilt University IACUC. Briefly, male Long Evan rats (n = 15; 300 – 500 g) were anesthetized with a 50% urethane (Sigma, St. Louis MO) solution (I.P. 1.4 g/kg). The toe-pinch test was used to ensure the animal was in an adequate state of anesthesia. A tracheotomy was performed to allow for ventilation (Harvard Model 683 Small Animal Ventilator, Harvard Apparatus Holliston, MA) of the animal during the experiment. The animal was placed in a stereotactic frame and a craniotomy and durotomy were conducted to expose somatosensory cortex (+2 to −5 mm AP, and 7 mm lateral to bregma (Chapin and Lin, 1984; Paxinos and Watson, 2007). Mannitol (1.0 ml, 20% concentration) was given I.P. to prevent potential brain swelling. Warm (~ 37 Celsius) 3% agar (Sigma, St. Louis MO) in saline was used to stabilize the cortex and a glass coverslip was placed on the agar to create an imaging window for optical imaging. A small portion of agar was dissected away to create an access port for placement of the optical fiber for application of INS.
2.2. Optical Imaging
Ten animals were used in experiments involving optical imaging. Intrinsic signal optical imaging was performed using a CCD camera (NeuroCCD-SM256, SciMeasure Analytical Systems, Inc. Decatur, GA) positioned over the craniotomy. Cortex was illuminated by 632 nm bandpass filtered light from a halogen light source and focused onto the brain using fiber optics. Light reflected from cortex was collected onto the CCD chip using a Dark Invader 50 mm F/1.3 lens (B.E. Meyers & Co., Inc., Redmond WA) and a Ex2C Computar C-mount extender (CBC (AMERICA) Corp., Commack, NY) to provide a working distance of 20 cm and a FOV of approximately 5 × 5 mm. This working distance allowed for easy placement of the optical fiber used for laser stimulation.
The Redshirt Imaging System running Cortiplex software (Redshirt Imaging, Decatur, GA) controlled the sequence of the entire experiment. The software collected images from the CCD camera and controlled the stimulus presentation (Fig. 1). At the beginning of each imaging trial, Redshirt software started collecting image frames and sent a binary code specifying a stimulus condition to a stimulus computer running LabVIEW software and National Instruments hardware (National Instruments, Austin, TX). The LabVIEW program sent TTL pulses to the laser and the driver of the piezoelectric stimulators at the desired repetition rate for a given experiment. Radiant exposure, pulse width, and wavelength were all preset on the laser. Voltage and pulse width were preset on the piezoelectric controller. Stimuli were presented 300 ms after trial onset. After image acquisition the intertrial interval was 8–15 s. Fig. 1B outlines the imaging protocol used to collect images.
Fig. 1.

Experimental setup for infrared neural stimulation and optical imaging. (A) Schematic diagram of the experimental setup. Experiment is controlled by Redshirt imaging software that acquires images and determines when stimuli are presented by signaling a separate computer running LabVIEW software that is responsible for stimulus presentation. The LabVIEW control computer triggers stimuli by sending TTL pulses to either the piezoelectric controller or the laser. The optical fiber used to deliver infrared light is positioned on cortex or just above cortex through a window created through agar and the piezoelectric bender is positioned on targeted forepaw digit or whiskers. Image shows an example of a fiber positioned on cortex through a port created in the agar. (B) Imaging protocol flow chart of one trial for a given condition.
We designed two types of imaging runs. For runs with only cutaneous stimulation, images were typically collected for 3 s at a frame rate of 5 Hz. For experiments with at least one INS condition, images were collected for 10 to 15 s at a frame rate of 10 Hz. In all experiments there were at least two conditions for a given imaging run: one stimulus condition (i.e. tactile or INS) and one blank (no stim) condition. In most cases there were multiple stimulation conditions (i.e. one tactile and 3 laser conditions). Conditions were grouped into blocks where each condition was presented in an interleaved and pseudorandom manner. Between 25 and 50 blocks of each condition were collected for one imaging run.
2.3. Laser Stimulation Parameters
Wavelength selection for performing infrared neural stimulation was based on the optical penetration depth of light in tissue which was estimated using absorption data for water since biological soft tissue is 70% water (Hale and Query 1970). Previous studies using infrared light to stimulate tissue have indicated that an optical penetration depth of 300 – 600 microns is optimal for stimulating neural tissue (Cayce et al. 2010, Richter et al. 2010, Wells et al. 2005a). This optical penetration depth range corresponded to a wavelength of 1.875 μm. Infrared neural stimulation was performed using a 1.875 μm±0.02μm Capella neural stimulator (Lockheed Martin Aculight, Bothel WA). Light was delivered to the cortex through a 400 μm Ocean Optics fiber (St. Petersburg, FL) with a numerical aperture (NA) of 0.22. The fiber was placed between 0 – 1000 μm from cortex using a hydraulic micromanipulator (Narishige, Tokyo, Japan). Laser repetition rate ranged between 50 – 200 Hz, and pulse width was held constant at 250 μs. The average power from the laser was measured at the fiber tip using a Power Max 500D laser power meter with a PM3 detector head (Coherent, Santa Clara, CA). Radiant exposure was calculated based on the NA of the fiber and the distance of the fiber tip from cortex (Wells et al., 2005a). The radiant exposure varied between 0.01 – 0.55 J/cm2 and was dependent on the stimulation parameters used for a given experiment. Pulse train duration for all INS experiments was 500 ms. Laser triggering was controlled via a LabVIEW software interface (Fig. 1).
2.4. Tactile Stimulation Parameters
Piezoelectric benders (Noliac, Kvistgaard, Denmark) were used to present vibratory stimuli to the forepaw digits or the whiskers contralateral to the cortical recording site. Each piezoelectric stimulator was driven using DC pulses from a GRASS stimulator (S88 Astro-Med Inc, West Warwick, RI) that was triggered by LabVIEW software to control stimulation (Fig. 1). For optical imaging, square wave pulses at 8 Hz for 3 seconds were delivered to the piezoelectric; for electrophysiology, pulses were delivered to the piezoelectric at 1 Hz for 3 seconds. Neurophysiological responses to palpation were used to map somatosensory cortex and to assess the health and functionality of cortex before, during and after INS presentation.
2.5. Optical Imaging Data Analysis
Analysis of optical imaging data was performed with software written in Matlab (Mathworks, Natick, MA). All conditions (blank and experimental) were first frame subtracted and then summed across trials to maximize signal to noise ratio. Experimental conditions were then blank-subtracted to measure changes in the intrinsic signal from baseline (Roe, 2007). Trial by trial assessment of image quality was conducted to remove any bad trials due to lighting abnormalities, large physiological movement, or camera acquisition errors. As determined by the signal to noise ratio for a given experiment, image maps were optimized for display by clipping the range (0.8 – 2.5 standard deviations) of pixel values around the mean. In some cases, a blood vessel mask was used to reduce artifact signal related to surface vasculature. Standard Gaussian low-pass and median high-pass filtering were used to remove contamination from uneven illumination and from other physiological noise sources. A student’s t-test was used to compare stimulation conditions to blank conditions to identify significant pixels and create t-maps. This analysis aided in identifying regions of interest for time course analysis. The time course of the intrinsic signal was examined at selected sites by averaging the values of pixels within the region of interest. The summed pixel value from the first image frame was subtracted from each subsequent sequence of frames in a condition’s sequence and then used as a divisor to measure the change in reflectance over background reflectance (dR/R). The blank time course was then subtracted from each experimental condition to remove non-stimulus associated changes in reflectance. In a given experiment, the maximum deflection magnitude of the signal was used to determine the peak of the intrinsic response and was used to compare the ability of each stimulation condition to induce intrinsic responses.
2.6. Electrophysiology Recordings
Five additional animals were used to study the electrophysiology associated with INS. Single unit electrophysiology was used to assess the cortical neuronal responsiveness before, during, and after INS. Tungsten microelectrodes (1 – 3 MΩ, World Precision Instruments, Sarasota, FL) were inserted into cortex at depths of 50 – 500 μm in regions of interest identified from piezoelectric tactile stimulation. Single units were isolated with high spontaneous activity to study the effects of INS on neuronal activity. The fiber optic was placed approximately 1 mm away from the electrode. Signals were filtered and digitized using a 16 channel AM-Systems (Sequim, WA) differential amplifier using a 300 – 5K bandpass filter. The LabVIEW interface was used to control presentation of tactile and laser stimulation, and Datawave software (Loveland, CO) was used to collect single unit data. Peristimulus time histograms (PSTH) were generated using Dataview software. A paired Student’s t-test analysis was used to determine the significance of changes observed in the PSTH related to laser stimulation.
3. Results
The experiments described below were conducted in rat somatosensory cortex, either in barrel cortex in response to whisker stimulation or in forepaw cortex in response to tactile stimulation of the digits.
3.1. Intrinsic optical imaging of vibrotactile stimulation
Baseline functionality and viability of somatosensory cortex prior to the application of INS was assessed through optical imaging of hemodynamic responses in somatosensory cortex. Fig. 2 illustrates a normal functional response to vibrotactile stimulation of D2 and D4 of the contralateral forepaw in response to taps delivered by a piezoelectric stimulator (8 Hz, 3 s). Darker pixels in the functional maps indicate activation (Fig. 2B, C, and D). Cortical activation to D4 stimulation was medial and posterior to D2 as emphasized by the dark (D4, ROI2) and light (D2, ROI1) ROIs in the subtraction map between the two conditions (Fig. 2D). Fig. 2E, F and G illustrate signal time courses taken from the D2 (ROI 1), D4 (ROI 2), and control (edge of craniotomy, ROI 3) locations, respectively. Optical responses to D2 stimulation, D4 stimulation, and the no stimulation conditions are plotted in green, blue, and red traces, respectively. As indicated by the larger negative deflections in intrinsic signal magnitude, the time courses of activation (Fig. 2E–G) demonstrated preferential activation for stimulation of D2 at the D2 site (ROI 1) and for stimulation of D4 at the D4 site (ROI 2). The intrinsic signals were not focal within the forepaw representation as D2 stimulation activated the D4 ROI and D4 stimulation activated the D2 ROI. The blank condition (no stimulation) produced little response at the D2 and D4 sites, which was comparable to the lack of signal obtained at the control site for all three conditions (Fig. 2G). These activation maps are representative of the optical responses obtained in rat barrel cortex and rat forepaw cortex generated by tactile stimulation in our experiments.
Fig. 2.

Typical intrinsic imaging response to vibrotactile stimulation of contralateral forepaw digits. (A) Blood vessel map. Black boxes are region of interests where time course data was calculated for D2, D4, and no stimulation conditions. (B & C) Activation maps in response to stimulation of D2 and D4 respectively. Darkening in image indicates activation. (D) D4 – D2 subtraction map, darkened area represents selective D4 and lightened area selective D2 activation. (E–G) Time courses of intrinsic signals taken from region of interests demarcated by black and white boxes in (A–D). Traces in green, blue, and red indicate responses to D2, D4, and no stimulation conditions. ROI 1 corresponds to a D2 region of cortex, ROI 2 corresponds to a D4 region of cortex and ROI 3 corresponds to a non-activated region of cortex. Black bar represents the timing of the stimulus. Stimulation parameters: 3 sec train, 8 Hz. Imaging Parameters: 10 fps, 21 trials. A = anterior, M = medial. Scale bar next to (D) indicates clipping range of % change in signal in respective images
3.2. Demonstration of INS induced optical intrinsic signals
Infrared neural stimulation was then examined to determine if pulsed infrared light could induce an optical response in cerebral cortex comparable to that induced by natural sensory stimulation. Fig. 3 demonstrates that INS of cortical tissue induces changes in optical reflectance signal of somatosensory cortex. A fiber optic was placed over somatosensory cortex corresponding to the barrel fields (Fig. 3A). Stimulation of the cortex with INS (100 Hz, 0.55 J/cm2, λ=1.875 μm, 250 μs pulse width, 500 ms pulse train) evoked changes in optical reflectance at and near the fiber optic location, as illustrated by the activation map shown in Fig. 3B. The activated region of cortex (dark pixels) in response to these INS parameters produced a focal region of activation, approximately 1.5 – 2 mm in diameter. As shown in Fig. 3C, the time course reaches a peak after 1 s and has a duration of 3 s. The magnitude of the change in reflectance peaked at approximately 0.15%.. No such optical reflectance change was obtained during the Blank condition. Optical signal changes were not observed at sites distant from the INS location (Fig. 3D), indicating that the INS-induced signal has high spatial selectivity. In a separate experiment, the same laser conditions used in Fig. 3A were used to generate a response in forepaw cortex to demonstrate that INS can evoke optical responses in different cortical areas (Fig. 3E–H). These experiments demonstrated that INS is capable of inducing optical responses in somatosensory cortex, some of which are similar to those obtained with natural tactile stimulation.
Fig. 3.

INS evoked intrinsic optical signals in somatosensory cortex. INS evokes intrinsic optical signals in somatosensory barrel field (A–D) and forepaw cortex (E–H) in separate experiments (632 nm). (A & E) Blood vessel maps indicating ROI locations (ROI 1&3 = site near INS stimulation, ROI 2&4 = site distant from INS stimulation) and fiber location (Fiber). (B & F) Activation maps obtained to laser stimulation in barrel field cortex (B) and forepaw cortex (F). (C & G) Time course of signals in region near laser stimulation (ROI 1 and ROI 3). (D & H) Time course of signals distant from laser stimulation site (ROI 2 and ROI 4). Blue line reflects signal evoked by laser stimulation. Red line shows control (no stim) time course. There is no appreciable optical response at this distance from laser stimulation. Laser parameters: λ = 1.875 μm, repetition rate = 100 Hz, pulse train duration = 500 ms, pulse width = 250 μs, radiant exposure = 0.55 J/cm2, spot size diameter = 400 μm. Imaging Parameters: 5 fps, ITI = 8 s, Trials = 40. A = anterior, M = medial. Black bar in (C–H) represents the timing of the stimulus. Scale bars next to (B & F) indicate clipping range of respective images.
3.3. Effects of laser repetition rate on INS evoked intrinsic signal
To further establish that the optical signal was indeed induced by INS, we varied repetition rate (Fig. 4) to study how the reflectance signal changed in relation to the repetition rate of the laser. Our expectation was that the greater the total light energy applied to the cortex, the stronger the optical reflectance change. Using a 500 ms duration pulse train and 250 μs pulse width, we applied repetition rates of 50, 100, 150, and 200 Hz (Fig. 4B–E). Fig. 4A illustrates the location of the fiberoptic (Fiber) as well as a t-map generated via pixel-by-pixel t-tests (p < 0.001) between the 100 Hz laser stimulation and blank conditions (orange colored pixels). As can be seen qualitatively in Fig. 4B–E, an increase in laser repetition rate increased the size of the activation region. Quantitatively, the 200 Hz laser stimulus (aqua blue line) produced the largest optical reflectance change, while a 50 Hz stimulus (pink line) produced the smallest response (Fig. 4F). As shown in Fig 4G, the magnitude of the intrinsic signal exhibits an exponential fit with repetition rate (cf. Cayce et al., 2010).
Fig. 4.

Intrinsic signals produced by different rates of INS. (A) Blood vessel map. Location of fiberoptic is indicated by arrow. Orange pixels indicate significant pixels in t-test between 100 Hz stimulation and blank condition. (B–E) Activation maps of laser repetition rates: 50 Hz (B), 100 Hz (C), 150 Hz (D), 200 Hz (E). (F) Time course of response resulting from laser stimulation conditions 50 Hz (red), 100 Hz (blue), 150 Hz (yellow), and 200 Hz (aqua blue) and blank conditions. (G) Laser repetition rate versus the peak amplitude of the intrinsic signal. Relationship fit with an exponential equation. Laser parameters: λ = 1.875 μm, repetition rates = 50, 100, 150, 200 Hz, pulse train duration = 500 ms, pulse width = 250 μs, radiant exposure = 0.55 J/cm2, spot size = 400 μm. Imaging parameters: 40 Trials, 5 f/s. A = anterior, M = medial. Black bar in (F) represents the timing of the stimulus. Scale bar next to (E) indicates clipping range of images (B–E).
3.4. Effects of radiant exposure on intrinsic signal
Threshold is an important aspect of INS to consider when developing the modality as an alternative to electrical stimulation. Fig. 5 displays the functional response when the radiant exposure of each pulse was adjusted across imaging runs, and examines the time course of activation for the ROI (red box) shown in Fig. 5A. The laser parameters of stimulation used to generate these time courses were 200 Hz, 500 ms duration pulse train of 250 μs pulses at the five different radiant exposures indicated in the figure legend. Fig. 5B&C show the functional maps to 0.14 j/cm2 and 0.48 J/cm2 radiant exposures. As expected, the smallest radiant exposure (0.14 J/cm2 Fig. 5D, blue line) resulted in the smallest intrinsic signal magnitude. Intermediate radiant exposures (0.21 and 0.32 and J/cm2, green and red lines) produced intermediate signal size, and the largest radiant exposures tested (0.37 and 0.48 J/cm2, purple and orange lines) resulted in the largest signal amplitudes. The magnitude of the intrinsic signal exhibits a linear fit with radiant exposure (Fig. 5E). The area of activation also increased with radiant exposure energy, as shown qualitatively (Fig. 5B&C).
Fig. 5.

Increased INS radiant exposure leads to an increase in intrinsic signal magnitude. (A) Blood vessel map showing location of ROI (red box) and fiber location (tip barely in FOV). (B & C) Activation maps from stimulation with 0.14 J/cm2 and 0.48 J/cm2. (D) Time course of signal for different radiant exposures. (E) Radiant exposure versus peak amplitude of the intrinsic signal. Relationship fit with a linear equation. Laser parameters: λ = 1.875 μm, repetition rate = 200 Hz, pulse train duration = 500 ms, pulse width = 250 μs, spot size = 400 μm, radiant 0.14 (blue), 0.21 (green), 0.32 (red), 0.37 (purple), 0.48 J/cm2 (orange). A = anterior, M = medial. Black bar in (D) represents the timing of the stimulus. Scale bar next to (C) indicates clipping range of images.
Thus, within the ranges tested, both increases in laser stimulation rate and radiant exposures resulted in greater optical activation signal, suggesting a consistent and specific effect of laser stimulation on cortical response.
3.5. Effective distance of INS induced effect
The spatial selectivity of INS in cortical tissue was characterized by calculating the time course of the intrinsic signal at five distinct locations. Fig. 6 displays the time courses based on distance from the laser stimulation site (200 Hz, 0.55 J/cm2, pulse width 250 μs, pulse train 500 ms). In Fig. 6A, the red box represents the region of interest closest to the optical fiber; the orange and magenta boxes are the most distant regions of interest. The peak signal is largest for the location closest to the fiber optic (Fig. 6B, red line) and decreases in amplitude with distance from the stimulation location. This decline in signal size with distance also occurred in other directions as indicated by the comparable signal amplitude of magenta and orange ROIs in Fig. 6A. As also shown in Fig. 3, the prominent effects of INS stimulation lies within 1–2 mm of the stimulation site and declines rapidly as a function of distance from the stimulation site (Fig. 6C). The spatial temporal aspects of the signal are illustrated in Fig. 6D through a time series of optical images taken during the imaging run. The data was temporally binned by 2 to decrease the number of images displayed in the mosaic; therefore, each frame represents 400 ms in time. The stimulus came on at 200 ms and was off at 700 ms after trial start, which indicates frames 1–2 represent the time the laser was turned on. The signal peaks between frames 7 and 8 which corresponds to the time courses displayed in Fig. 6B. Furthermore, Fig 6D demonstrates that laser induced intrinsic signal is focal in an area measuring approximately 1 mm in diameter at its peak demonstrating the spatial precision of INS. This spatially limited characteristic makes INS a potentially useful method for studies requiring focal stimulation. The time series of images for 50, 100, 150, and 200 Hz were included as a supplemental figure to further demonstrate the effects of repetition rate on the evoked signal and to demonstrate the spatial precision of INS.
Fig. 6.

Spatial distribution of intrinsic signal in response to INS. (A) Blood vessel map with sampled ROIs overlaid. Color of box in map corresponds to color of time course trace displayed in (B). (B) Intrinsic signal time courses at different distances from the INS stimulation location. Dashed black line corresponds to the no stimulation condition collected from the red-boxed ROI. (C) Peak amplitude of the intrinsic signal as a function of distance from the fiber. Relationship fit with an exponential equation. (D) Time mosaic of optical images to illustrate the spatiotemporal aspects of the INS induced intrinsic signal. Images were temporally binned by two decreasing the effective frames per second to 2.5 Hz. Laser parameters: λ = 1.875 μm, repetition rate: 200 Hz, pulse train duration = 500 ms, pulse width = 250 μs, radiant exposure = 0.55 J/cm2, spot size = 400 μm. Imaging parameters: 40 Trials, 5 f/s. Black bar in (B) represents the timing of the stimulus. A= anterior, M = medial.
3.6. Inhibitory effect of INS stimulation (without tactile stimulation) in somatosensory cortex
In addition to optical imaging, electrophysiological techniques were used to study the effects of INS on neuronal activity. Fig. 7A displays the positioning of the electrode and fiber, approximately 1 mm apart. This arrangement was similar for each experiment involving electrophysiological measurements. Units that were responsive to tactile stimulation were isolated to assess cortical function during INS. Fig. 7B displays the results of laser stimulation on spontaneous neural activity. Illustrated is a peristimulus time histogram (PSTH) resulting from the irradiation of somatosensory cortex (186 trials with intertrial intervals of 15 s; radiant exposure of 0.019 J/cm2, pulse width of 250 μs, pulse train length of 500 ms). Stimulus onset occurred at time zero and lasted for 500 ms (hashed bar on PSTH). We observed that INS led to a reduction in firing rate that lasted approximately 1.5–2.0 s, followed by a return to baseline levels. This reduction in firing rate was statistically significant, as evaluated by comparing the two seconds prior to stimulation and the two seconds post stimulation onset (paired t-test, α=0.05, −2000ms to 0 ms: p < 0.0046 0.0188, 2000ms to 4000 ms p<9.55e-50). No statistical difference was observed between the two seconds before stimulation and the time region corresponding to 2 – 4 seconds after stimulation offset.
Fig. 7.

INS induces an inhibitory neural response and does not alter neuronal response to tactile stimulation. (A) Image of somatosensory cortex corresponding to barrel field showing electrode and fiber placement. Fiber stimulation site to electrode distance was approximately 1 mm. Electrode tip was placed 50 μm into cortex. (B) PSTH showing modulation of neural response to INS (30 trials). The laser-induced inhibition of neural activity had a duration of approximately 1.5 s and was followed by a rebound. (C) PSTH of vibrotactile stimulation generated by a piezoelectric bender deflecting contralateral whiskers once at each arrow. Laser and whisker stimulation were interleaved. (D) PSTH of vibrotactile stimulation after INS. (C & D) Demonstrate INS did not cause a loss of cortex functionally responding to sensory stimulation. Laser parameters: λ = 1.875 μm, repetition rate = 100 Hz, pulse train duration = 500 ms, pulse width = 250 μs, radiant exposure = 0.019 J/cm2, spot size = 1200 μm. Hatched bar in (B) represents the timing of the stimulus. A= anterior, M = medial.
3.7. Cortex remains responsive during INS
The physiologic health of the cortex was assessed through electrophysiological recordings of neuronal responses to tactile stimulation. In Fig. 7C&D, tactile stimulation was delivered by a piezoelectric stimulator that deflected contralateral whiskers once at each arrow in the PSTH. During runs in which INS was interleaved with tactile stimulation, consistent, normal neural responses to tactile stimulation were recorded (Fig. 7C). The PSTH in Fig. 7D represents tactile stimulation alone after INS had been applied demonstrating no loss in functionality. These recordings from tactile stimulation demonstrate that the normal excitatory and inhibitory periods of post-stimulation responses were present. Thus, even after repeated presentation of INS for a period of over 2 hours, normal neuronal tactile responses remained intact indicating that INS does not cause damage to cortex which compromises neuronal activity.
3.8. Stability of INS induced responses
Stability of INS induced responses is important to consider when assessing the stimulation modality’s efficacy for neuroscience applications and eventual translation to clinical studies. To examine the stability of INS induced responses, we produced a sequence of PSTHs by dividing the total number of INS trials into sequential 40 trial epochs. Fig. 8 displays a sequence of PSTHs recorded from a single unit in response to INS (radiant exposure 0.055 J/cm2, spot size 850 μm, repetition rate of 200 Hz, pulse width 250 μs, train length 500 ms, 15 s intertrial interval). In most of the histograms, inhibition is most evident during the period from stimulus onset (time = 0 s) to approximately 1 s. In this example, it can be seen that INS induced inhibition is readily apparent from trial 1 to at least trial 120, and although appears to weaken slightly subsequently, the signal is still evident as late as trials 360–400. Paired t-tests between the two seconds following stimulus onset and prestimulus periods indicate that the difference in spike rate is statistically significant (α=0.05) for the summation of all trials (Fig. 8K) indicating that INS in rat somatosensory cortex has an immediate inhibitory effect on neuronal response, one which appears to remain present over many trials.
Fig. 8.

Inhibitory effect of INS on neural activity is consistent over many trials. (A–J) PSTH mosaic of ten segments (40 trials per segment). The laser induced inhibition is strongest in the first 120 trials, then weakens but is evident through trials 361–400. (K) PSTH summation of all segments (A – J). Laser parameters: λ=1.875μm, repetition rate = 200 Hz, pulse train duration = 500 ms, pulse width = 250 μs, radiant exposure = 0.0549 J/cm2, spot size = 850 μm. Hatch bars represent the timing of the stimulus.
A separate experiment was conducted to assess the stability of this effect at two separate time points during an experiment. Fig. 9A represents an initial PSTH taken over 30 trials separated by ITIs of 30 s. Again a period of statistically significant (paired t-test, −1 s to 0 s: p < 0.01, 1 s to 2 s p<4.08E-5) inhibition of baseline activity was observed within the first 1 s after INS onset (spot size 850 μm, pulse train length 500ms, pulse width 250 μs, radiant exposure of approximately 0.078 J/cm2). The laser was then turned off and the cortex was allowed to rest for 30 minutes after which the experiment was repeated. Fig. 9B illustrates the PSTH recorded from single unit activity at the same location using the same laser parameters used to generate Fig. 9A. Again, a period of inhibition was obtained within the first 1 s following INS (paired t-test, −1 s to 0 ms: p < 0.03, 1 s to 2 s p<0.00038). This further demonstrates the repeatability of the inhibitory effect.
Fig. 9.
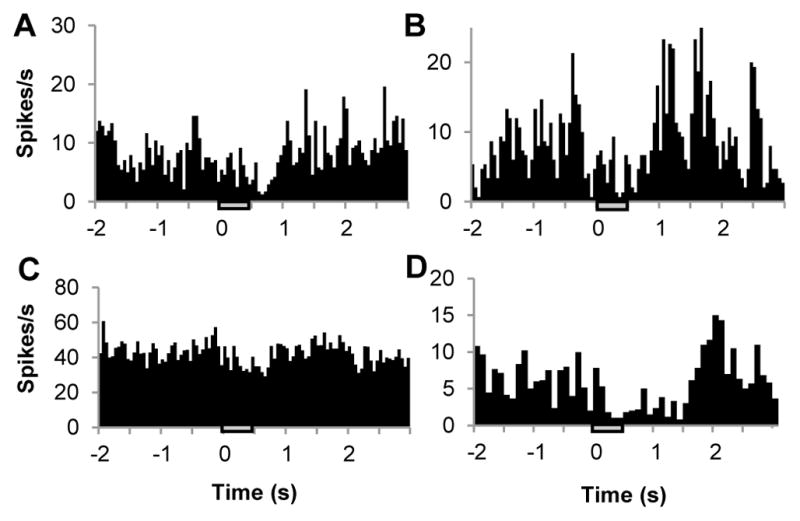
Repeatability of the neural INS inhibitory effect. (A) PSTH of single unit in response to INS. (B) A second PSTH from the same unit taken approximately 30 minutes later. Laser parameters: λ = 1.875 μm, repetition rate= 200 Hz, pulse train duration = 500 ms, pulse width = 250 μs, radiant exposure = 0.078 J/cm2, spot size= 850 μm. (C,D) PSTHs from other experiments showing inhibition from different cells. Laser parameters: λ = 1.875 μm, repetition rate =100 Hz, pulse train duration = 500 ms, pulse width = 250 μs, radiant exposures: 0.043 J/cm2 and 0.12 J/cm2, spot sizes= 880 μm and 840 μm. Inhibition was observed regardless of baseline activity of a single unit. Hatch bars in represent the timing of the stimulus.
Fig. 9C&D illustrate two separate single units from experiments performed on individual animals where INS generated an inhibitory response in each PSTH. The repetition rate was set at either 100 and 200 Hz for each PSTH and the radiant exposure was 0.078 J/cm2 and 0.019 J/cm2 respectively, using a 500 ms pulse train and a pulse width of 250 μs. INS induced inhibition was significant (paired t-tests: Fig. 9C, 0 to 1 s vs. −1 to 0 s: p < 0.0037, or vs. 1 to 2 s; p < 0.000185; Fig. 9D 0 to 2 s vs. −2 to 0 s: p < 0.0188, or 2 to 4 s p<0.0047). In total, statistically significant inhibitory responses were observed in all five animals studied in this fashion; excitatory responses were not observed. Thus, the effect of direct INS stimulation in rat somatosensory cortex appears to be inhibitory, as this effect was seen across all animals, different stimulation parameters, within different epochs of repeated INS stimulation, and during different recording periods within an experiment.
4. Discussion
4.1. Summary
We have previously demonstrated that in brain slices CNS neurons can be excited using pulsed infrared light (Cayce et al., 2010). Almost all previously published studies on INS of neural tissue have focused on the PNS (Duke et al., 2009; Fried et al., 2008; Izzo et al., 2008; Jenkins et al., 2010; Rajguru et al., 2010b; Richter et al., 2010; Wells et al., 2007b; Wininger et al., 2009). This study is the first to examine the effects of INS on cortical tissue in vivo. Using intrinsic signal imaging, we find that INS induced changes in optical reflectance can show similarities to intrinsic signal responses previously reported for sensory stimuli presented to somatosensory or visual cortex (Chen et al., 2007; Grinvald, 1985; Roe, 2007; Ts’o et al., 1990; Tsytsarev et al., 2010; Vanzetta et al., 2005). As assessed by optical imaging, the spatial extent of the INS stimulus revealed a roughly 2 mm region of effect, demonstrating a localized response to INS in cortical tissue that is similar to the high spatial precision that has been well characterized in PNS applications (Duke et al., 2009; Fried et al., 2008; Izzo et al., 2008; Teudt et al., 2007; Wells et al., 2007b). The amplitude of the intrinsic response increased with increasing infrared light energy, produced either by increasing the stimulation frequency or by increasing the radiant energy of the laser (Figs. 4&5). Changing the radiant exposure induced a linear response in peak signal magnitude compared to an exponential response demonstrated by changing the repetition rate. An exponential relationship was also observed in thalamocortical slices where stimulation threshold decreased with increasing repetition rate (Cayce et al., 2010). That INS repetition rate affects cortical activity differently than radiant exposures suggests total radiant exposure alone cannot fully explain the functional results.
Infrared irradiation of the cortex did not appear to harm tissue, as both optical and neuronal signals were maintained, as shown with interleaved INS and tactile stimulation trials and normal subsequent measurements of tactile activation following 2-hour periods of repeated INS stimulation. Interestingly, cortical neuronal activity was significantly inhibited during the 1 s period post INS onset. This inhibition was consistently observed across animals, different laser stimulation parameters, and sustained epochs of neuronal recording. This is the first report of INS evoking neuronal inhibition (Cayce et al., 2010; Fried et al., 2008; Izzo et al., 2006; Richter et al., 2010; Teudt et al., 2007; Wells et al., 2007b).
4.2. What underlies the INS evoked response?
Although the mechanism underlying INS induced optical changes is unknown, the effect is believed to be a transient heat-induced effect (Wells et al., 2007a). While temperature change was not measured in this study, other studies have looked at temperature change using similar stimulation parameters (Izzo et al, 2008, Richter et al., 2010). In these studies, the average temperature change was estimated to be between 3 – 5 °C, and was shown to be non-damaging. The mechanism by which the heat gradient is transduced into neural signal is currently thought to be via heat-sensitive TRP receptors or via thermally mediated changes in ion channels (Ricther et al, 2010, Wells et al., 2007a). However, many potential sources, other than neural activity, could have led to the observed INS changes in optical reflectance (darkening of tissue) (Bouchard et al., 2009; Roe, 2007). An argument can be made that the source of the intrinsic signal induced by the laser is simply the result of heat-induced vasodilation or heat-induced cellular changes, such as cellular swelling or changes in cellular chromophores. However, we find this unlikely to be a primary effect, as the time course of the intrinsic signals evoked by infrared light reached its peak at approximately 2 s after laser offset (Figs. 3–6), a time at which all heat associated with the laser would have dissipated (τtherm = 112 ms, heat dissipated at 10*τtherm; cf. Izzo et al 2008, Germert and Welch 1995). Another possibility for the observed OIS response is an immediate heat response. If the laser evoked intrinsic signal was simply an immediate heat response, then the signal would be expected to decay exponentially. Instead our results indicate a long sustained response similar to that seen in sensory-induced intrinsic signals, suggestive of a neuronal related response. Additionally, studies that have used electrical stimulation to stimulate either the whisker pad or the fore/hindpaw demonstrated similar timecourses. Jones et al demonstrated that a 1 sec electrical stimulus (15 Hz, 1.6 mA) of the whisker pad produced a timecourse with a 6 second duration (Jones et al., 2001), and Bouchard et al demonstrated that the timecourse of the reduced oxy-hemoglobin signal does not return to baseline until ~5 secs post stimulation when electrical stimulation (3Hz, 1mA, for 4s stimulation) is applied to the hind-paw (Bouchard et al., 2009). While we are not able to exclude heat-induced cellular changes or vasodilation as contributing factors, the strongest support for a neural response are the electrophysiology results which demonstrate clear, consistent inhibitory neuronal response, lasting approximately 1 s after laser stimulation onset (Figs. 7–9). We support the idea that INS, like sensory induced changes, led to changes in reflectance through such factors as changes in blood volume, blood oxygenation, and light scattering. The 632 nm illuminant used in this study targets the hemodynamic component and has been shown to correlate strongly with neuronal response.
The physiologic and anatomical differences between the PNS and the CNS can be used to help identify possible sources for the observed inhibitory response. In the PNS, all structures stimulated by infrared light have involved a nerve where stimulation could be applied and monitored downstream from the stimulation site. Conversely, the cerebral cortex of the brain consists of a neural network and contains inhibitory interneurons, and glial cells, astrocytes, ogliodendrocytes, and microglia, in a greater concentration than excitatory neurons. Direct stimulation of cortex with light could evoke responses in excitatory neurons that would then propagate in numerous directions making it difficult to detect evoked excitatory responses or INS could evoke direct responses in the smaller inhibitory neurons or glial cells. A confounding issue is the depth at which the infrared light penetrates into the tissue. In this study, the wavelength of light (1.875 μm) penetrates approximately 300 – 600 μm into tissue, where intensity decays exponentially following Beer’s law (Cayce et al., 2010; Hale and Querry, 1973). This indicates that mainly layers I and II of cortex are stimulated with only a small percentage of photons reaching layer III. A higher number of inhibitory neurons and astrocytes are present in layers I and II than excitatory neurons which are mainly located in layers III/IV (Helmstaedter et al., 2008; Takata and Hirase, 2008). However, the dendritic tree of the pyramidal cells located in deeper layers project up to the superficial layers of cortex and will contribute to the absorption of infrared energy. Astrocytes present another possible component underlying the INS-induced response. Several groups have suggested that astrocytes have a role in generating hemodynamic responses (Hillman, 2007; Schummers et al., 2008; Takano et al., 2006; Wang et al., 2006). Other groups have demonstrated that astrocytes have an active role in modulating neuronal transmission (Bowser and Khakh, 2004; Cunha, 2008; Koizumi et al., 2003; Kozlov et al., 2006; Perea et al., 2009). Future studies are needed to determine the primary contributors to INS-induced cortical effects.
4.3. Correlation of intrinsic optical signal and neuronal inhibition
This is the first example of INS causing inhibition whereas all other INS studies evoked excitation (Cayce et al., 2010; Fried et al., 2008; Izzo et al., 2006; Teudt et al., 2007; Wells et al., 2007b). Although our neuronal sample is small, we do not believe our results are purely due to sampling bias. Our electrodes were those typically used for extracellular recordings and isolate excitatory neuronal activity quite readily (e.g. Fig. 7C&D). Although we typically sampled neurons from the superficial cortical layers, some recordings were also taken from deeper layers. We observed that the INS related neural activity was not limited to a specific depth or region of somatosensory cortex. In our recordings, we were more likely to sample cells with detectable spontaneous activity or clear tactilely driven response. Thus, there was nothing particularly unusual or unique about our sampling methods. It should be noted that tungsten microelectrodes likely bias towards sampling large pyramidal neurons and not responses from smaller inhibitory neurons.
While it is possible that INS had a suppressive effect on apical pyramidal cell dendrites in the superficial layers, it is also possible that INS has an excitatory effect on inhibitory neurons in superficial layers, resulting in the suppressed pyramidal neuronal responses we detected. Feng et al. recently demonstrated that infrared light can increase the GABA current in isolated single cell recordings using cultured rat neurons (Feng et al., 2010), raising the possibility that some of the effects we observed may be direct effects on inhibitory neurons. Given the robust optical signals obtained with INS and the fact that our electrodes are biased towards larger neurons, it is likely that the predominant INS effect is preferential activation of inhibitory neurons. This is consistent with the effective penetration depth of the INS wavelength and stimulation parameters used here, which is likely to reach primarily Layers I–II where inhibitory neurons are a predominant cellular component. We plan to conduct similar experiments in other cortical areas and other species to examine whether this is a general effect or whether it might be unique to rat somatosensory cortex.
This study underscores the fact that the neural basis of intrinsic optical signals is complex. Although many studies of cortical function emphasize the correlation of intrinsic signal magnitude with excitatory (presumably pyramidal) neuronal response, this is clearly not always the case. Subthreshold neuronal responses also have been highlighted as significant components of intrinsic cortical signals (Das and Gilbert, 1995; Grinvald et al., 1994; Toth et al., 1996). However, association of intrinsic optical signals with inhibitory neuron activation is less well documented. Although we have only inferred this relationship indirectly and thus further study is required, in this respect, this study is one of the first to highlight such a relationship.
Another possibility we have considered relates to the size of the laser stimulation fiber. We used a 400 μm diameter fiber positioned at distances up to 1.1 mm from the cortex, resulting in a spot size of up to 800 μm. The large size of the activation spot may have the effect of recruiting additional inhibitory circuits in somatosensory cortex. There are many examples of inhibitory effect of nearby barrels on the whisker barrel of interest (Derdikman et al., 2003; Simons and Carvell, 1989). In visual cortex, larger size stimulation very frequently leads to inhibition (Ghose, 2009; Levitt and Lund, 1997). This is due to additional inhibitory circuits that are activated when the spot size goes beyond the receptive field size. This is a common feature of cortical circuitry and could underlie the basis for the observed inhibitory responses. Whether excitatory/inhibitory effect is related to laser spot size would best be addressed in INS experiments using fibers of different diameter.
4.4. Future Directions
Many applications in the field of neuroscience could benefit from the high spatial selectivity of INS. For instance, INS could be used to study functional neural circuitry. While electrical stimulation is an established stimulation method in the field of neuroscience (Fritsch and Hitzig, 1870; Galvani, 1791), inherent electrical field spread makes it difficult to contain the area of neural activation. Infrared energy is governed by its optical penetration depth and can be engineered to target a specific volume of tissue. Consequently, neural activation by INS has been shown to be more spatially precise than electrical stimulation (Wells et al. 2005a b) and has the potential to stimulate a single neuron (Feng et al. 2010).Infrared neural stimulation also has the advantage of being minimally invasive, reducing the risk of damaging neural tissue by physical contact, and could be a useful high spatial resolution brain mapping method during intraoperative procedures during neurosurgery ((Roux and Tremoulet, 2002; Starr et al., 2002). Potential application for deep brain stimulation is also a future possibility. The work presented here represents the first step towards realization of these goals and provides a promising stepping-stone towards future more advanced applications.
Supplementary Material
01
Acknowledgments
We thank Mike Remple for discussions on design of original experimental paradigm. This work was supported by the National Institutes of Health (NIH R01 NS052407-01 and NS44375, AWR), DOD-MFEL Program (DOD/AFOSR F49620-01-1-4029, DJ, AMJ), and the Human Frontiers Science Program (DJ, AMJ).
Footnotes
Publisher's Disclaimer: This is a PDF file of an unedited manuscript that has been accepted for publication. As a service to our customers we are providing this early version of the manuscript. The manuscript will undergo copyediting, typesetting, and review of the resulting proof before it is published in its final citable form. Please note that during the production process errors may be discovered which could affect the content, and all legal disclaimers that apply to the journal pertain.
Works Cited
- Agmon A, Connors BW. Thalamocortical responses of mouse somatosensory (barrel) cortex in vitro. Neuroscience. 1991;41:365–379. doi: 10.1016/0306-4522(91)90333-j. [DOI] [PubMed] [Google Scholar]
- Blanton MG, Lo Turco JJ, Kriegstein AR. Whole cell recording from neurons in slices of reptilian and mammalian cerebral cortex. Journal of Neuroscience Methods. 1989;30:203–210. doi: 10.1016/0165-0270(89)90131-3. [DOI] [PubMed] [Google Scholar]
- Bouchard MB, Chen BR, Burgess SA, Hillman EMC. Ultra-fast multispectral optical imaging of cortical oxygenation, blood flow, and intracellular calcium dynamics. Opt Express. 2009;17:15670–15678. doi: 10.1364/OE.17.015670. [DOI] [PMC free article] [PubMed] [Google Scholar]
- Bowser DN, Khakh BS. ATP Excites Interneurons and Astrocytes to Increase Synaptic Inhibition in Neuronal Networks. J Neurosci. 2004;24:8606–8620. doi: 10.1523/JNEUROSCI.2660-04.2004. [DOI] [PMC free article] [PubMed] [Google Scholar]
- Cayce JM, Kao CC, Malphrus JD, Konrad PE, Mahadevan-Jansen A, Jansen ED. Infrared Neural Stimulation of Thalamocortical Brain Slices. Selected Topics in Quantum Electronics, IEEE Journal of. 2010;16:565–572. [Google Scholar]
- Chapin JK, Lin CS. Mapping the body representation in the SI cortex of anesthetized and awake rats. J Comp Neurol. 1984;229:199–213. doi: 10.1002/cne.902290206. [DOI] [PubMed] [Google Scholar]
- Chen LM, Turner GH, Friedman RM, Zhang N, Gore JC, Roe AW, Avison MJ. High-resolution maps of real and illusory tactile activation in primary somatosensory cortex in individual monkeys with functional magnetic resonance imaging and optical imaging. J Neurosci. 2007;27:9181–9191. doi: 10.1523/JNEUROSCI.1588-07.2007. [DOI] [PMC free article] [PubMed] [Google Scholar]
- Cunha RA. Different cellular sources and different roles of adenosine: A1 receptor-mediated inhibition through astrocytic-driven volume transmission and synapse-restricted A2A receptor-mediated facilitation of plasticity. Neurochemistry International. 2008;52:65–72. doi: 10.1016/j.neuint.2007.06.026. [DOI] [PubMed] [Google Scholar]
- Das A, Gilbert CD. Long-range horizontal connections and their role in cortical reorganization revealed by optical recording of cat primary visual cortex. Nature. 1995;375:780–784. doi: 10.1038/375780a0. [DOI] [PubMed] [Google Scholar]
- Derdikman D, Hildesheim R, Ahissar E, Arieli A, Grinvald A. Imaging spatiotemporal dynamics of surround inhibition in the barrels somatosensory cortex. J Neurosci. 2003;23:3100–3105. doi: 10.1523/JNEUROSCI.23-08-03100.2003. [DOI] [PMC free article] [PubMed] [Google Scholar]
- Duke AR, Cayce JM, Malphrus JD, Konrad P, Mahadevan-Jansen A, Jansen ED. Combined optical and electrical stimulation of neural tissue in vivo. Journal of Biomedical Optics. 2009;14:060501–060503. doi: 10.1117/1.3257230. [DOI] [PMC free article] [PubMed] [Google Scholar]
- Dunn AK, Devor A, Dale AM, Boas DA. Spatial extent of oxygen metabolism and hemodynamic changes during functional activation of the rat somatosensory cortex. Neuroimage. 2005;27:279–290. doi: 10.1016/j.neuroimage.2005.04.024. [DOI] [PubMed] [Google Scholar]
- Feng H-J, Kao C, Gallagher MJ, Jansen ED, Mahadevan-Jansen A, Konrad P, Macdonal RL. Alteration of GABAergic Neurotransmission by Pulsed Infrared Laser Stimulation. Journal of Neuroscience Methods. 2010 doi: 10.1016/j.jneumeth.2010.07.014. (in press) [DOI] [PMC free article] [PubMed] [Google Scholar]
- Fried NM, Lagoda GA, Scott NJ, Su LM, Burnett AL. Noncontact Stimulation of the Cavernous Nerves in the Rat Prostate Using a Tunable-Wavelength Thulium Fiber Laser. Journal of Endourology. 2008;22:409–414. doi: 10.1089/end.2008.9996. [DOI] [PubMed] [Google Scholar]
- Fritsch G, Hitzig E. Ueber die elektrische Erregbarkeit der Grosshirns. Archiv Anatomie, Physiologie, und Wissenschaftlische Medicin. 1870;37:300–332. [Google Scholar]
- Galvani Bon Sci Art Inst Acad Comm. 1791:363–418. [Google Scholar]
- van Gemert MJC, Welch AJ. Approximate solutions for heat conduction: time constants. In: Welch AJ, van Gemert MJC, editors. Optical-Thermal Response of Laser-Irradiated Tissue. Plenum Press; New York: 1995. [Google Scholar]
- Ghose GM. Attentional modulation of visual responses by flexible input gain. J Neurophysiol. 2009;101:2089–2106. doi: 10.1152/jn.90654.2008. [DOI] [PMC free article] [PubMed] [Google Scholar]
- Grinvald A. Real-Time Optical Mapping of Neuronal Activity: From Single Growth Cones to the Intact Mammalian Brain. Annual Review of Neuroscience. 1985;8:263–305. doi: 10.1146/annurev.ne.08.030185.001403. [DOI] [PubMed] [Google Scholar]
- Grinvald A, Lieke EE, Frostig RD, Hildesheim R. Cortical point-spread function and long-range lateral interactions revealed by real-time optical imaging of macaque monkey primary visual cortex. J Neurosci. 1994;14:2545–2568. doi: 10.1523/JNEUROSCI.14-05-02545.1994. [DOI] [PMC free article] [PubMed] [Google Scholar]
- Hale GM, Querry MR. Optical Constants of Water in the 200-nm to 200-μm Wavelength Region. Appl Opt. 1973;12:555–563. doi: 10.1364/AO.12.000555. [DOI] [PubMed] [Google Scholar]
- Helmstaedter M, Staiger JF, Sakmann B, Feldmeyer D. Efficient Recruitment of Layer 2/3 Interneurons by Layer 4 Input in Single Columns of Rat Somatosensory Cortex. J Neurosci. 2008;28:8273–8284. doi: 10.1523/JNEUROSCI.5701-07.2008. [DOI] [PMC free article] [PubMed] [Google Scholar]
- Hillman EMC. Optical brain imaging in vivo: techniques and applications from animal to man. Journal of Biomedical Optics. 2007;12:051402–051428. doi: 10.1117/1.2789693. [DOI] [PMC free article] [PubMed] [Google Scholar]
- Izzo AD, Richter CP, Jansen ED, Joseph T, Walsh J. Laser stimulation of the auditory nerve. Lasers in Surgery and Medicine. 2006;38:745–753. doi: 10.1002/lsm.20358. [DOI] [PubMed] [Google Scholar]
- Izzo AD, Walsh JT, Ralph H, Webb J, Bendett M, Wells J, Richter C-P. Laser stimulation of auditory neurons: effect of shorter pulse duration and penetration depth. Biophys J. 2008 doi: 10.1529/biophysj.107.117150. biophysj.107.117150. [DOI] [PMC free article] [PubMed] [Google Scholar]
- Jenkins MW, Duke AR, GuS DoughmanY, Chiel HJ, FujiokaH WatanabeM, Jansen ED, Rollins AM. Optical pacing of the embryonic heart. Nat Photon. 2010;4:623–626. doi: 10.1038/nphoton.2010.166. [DOI] [PMC free article] [PubMed] [Google Scholar]
- Jones M, Berwick J, Johnston D, Mayhew J. Concurrent Optical Imaging Spectroscopy and Laser-Doppler Flowmetry: The Relationship between Blood Flow, Oxygenation, and Volume in Rodent Barrel Cortex. Neuroimage. 2001;13:1002–1015. doi: 10.1006/nimg.2001.0808. [DOI] [PubMed] [Google Scholar]
- Kao CQ, Coulter DA. Physiology and pharmacology of corticothalamic stimulation-evoked responses in rat somatosensory thalamic neurons in vitro. J Neurophysiol. 1997;77:2661–2676. doi: 10.1152/jn.1997.77.5.2661. [DOI] [PubMed] [Google Scholar]
- Koizumi S, Fujishita K, Tsuda M, Shigemoto-Mogami Y, Inoue K. Dynamic inhibition of excitatory synaptic transmission by astrocyte-derived ATP in hippocampal cultures. Proceedings of the National Academy of Sciences of the United States of America. 2003;100:11023–11028. doi: 10.1073/pnas.1834448100. [DOI] [PMC free article] [PubMed] [Google Scholar]
- Kozlov AS, Angulo MC, Audinat E, Charpak S. Target cell-specific modulation of neuronal activity by astrocytes. Proceedings of the National Academy of Sciences. 2006;103:10058–10063. doi: 10.1073/pnas.0603741103. [DOI] [PMC free article] [PubMed] [Google Scholar]
- Levitt JB, Lund JS. Contrast dependence of contextual effects in primate visual cortex. Nature. 1997;387:73–76. doi: 10.1038/387073a0. [DOI] [PubMed] [Google Scholar]
- Paxinos G, Watson C. The rat brain in stereotaxic coordinates/George Paxinos, Charles Watson. Elsevier; Amsterdam: 2007. [Google Scholar]
- Perea G, Navarrete M, Araque A. Tripartite synapses: astrocytes process and control synaptic information. Trends in Neurosciences. 2009;32:421–431. doi: 10.1016/j.tins.2009.05.001. [DOI] [PubMed] [Google Scholar]
- Petersen CCH. The Functional Organization of the Barrel Cortex. Neuron. 2007;56:339–355. doi: 10.1016/j.neuron.2007.09.017. [DOI] [PubMed] [Google Scholar]
- Rajguru SM, Matic AI, Robinson AM, Fishman AJ, Moreno LE, Bradley A, Vujanovic I, Breen J, Wells JD, Bendett M, Richter C-P. Optical cochlear implants: Evaluation of surgical approach and laser parameters in cats. Hearing Research. 2010a doi: 10.1016/j.heares.2010.06.021. In Press, Corrected Proof. [DOI] [PMC free article] [PubMed] [Google Scholar]
- Rajguru SM, Matic AI, Robinson AM, Fishman AJ, Moreno LE, Bradley A, Vujanovic I, Breen J, Wells JD, Bendett M, Richter C-P. Optical cochlear implants: Evaluation of surgical approach and laser parameters in cats. Hearing Research. 2010b doi: 10.1016/j.heares.2010.06.021. In Press, Uncorrected Proof. [DOI] [PMC free article] [PubMed] [Google Scholar]
- Richter CP, Matic A, Wells J, Jansen E, Walsh J. Neural stimulation with optical radiation. Laser & Photonics Reviews. 2010:n/a–n/a. doi: 10.1002/lpor.200900044. [DOI] [PMC free article] [PubMed] [Google Scholar]
- Roe AW. Long-term optical imaging of intrinsic signals in anesthetized and awake monkeys. Appl Opt. 2007;46:1872–1880. doi: 10.1364/ao.46.001872. [DOI] [PubMed] [Google Scholar]
- Roux FE, Tremoulet M. Organization of language areas in bilingual patients: a cortical stimulation study. J Neurosurg. 2002;97:857–864. doi: 10.3171/jns.2002.97.4.0857. [DOI] [PubMed] [Google Scholar]
- Schummers J, Yu H, Sur M. Tuned Responses of Astrocytes and Their Influence on Hemodynamic Signals in the Visual Cortex. Science. 2008;320:1638–1643. doi: 10.1126/science.1156120. [DOI] [PubMed] [Google Scholar]
- Simons DJ, Carvell GE. Thalamocortical response transformation in the rat vibrissa/barrel system. J Neurophysiol. 1989;61:311–330. doi: 10.1152/jn.1989.61.2.311. [DOI] [PubMed] [Google Scholar]
- Starr PA, Christine CW, Theodosopoulos PV, Lindsey N, Byrd D, Mosley A, Marks WJ., Jr Implantation of deep brain stimulators into the subthalamic nucleus: technical approach and magnetic resonance imaging-verified lead locations. J Neurosurg. 2002;97:370–387. doi: 10.3171/jns.2002.97.2.0370. [DOI] [PubMed] [Google Scholar]
- Takano T, Tian GF, Peng W, Lou N, Libionka W, Han X, Nedergaard M. Astrocyte-mediated control of cerebral blood flow. Nat Neurosci. 2006;9:260–267. doi: 10.1038/nn1623. [DOI] [PubMed] [Google Scholar]
- Takata N, Hirase H. Cortical layer 1 and layer 2/3 astrocytes exhibit distinct calcium dynamics in vivo. PLoS ONE. 2008;3:e2525. doi: 10.1371/journal.pone.0002525. [DOI] [PMC free article] [PubMed] [Google Scholar]
- Teudt IU, Nevel AE, Izzo AD, Walsh JT, Jr, Richter CP. Optical stimulation of the facial nerve: a new monitoring technique? Laryngoscope. 2007;117:1641–1647. doi: 10.1097/MLG.0b013e318074ec00. [DOI] [PMC free article] [PubMed] [Google Scholar]
- Toth LJ, Rao SC, Kim DS, Somers D, Sur M. Subthreshold facilitation and suppression in primary visual cortex revealed by intrinsic signal imaging. Proceedings of the National Academy of Sciences of the United States of America. 1996;93:9869–9874. doi: 10.1073/pnas.93.18.9869. [DOI] [PMC free article] [PubMed] [Google Scholar]
- Ts’o DY, Frostig RD, Lieke EE, Grinvald A. Functional organization of primate visual cortex revealed by high resolution optical imaging. Science. 1990;249:417–420. doi: 10.1126/science.2165630. [DOI] [PubMed] [Google Scholar]
- Tsytsarev V, Pope D, Pumbo E, Garver W. Intrinsic optical imaging of directional selectivity in rat barrel cortex: Application of a multidirectional magnetic whisker stimulator. Journal of Neuroscience Methods. 2010;189:80–83. doi: 10.1016/j.jneumeth.2010.03.010. [DOI] [PubMed] [Google Scholar]
- Vanzetta I, Hildesheim R, Grinvald A. Compartment-Resolved Imaging of Activity-Dependent Dynamics of Cortical Blood Volume and Oximetry. J Neurosci. 2005;25:2233–2244. doi: 10.1523/JNEUROSCI.3032-04.2005. [DOI] [PMC free article] [PubMed] [Google Scholar]
- Wang X, Lou N, Xu Q, Tian GF, Peng WG, Han X, Kang J, Takano T, Nedergaard M. Astrocytic Ca2+ signaling evoked by sensory stimulation in vivo. Nat Neurosci. 2006;9:816–823. doi: 10.1038/nn1703. [DOI] [PubMed] [Google Scholar]
- Wells J, Kao C, Jansen ED, Konrad P, Mahadevan-Jansen A. Application of infrared light for in vivo neural stimulation. J Biomed Opt. 2005a;10:064003. doi: 10.1117/1.2121772. [DOI] [PubMed] [Google Scholar]
- Wells J, Kao C, Konrad P, Milner T, Kim J, Mahadevan-Jansen A, Jansen ED. Biophysical mechanisms of transient optical stimulation of peripheral nerve. Biophys J. 2007a;93:2567–2580. doi: 10.1529/biophysj.107.104786. [DOI] [PMC free article] [PubMed] [Google Scholar]
- Wells J, Kao C, Mariappan K, Albea J, Jansen ED, Konrad P, Mahadevan-Jansen A. Optical stimulation of neural tissue in vivo. Opt Lett. 2005b;30:504–506. doi: 10.1364/ol.30.000504. [DOI] [PubMed] [Google Scholar]
- Wells J, Konrad P, Kao C, Jansen ED, Mahadevan-Jansen A. Pulsed laser versus electrical energy for peripheral nerve stimulation. J Neurosci Methods. 2007b;163:326–337. doi: 10.1016/j.jneumeth.2007.03.016. [DOI] [PMC free article] [PubMed] [Google Scholar]
- Wininger FA, Schei JL, Rector DM. Complete optical neurophysiology: toward optical stimulation and recording of neural tissue. Appl Opt. 2009;48:D218–D224. doi: 10.1364/ao.48.00d218. [DOI] [PMC free article] [PubMed] [Google Scholar]
Associated Data
This section collects any data citations, data availability statements, or supplementary materials included in this article.
Supplementary Materials
01