DNA breaks and chromosome pulverization from errors in mitosis (original) (raw)
. Author manuscript; available in PMC: 2012 Aug 2.
Published in final edited form as: Nature. 2012 Jan 18;482(7383):53–58. doi: 10.1038/nature10802
Abstract
Whether whole-chromosome aneuploidy promotes tumorigenesis has been controversial, in large part because of the paucity of insight into underlying mechanisms. Here we identify a mechanism by which mitotic chromosome segregation errors generate DNA breaks via the formation of structures called micronuclei. Whole chromosome-containing micronuclei form when mitotic errors produce lagging chromosomes. We tracked the fate of newly generated micronuclei and found that they undergo defective and asynchronous DNA replication, resulting in DNA damage and frequently pulverization of the chromosome in the micronucleus. Micronuclei can persist in cells over several generations but the chromosome in the micronucleus can also be distributed to daughter nuclei. Thus, chromosome segregation errors potentially lead to mutations and chromosome rearrangements that can integrate into the genome. Pulverization of chromosomes in micronuclei may also be one explanation for “chromothripsis” in cancer and developmental disorders, where isolated chromosomes or chromosome arms undergo massive local DNA breakage and rearrangement.
Whole chromosome aneuploidy is a major feature of cancer genomes, yet its role in tumour development remains controversial1,2. This contrasts with chromosome breaks and rearrangements, which are known to produce cancer-causing mutations. Recent genetic evidence demonstrates that increased rates of whole chromosome missegregation can accelerate oncogenesis3-6; however, the only established mechanism by which whole chromosome segregation errors promote tumourigenesis is by facilitating the loss of heterozygosity for tumour suppressors7. Intriguingly, two animal models where whole chromosome segregation errors result in robust tumour development also display extensive structural alterations in chromosomes6,8. This raises the interesting question of whether errors in mitosis can predispose to DNA damage. We considered the possibility that segregation of chromosomes into micronuclei (MN) might produce DNA damage. Whole chromosome containing MN form from anaphase lagging chromosomes9-13; MN can also be generated from acentric fragments of chromosomes11. MN have many features of primary nuclei, but much controversy surrounds their actual composition and functional properties. Studies differ on whether MN are transcriptionally active, replicate DNA, mount a normal DNA damage response, or assemble normal nuclear envelopes; moreover, the ultimate fate of chromosomes trapped within MN remains unclear11,14,15.
DNA damage in micronuclei
To determine if newly formed whole-chromosome MN develop DNA damage, we generated MN in synchronised cells and tracked them through the cell cycle. As a first synchronisation approach, MN were generated in non-transformed RPE-1 and transformed U2OS cells by release from nocodazole-induced microtubule depolymerisation. When mitotic cells are released from nocodazole, spindles reassemble abnormally, producing merotelic kinetochore attachments (one kinetochore attached to two opposite spindle poles), lagging chromosomes, and ~10% of cells with MN16. Because prolonged mitotic arrest causes DNA damage17,18,19, RPE-1 cells were arrested for a short (6 h) interval with nocodazole. Following release from the 6 h nocodazole block, neither the primary nuclei nor the newly-formed kinetochore-positive MN exhibited significant DNA damage during the subsequent G1 phase as measured by damage-dependent phosphorylation of the histone variant H2AX20 (γ-H2AX foci formation; Fig. 1a-c, Supplementary Fig. 2a-f), TUNEL labelling to detect DNA breaks21 (Fig. 1d, Supplementary Fig. 2e,f) and visualization of DNA breaks with the comet assay22 (Supplementary Fig. 3d,e).
Figure 1. Micronuclei from lagging chromosome develop DNA breaks.

a, Schematic of the experiment. b, Representative images of micronucleated G1 (6h), S (16h), G2 (22h) and irradiated RPE-1 cells (IR) labelled for DNA (blue), centromeres (ACA, red), and γ-H2AX (green). Insets show enlarged images of micronuclei (MN). Scale bars, 10 μM. c-d, Percentage of primary nuclei (PN, blue bars) and centric MN (red bars) with (c) γ-H2AX foci and (d) TUNEL labelling (3 experiments, n=100). Errors bars, s.e.m.
Because aneuploidy can produce a p53-dependent G1 cell cycle arrest23,24, p53 was silenced by RNAi to allow us to monitor the fate of micronucleated RPE-1 cells at later stages of the cell cycle. As expected, upon S-phase entry, low-level DNA damage was detected in both the MN and the primary nucleus25; however, in G2 phase cells, the majority of MN showed DNA damage while almost none was detected in the primary nucleus (Fig. 1a-d). Similar results were observed in U2OS cells (Supplementary Fig. 3) and in cells where merotelic kinetochore-microtubule attachments were generated by knockdown of the kinetochore-associated microtubule depolymerase MCAK26 or the kinetochore protein Nuf227 (Supplementary Fig. 4a-c). MCAK knockdown does not delay cells in mitosis, demonstrating that the acquisition of DNA damage in MN is independent of mitotic arrest17,18,19. This damage did not represent activation of apoptosis because it was not accompanied by caspase-3 activation, and it was not suppressed by a pan-caspase inhibitor (Supplementary Fig. 5).
As a completely independent method of generating MN, we utilized a human cell line (HT1080) carrying a human artificial chromosome (HAC) with a kinetochore that could be conditionally inactivated28. In this system, kinetochore assembly on the HAC is blocked simply by washout of doxycycline from the medium; consequently, the HAC is unable to attach to the mitotic spindle and is left behind at anaphase, ultimately reforming as a MN (Fig. 2a). Results obtained with the HAC-containing MN (Fig. 2b-d) were in agreement with the results obtained by the other synchronization methods described above. Taken together, MN do not exhibit significant DNA damage during G1 but a large fraction of MN acquire DNA damage during S-phase that persists into G2.
Figure 2. DNA breaks in a human artificial chromosome targeted to a micronucleus.

a, (Right) Schematic. (Left) Fluorescence in situ hybridisation images of HAC (red) in a primary nucleus (+Dox) or MN (-Dox). b, Images of micronucleated cells as in Fig. 1b (enlarged and brightened in insets). Scale bars, 10 μM c-d, Percentage of primary nuclei (blue bars) and centric MN (red bars) with (c) γ-H2AX foci and (d) TUNEL labelling. (3 experiments, n=100). Errors bars, s.e.m.
Defective DNA replication in micronuclei
To directly determine whether acquisition of DNA damage in MN requires DNA replication, synchronized micronucleated cells were released into medium containing thymidine to block DNA replication. Blocking DNA replication with thymidine abolished the acquisition of DNA damage (Fig. 3a-c), demonstrating that the breaks in MN occur in a replication-dependent manner.
Figure 3. DNA damage in micronuclei results from aberrant DNA replication.
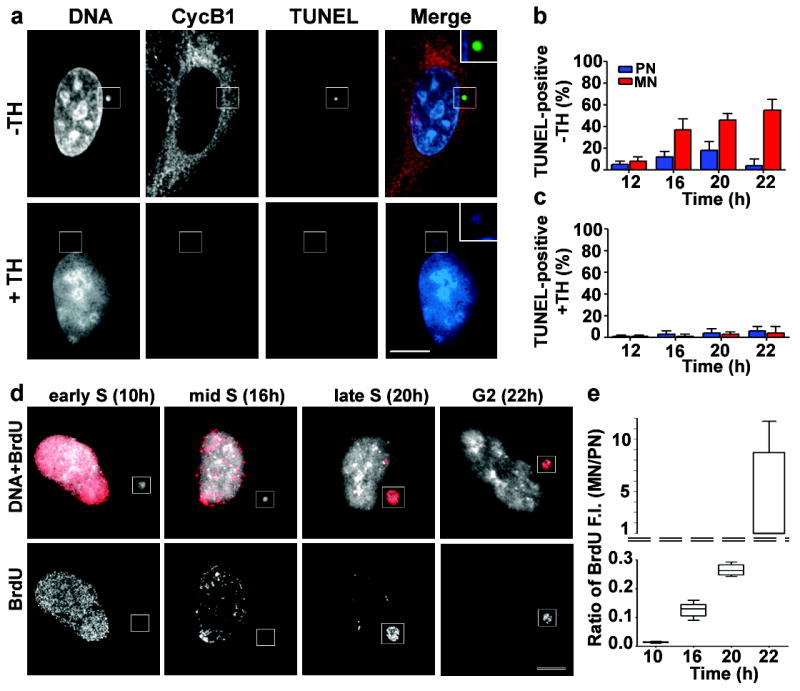
a-c, DNA replication requirement for acquisition of DNA damage in MN. a, RPE-1 cells were synchronized as in Fig. 1a and released into media with (+TH) or without (-TH) 2 mM thymidine. Cells were co-labelled for TUNEL (green) and cyclin B1 (red). Shown are images from 22 h sample. Scale bar, 10 μM. b,c, Percentage of TUNEL-positive primary nuclei (blue bars) and MN (red bars) (b) with or (c) without thymidine treatment. (3 experiments, n=100). Errors bars, s.e.m. d, Inefficient and asynchronous DNA replication in MN. RPE-1 cells as in Fig. 1a were pulse-labelled with BrdU and labelled: DNA (white) and BrdU (red). e, The ratio of BrdU incorporation in MN relative to primary nuclei after a 30 min pulse label. Normalized fluorescence intensity (F.I.) measurements are as shown in the box and whisker plots (2 experiments, n=50).
We next tested whether the acquisition of DNA damage in MN is mediated by aberrant DNA replication. This possibility was suggested because MN in G2 cells that had γ-H2AX foci, almost always also labelled for phosphorylated RPA2 (Ser33)29, a marker of DNA replication stress (Supplementary Fig. 4d). Moreover, the characteristic BrdU labelling patterns of early, mid, and late S-phase cells30 suggested that DNA replication in MN is inefficient and asynchronous with the primary nucleus (Fig. 3d). By measuring the fluorescence intensity of BrdU relative to DNA area from single focal plane confocal images, DNA replication in MN was detected at a markedly reduced level throughout S-phase when compared to the primary nuclei (Fig. 3e). Interestingly, pulse-labelling with BrdU demonstrated asynchronous DNA replication of the MN relative to the primary nucleus, with ~30% of MN replicating DNA in G2 cells (22 h; Fig. 3d).
The compromised DNA replication observed in newly-formed MN led us to test whether complexes necessary to license DNA replication origins are recruited to chromosomes in MN. The first step in assembling replication origins is the loading of the origin recognition complex (ORC) after chromosome decondensation during telophase31. Quantitative fluorescence imaging suggested that ORC recruitment is equally efficient in the MN as in the primary nucleus (Supplementary Fig. 6a). By contrast, newly-generated MN showed significant reduction in the recruitment of replicative DNA helicase components, Mcm2 and Mcm332,33 as well as the replication initiation factor Cdt131 (Fig. 4a,b, Supplementary Fig. 6b,c). We observed an increased recruitment of MCM subunits into MN as cells progressed through the cell cycle, but the levels of MCM subunits never exceeded 20% of that observed in the primary nucleus (Fig. 4b).
Figure 4. Defective MCM2-7 complex recruitment, DNA damage response and nucleocytoplasmic transport in MN.

a, Impaired Mcm2 recruitment into MN. G1 RPE-1 cells were synchronized as in Fig. 1a and stained for chromatin-bound Mcm2 and DNA. Scale bar, 10 μM. b, Relative Mcm2 fluorescence intensity (F.I.) as in Fig. 3e. Approximate cell cycle stage of timepoints: 6h, G1; 10h, early S-phase; 16h, mid-S phase and 20h, late S-phase. (2 experiments, n=50). c,d, Micronuclei are partially defective for nuclear import of NFATc1-EGFP. c, Representative images of micronucleated U2OS cells stably expressing NFATc1-EGFP in G1 and G2 with or without treatment with 0.2 μM thapsigargin for 10 min. d, Ratio of NFATc1-EGFP fluorescence intensity between MN and primary nuclei. (3 experiments, n=30).
To examine whether the DNA damage response in MN was also abnormal, cells were treated with replication inhibitor, aphidicolin, or exposed to 2 Gy irradiation, to induce damage and then labelled to detect components of the DNA damage response. After aphidicolin treatment, MN showed clear signal for γ-H2AX and its kinase ATR (ataxia telangectasia mutated-related) but downstream constituents of the DNA damage response such as 53BP1 were not efficiently recruited, as previously reported34 (Supplementary Fig. 7). A similar defect in the recruitment of DNA damage response factors into micronuclei was also observed after irradiation (Supplementary Fig. 8a). This recruitment defect had clear consequences for DNA damage repair: whereas γ-H2AX foci were resolved in primary nuclei by 6 h after 2 Gy irradiation, γ-H2AX foci persisted in MN for > 24 h (Supplementary Fig. 8b). The failure of MN to recruit MCM subunits and components of the DNA repair machinery may be due, at least in part, to a defect in nucleocytoplasmic transport. Newly-formed MN have a marked reduction in the density of nuclear pores11,14,15 (Supplementary Fig. 9) and exhibit strongly reduced nuclear import (Fig. 4c-d, Supplementary Fig. 10).
Micronuclei and chromosome pulverization
Next we tested the prediction that abnormal DNA replication in MN could generate chromosome breaks. Chromosome spreads were prepared from non-transformed cells in the first cell cycle after release from nocodazole or from DMSO-treated controls (Fig. 5a-f, Supplementary Fig. 11a). Strikingly, 7.6% of chromosome spreads prepared from micronucleated cells released from nocodazole block (n=722) exhibited chromosomes with a “pulverized” appearance, characterized by fragments of DAPI-staining material that were often clustered into a discrete location on the spread35 (see yellow arrows in Fig. 5a, i; Supplementary Fig. 11b). By contrast, pulverization was exceedingly rare (0.14%) in controls. Multicolor fluorescence chromosome painting (SKY) confirmed that 34 of 47 spreads with “pulverized” chromosomes were composed of fragments from a single chromosome and another eight were from two chromosomes (Fig. 5a-i; Supplementary Fig. 11). Despite this striking disruption to chromosomal structure, only one cell harboured non-reciprocal chromosome translocations 24 h after nocodazole release (n=101) whereas no translocations were observed in control cells (data not shown). 72 h after nocodazole release (n=100), we still did not detect chromosome translocations, but did detect truncated or derivative single chromosomes in three cells. Although our experiments show that whole chromosome mis-segregation does not produce frequent nonreciprocal translocations, we do not exclude the possibility that the DNA damage acquired in MN could result in translocations, albeit at a frequency lower than ~1/100 per generation.
Figure 5. The fate of chromosomes in micronuclei.

MN were induced in RPE-1 cells as described in Fig. 1a (after p53 knockdown) and chromosome spreads were prepared 24 h after nocodazole release. a-c, Pulverization of chromosome 1 demonstrated by (a) DAPI staining (chromosome fragments, brightened in inset, yellow arrrows), (b) SKY probes (pseudo-colored), and (c) aligned SKY karyotype. d-f, Pulverization of chromosome 16, viewed as in (a-c). g, A BrdU positive MN-containing G2 RPE-1 cell. 2 h BrdU pulse label, DNA: white, BrdU: red. h, Selective BrdU labelling of a pulverized chromosome. i, The percentage of cells with intact MN (blue bars) or pulverized chromosomes, PC (red bars) from control or nocodazole-released (NOC) RPE-1 cells. Interphase is 18 h sample and metaphase is 24 h. j, Images from live-cell experiment showing a pre-converted green-fluorescent MN (white arrows) photo-converted to a red-fluorescent MN (yellow arrows) imaged through mitosis. Following anaphase, MN either reincorporated with the primary nucleus or failed to reincorporate and reformed as MN top row: reincorporation of MN into primary nucleus; bottom row: no reincorporation. Time shown is hr:min.
Chromosome pulverization has been observed in cell-fusion experiments where chromosomes from an S-phase cell are pulverized because of exposure to signals from mitotic cytoplasm36. It has also been observed when aberrant late-replicating chromosome translocations are generated37. The mechanism of pulverization involves compaction of partially replicated chromosomes induced by mitotic cyclin-dependent kinase activity, termed premature chromosome compaction (PCC)35,38,39. By labelling micronucleated and control cells for 2 h with BrdU immediately prior to chromosome condensation and mitotic arrest, we found that 25/30 pulverized chromosomes were undergoing DNA replication (Fig. 5h). The fact that only MN incorporate BrdU in G2 cells (Fig. 3d, Fig. 5g) demonstrates that the pulverized chromosomes are derived from MN.
The fate of chromosomes in micronuclei
We next addressed the potential for chromosome aberrations acquired in MN to be reincorporated into the genome. We used long-term live-cell imaging to determine the fate of spontaneously arising or experimentally induced MN in a variety of cell lines (Supplementary Table 1). Imaging analysis revealed that the vast majority of MN (525/541; 97%) are stably maintained during interphase. Although MN may be extruded in some cells11, extrusion was not detected in our imaging experiments. Furthermore, MN were not visibly degraded11, did not co-localize with lysosomes (Supplementary Fig. 12), and did not appear to fuse with the primary nucleus. By contrast, our experiments suggested that after nuclear envelope breakdown some MN might join the other mitotic chromosomes and be distributed to daughter nuclei. Of the 331 micronucleated cells that were tracked as they underwent cell division, 16% (53/331) gave rise to daughters that lacked MN (Supplementary Table 1, Supplementary Movies 1 and 2).
To directly test whether MN reincorporate during mitosis, we generated a U2OS cell line stably expressing H2B fused to the photoconvertible fluorescent protein Kaede40, which converts from green to red fluorescence emission after UV illumination. This enabled us to selectively photoactivate and subsequently track a single chromosome encapsulated in a MN throughout mitosis (Fig. 5j, Supplementary Movies 3 and 4). This experiment demonstrated that chromosomes within MN reincorporate into daughter nuclei at a significant frequency (11/29; 38%). The remaining MN persisted in cells well into the second generation.
Discussion
Together, our findings suggest a novel mechanism by which whole chromosome segregation errors can cause chromosome breaks and potentially cancer-causing mutations. Mitotic errors can lead to lagging chromosomes which in turn can be partitioned into MN13. This can produce DNA damage in two ways. First, DNA damage can result as a direct consequence of aberrant DNA replication, potentially due to a reduced density of replication origins. Second, chromosome pulverization due to premature chromosome compaction can occur if a micronucleated cell enters mitosis with MN still undergoing DNA replication. This may not be the only mechanism by which whole chromosome mis-segregation can cause DNA damage, as it was recently proposed that lagging chromosomes can be damaged by the cytokinetic furrow41. In contrast to previous studies that have suggested that most MN are inactive, discarded or degraded11, we find that MN persist over several generations but that the chromosomes within the MN can be segregated at a significant frequency into daughter cell nuclei. Thus, DNA rearrangements and mutations acquired in MN could be incorporated into the genome of a developing cancer cell.
Our experiments suggest a mechanism that could explain the recently discovered phenomenon of chromothripsis42,43. Chromothripsis was discovered by cancer genome sequencing and DNA copy number analysis42. It is defined by small-scale DNA copy number changes and extensive intrachromosomal rearrangements that are restricted to a single chromosome or chromosome arm. Two non-exclusive models have been proposed for chromothripsis: (1) fragmentation of a chromosome followed by stitching together of the resulting fragments by non-homologous end joining42 and (2) aberrant DNA replication resulting in fork stalling and template switching or microhomology-mediated break-induced replication43,44. Partitioning of a chromosome into a spatially isolated MN can explain why a single chromosome would be subject to aberrant DNA replication and can explain how extensive DNA damage can be restricted to a single chromosome. Because MN may persist as discrete entities over multiple generations, damage to the chromosome need not occur all at once42,43, but could accrue from multiple failed attempts at DNA replication. Chromothripsis restricted to a chromosome arm could be generated from acentric chromosome fragments, since chromosome pulverization was previously correlated with the presence of MN in cancer cell lines after DNA damage35,45. Although chromothripsis appears to be relatively rare, DNA damage in MN could be more common. We suggest that chromothripisis may be an extreme outcome of a mutagenesis mechanism that could be widespread in human cancer.
Methods Summary
All cell lines were maintained at 37°C with 5% CO2 atmosphere. To generate MN, cells were treated with nocodazole (100 ng ml-1) for 6 h followed by mitotic shake-off and nocodazole washout. Alternatively, MN were generated by depletion of MCAK or Nuf2 by siRNA. MN were also generated in HT1080 cells by inactivation of the kinetochore of the human artificial chromosome by washout of doxycycline. Detailed descriptions of immunofluorescence, RNAi, BrdU labelling, comet assays, inactivation of the human artificial chromosomes (HAC), flow cytometry, quantitative analysis of nuclear import, chromosome spreads, spectral karyotyping, antibodies used, photoconversion of H2B-Kaede and long-term live-cell imaging experiments can be found in Full Methods.
Full Methods
Cell Culture
All cell lines were maintained at 37°C with 5% CO2 atmosphere in DMEM (U20S, HT1080), DMEM:F12 (hTERT RPE-l), or DMEM:F12 medium without phenol red (H2B-GFP and H2B-mRFP U2OS, H2B-GFP and H2B-mRFP RPE-1, H2B-GFP Caco2, H2B-GFP SCC-114, H2B-GFP HeLa, H2B-mRFP MDA-231). All media was supplemented with 10% FBS, 100 IUml-1 penicillin and 100 μg ml-1 streptomycin. HT1080 cells bearing the alphoidtetO human artificial chromosome and expressing the tetracycline repressor TetR fused to the transcriptional silencer tTS (a gift from Vladimir Larionov) were also supplemented with 1 μg ml-1 doxycycline (Sigma), 0.5 mg ml-1 G418 (geneticin, Invitrogen) and 4 μg ml-1 blasticidin S (Invitrogen). U2OS cells stably expressing human NFATc1 fused to the C-terminus of EGFP (Thermo Scientific; R04-017-01) were supplemented with 0.5 mg/ml G418.
Generation of Whole-Chromosome Micronuclei
To generate cells with whole-chromosome MN, hTERT RPE-1 and U2OS cells were treated with 100 ng ml-1 nocodazole (Sigma) for 6 h. Mitotic cells were collected, washed twice with fresh medium containing 10% FBS, and then plated into medium containing 20% FBS where they completed cell division. To overcome the aneuploidy-induced p53-dependent G1 arrest associated with nocodazole washout experiments, RPE-1 cells were transfected with 50 nmol p53 siRNA (Smartpool, Dharmacon) using Lipofectamine RNAi Max (Invitrogen) 12 h prior to the nocodazole treatment, enabling cell cycle progression of the subsequent aneuploid daughter cells with MN. For Nuf2 and MCAK knockdown, U2OS cells were serum starved for two days prior to transfection with 50 nmol Nuf2 or MCAK siRNAs (Smartpool, Dharmacon). Cells were then washed in fresh medium containing 10% FBS and 24 h later treated with 4 μM dihydrocytochalasin B (DCB; Sigma) for 16 h to inhibit cytokinesis. The subsequent arrested tetraploid cells depleted of Nuf2 or MCAK (many of which harbored MN) were then treated for 6 h with 10 μM SB203580 (Sigma), a p38 inhibitor that promotes cell cycle progression of tetraploids. Sequence information of the small interference RNA (siRNA) pools used from Dharmacon are as follows: Human TP53 ON-TARGETplus SMARTpool siRNA L-003329-00-0005, (J-003329-14) GAAAUUUGCGUGUGGAGUA, (J-003329-15) GUGCAGCUGUGGGUUGAUU, (J-003329-16) GCAGUCAGAUCCUAGCGUC, (J-003329-17) GGAGAAUAUUUCACCCUUC; Human KIF2C/MCAK ON-TARGETplus SMARTpool siRNA L-004955-00-0005, (J-004955-06) GGCAUAAGCUCCUGUGAAU, (J-004955-07) CCAACGCAGUAAUGGUUUA, (J-004955-08) GCAAGCAACAGGUGCAAGU, (J-004955-09) UGACUGAUCCUAUCGAAGA; Human CDCA1/NUF2 ON-TARGETplus SMARTpool siRNA L-005289-00-0005, J-005289-06 GAACGAGUAACCACAAUUA, J-005289-07 UAGCUGAGAUUGUGAUUCA, J-005289-08 GGAUUGCAAUAAAGUUCAA, J-005289-09 AAACGAUAGUGCUGCAAGA.
Generation of Micronuclei Containing the Human Artificial Chromosome (HAC)
HT1080 cells carrying the HAC were cultured in doxycycline-free medium and treated with 100 ng ml -1 nocodazole for 6 h to synchronize cells in mitosis. The absence of doxycycline enables TetR binding to TetO, which induces inactivation of the HAC centromere by tTS and the subsequent formation of a MN following release from mitotic arrest. Cells released from mitotic arrest were synchronized at G0/G1 by serum starvation for 24 h, then released into the cell cycle with fresh medium containing 10% serum for further analysis.
Flow Cytometry
Cells were fixed with 70% ethanol at 4° C followed by incubation with 250 μg ml -1 RNase A and 10 μg ml -1 propidium iodide at 37 °C for 30 min. FACS analysis was performed with a FACScalibur flow cytometer (Becton Dickinson) and data analysed with CellQuest software.
Indirect Immunofluorescence Microscopy
For most experiments, cells were seeded on glass coverslips, washed in CSK buffer (10 mM PIPES, 100 mM NaCl, 300 mM sucrose, 3mM MgCl2), pre-extracted with CSK buffer containing 0.5% Triton X-100 for 5 min at 4° C, and fixed in PBS containing 4% paraformaldehyde for 15 min. After fixation, cells were permeabilised in PBS-0.2% Triton X-100 for 5 min, blocked in blocking buffer (PBS containing 5% FBS, 2% BSA and 0.1% Triton X-100) for 30 min, and then incubated with primary antibodies at room temperature for 1 h or overnight at 4° C. Cells were washed with PBS-0.1% Triton X-100 and incubated with fluorescence-conjugated secondary antibodies (1:1000, Molecular Probes) at room temperature for 1 h. Cells were also stained for DNA with Hoechst 33342 (1:5000, Invitrogen) in PBS. More specific immunostaining protocols were as follows: for γ-H2AX and other DNA damage response proteins56; for ELYS and mAb41457; for Cyclin B1/γ- H2AX/BrdU58 and for Mcm2, Cdt1 and Orc259. Images for most experiments were collected with a Yokogawa CSU-22 spinning disk confocal mounted on a Zeiss Axiovert microscope using 488, 561 and 640 nm laser light. A series of 0.3 μm optical sections were acquired using a 100X 1.4 NA Plan Apo objective with an Orca ER CCD camera (Hamamatsu Photonics). For nuclear pore quantitation, images were collected on a Leica SP5 laser scanning confocal microscope with a 405 nm laser and a white light laser tuned to 488 nm, 568 nm, and 647 nm using a 63X 1.4 NA Plan Apo objective. Z-stacks were collected with a 0.3 μm step size with pinhole at 1 Airy unit. Photomultipliers were calibrated to ensure linear range. For quantitation of Mcm2 and BrdU signals, mean fluorescence intensity within the primary nuclei or micronuclei was measured using ImageJ software. For quantitation of γ-H2AX, primary nuclei were classified as positive when five or more foci were detected, with the threshold of foci intensity set against the irradiated sample. The same threshold was applied to score γ-H2AX foci in MN. Acquisition parameters, shutters, filter positions and focus were controlled by Slidebook software (Intelligent Imaging Innovations, Denver, CO). Images presented in figures are maximum intensity projections of entire _z_-stacks, unless otherwise stated.
Antibodies for Immunofluorescence
Samples were incubated with primary antibodies for human anti-centromere ACA (1:1000; Antibodies, Inc.), rabbit γ-H2AX-Ser139 (1:500, Cell Signaling), mouse γ-H2AX (clone JBW301, 1:500, Upstate), rabbit 53BP1 (1:500, Cell Signaling), rabbit phospho-53BP1-Ser1778 (1:500, Cell Signaling), rabbit phospho-Chk1-Ser317 (1:500, Cell Signaling), rabbit phospho-ATM-Ser1981 (1:500, Cell Signaling), rabbit ATR (1:500, Cell Signaling), rabbit Mre11 (1:300, Abcam), rabbit Rad51 (1:100, Santa Cruz), mouse Brca1 (1:300, Santa Cruz), mouse RPA2 (1:500; Abcam), rabbit phospho-RPA2-S33 (1:500, Bethyl Laboratories), Mcm2 and Orc2 (1:300, gifts from Bruce Stillman), rabbit Cdt1 (1:500, Bethyl Laboratories), rabbit geminin (1:500; Santa Cruz), mouse mab414 (1:5000, Abcam), ELYS/MEL28 (1:1000, gift from Iain Mattaj), mouse Lamin A/C (1:300, Abcam), rabbit cyclin A (1:300; Santa Cruz), rabbit cyclin B1 (1:500; Santa Cruz), rabbit cyclin D1 (1:300; Santa Cruz) and mouse BrdU (Sigma). Secondary antibodies used were Alexa Fluor 488 (green), 594 (red) and 647 (far red) from Molecular Probes.
TUNEL Assay
Terminal deoxynucleotidyl-transferase-mediated dUTP-nick end-labelling (TUNEL) was performed according to the manufacturer’s instructions (In Situ cell death detection kit, Roche).
BrdU Labelling
Cells were pre-labelled with 10 μM BrdU for 30 min and subsequently fixed and permeabilised according to the manufacturers’ conditions (5-Bromo-2-deoxyuridine Labelling and Detection Kit 1, Roche). Cells were then stained with anti-BrdU (1h, diluted 1:300) and processed for IF. In the box and whiskers plot, the box represents upper and lower quartiles, line within box represents median and the whiskers extend to the highest and lowest value data sets.
Long-term live-cell imaging
Labelled cells were grown on glass-bottom 12-well tissue culture dishes (Mattek) and imaged on either a Nikon TE2000-E2 or Nikon Ti-E inverted microscope. Both microscopes were equipped with a cooled CCD camera (TE2000, Orca ER, Hamamatsu; Ti-E, Coolsnap HQ2, Photometrics), a precision motorized stage (Bioprecision, Ludl), and Nikon Perfect Focus, and both were enclosed within temperature and CO2-controlled environments that maintained an atmosphere of 37° C and 3-5% humidified CO2. GFP or RFP images were captured at multiple points every 5-10 minutes for 3-5 days with either 10X (0.3 NA) or 20X (0.5, 0.75 NA) objectives, and exposure to fluorescent light was minimized to the greatest extent possible (all image acquisition utilized neutral density filters and/or 2×2 binning). Cell viability was confirmed by the continuous observation of mitotic cells throughout the duration of experiments. Captured images from each experiment were analyzed using NIS-Elements software.
Imaging of H2B-Kaede
Tandem repeats of Kaede (a kind gift of Atsushi Miyawaki, RIKEN Institute) were fused to H2B and cloned into the pLenti6/V5 lentiviral vector (Invitrogen). A U2OS cell line stably expressing H2B-Kaede was generated by lentiviral infection followed by repeated FACS sorting of GFP-positive cells. For tracking experiments, pre-converted micronuclei (GFP-positive) were identified and photoconverted with a brief (1-3s) pulse of 350-400 nm UV light from a DAPI filter cube. Micronuclei that efficiently converted (RFP-positive) were subsequently imaged through the completion of the following mitosis using the same microscope setup as described above. Images were acquired every 10 minutes with a 20X objective and 2×2 binning.
Chromosome Spreads/Spectral Karyotyping
RPE-1 cells were treated with p53 siRNA (as previously described) for 16 h and then grown in medium supplemented with nocodazole (100 ng ml-1) or vehicle control (DMSO) for 6 h. Mitotic cells were collected by shake-off, washed thoroughly in fresh medium without nocodazole, and re-plated in culture medium with 20% FBS to complete mitosis. FACS analysis demonstrated that the subsequent daughter cells progressed to S/G2-phase 18-20 h post-release. At this point, interphase samples were collected and fixed in order to observe the fraction of cells containing MN. In parallel, 100 ng ml-1 colcemid (Invitrogen) was added to the DMSO or nocodazole-treated cells for an additional 6 h and then fixed. All samples were similarly processed for fixation: cells were pelleted and resuspended in a hypotonic solution of 0.075 M KCL for 18 min, fixed in Carnoy’s fixative (3:1 methanol:glacial acetic acid) and washed four times with Carnoy’s fixative. All fixed samples were spread on slides for staining or hybridisation. Mitotic samples were stained with Giemsa or Hoechst to visualize chromosomal abnormalities. Spectral karyotyping (SKY) was performed on interphase and mitotic samples (from both DMSO and nocodazole treated samples) according to the SkyPaint™ DNA kit H-5 for human chromosomes procedure (Applied Spectral Imaging, SKY000029) and imaged on a Nikon Eclipse E6000 microscope equipped with the SD300 Spectracube and Spectral Imaging acquisition software. To determine if pulverized chromosomes were derived from late-replicating chromosomes in MN, the above procedure was also performed with addition of BrdU labeling reagent (Roche Applied Science) only in the last two hours of colcemid treatment before fixation. Mitotic samples from the BrdU samples were treated according to the 5-Bromo-2’-deoxy-uridine Labeling and Detection Kit I protocol (Roche Applied Science, 11296736001), except that the anti-BrdU antibody was diluted 1:50.
Single Cell Gel Electrophoresis (Comet) Assay
Single cell comet assays were performed according to the manufacturer’s instructions (Trevigen). Briefly, U2OS cells were harvested at G1, S and G2 phases of the cell cycle after nocodazole washout was used to induce MN. As controls, G1 cells were irradiated at 10 Gy. Cells were resuspended in cold PBS at 2×10⁵ cells ml-1, mixed with low-melt agarose (1:10 ratio) and spread on frosted glass slides. After the agarose solidified, the slides were sequentially placed in lysis and alkaline solutions (Trevigen). Slides were then subjected to electrophoresis at 12 V for 10 min in 1x TBE buffer, fixed with 70% ethanol, and stained with DAPI (4’,6-diamidino-2-phenylindole). Nuclei were visualized using epifluorescent illumination on a Zeiss microscope and images were analyzed with the NIH Image J program. DNA damage was quantified for 50 cells with MN for each experimental condition by determining the tail DNA percentage using Comet Score (TriTek) software.
Quantitative Analysis of Nuclear Pore Complexes (NPCs)
To determine nuclear pore complex density in primary nuclei and MN, cells were pre-extracted, fixed, permeabilised and immunostained with mAb414 and ELYS antibodies. Confocal images were collected on a Leica SP5 laser scanning confocal with both a 405 nm and white light laser (at 488nm and 568nm) using a 63X Plan Apo 1.4 NA oil objective. Z-stacks were collected with a 0.3 μm step size with pinhole at 1 Airy unit. Photomultipliers were calibrated to ensure linear range. Single layers of the Z-stack showing optimal nuclear pore staining for the primary nucleus and the MN were chosen for quantitative analysis using MetaMorph. The areas of primary nuclei and MN were judged from Hoechst staining and used to determine the perinuclear rim area. Total fluorescence intensity of mAb414 and ELYS was measured in the perinuclear rim area. To compare nuclear pore densities between primary nuclei and MN, the total nuclear pore fluorescence was divided by the perinuclear rim area of primary nuclei and MN, resulting in an average intensity ratio.
Nuclear Import
To measure nuclear import, we used U2OS cells stably expressing the fusion protein NFATc1-EGFP (Thermo-Fisher Scientific). The inactive transcription factor NFATc1 resides in the cytosol. Elevated calcium levels in the cytosol lead to the dephosphorylation of NFATc1 by calcineurin thereby inducing its rapid translocation into the nucleus. To increase the calcium level in the cytoplasm, U2OS cells released from nocodazole washout were treated with 0.2 μM thapsigargin, an inhibitor of the sarco-endoplasmic reticulum Ca2+ ATPase. Nuclear import of NFATc1 was then measured in the primary nuclei and MN of U2OS cells at both 6 h and 20 h after nocodazole release. Cells were subsequently fixed with 2% paraformaldehyde and import was quantified based on nuclear fluorescence. To measure nuclear import of IBB-DiHcRed60, U2OS cells were transiently transfected with the IBB-DiHcRed-plasmid (gift from Jan Ellenberg) using Lipofectamine 2000 (Invitrogen). Cells were then synchronized for 10 h with nocodazole, washed as previously described, and released into the cell cycle. Cells were fixed with 2% paraformaldehyde both 6 h and 20 h later, and import was quantified based on nuclear fluorescence.
Supplementary Material
1
2
Acknowledgments
We thank A. D’Andrea, M.E. McLaughlin, T.A. Rapoport, J. Walters and Pellman Lab members for discussions and/or helpful comments on the manuscript; L. Cameron for advice and help on microscopy, H. Li for irradiation of cells; M. Nitta, M. Hennessy for preliminary experiments and V. Larionov, B. Stillman, J. Ellenberg, I. Mattaj, A. Miyawaki and T. Kuroda for reagents. DP was supported by the Howard Hughes Medical Institute and the NIH (GM083299), KC was a fellow of A*STAR Singapore, NG was a fellow of the Leukemia and Lymphoma Society, YP and DC were funded by the NIH (1R01CA142698-01).
Footnotes
Author Contributions. DP conceived of the project; KC, NG, RD, AL, DC and DP designed the experiments, DP, KC and NG wrote the manuscript with edits from all authors; KC contributed Figs. 1-3, 4a-b and Figs. S2-8 with help from RD. NG contributed Fig. 5j, Fig. S12, Table S1 and the movies. RD, EI, AP contributed Fig. 5a-i, Fig. S1 and S11; AL contributed Fig. 4c-d and Figs. S9-10; YP and DC contributed Fig. S3d, LN contributed Fig. 2a.
Supplementary Information is linked to the online version of the paper at www.nature.com/nature.
The authors declare no competing financial interests.
References
- 1.Gordon DJ, Resio B, Pellman D. Causes and consequences of aneuploidy in cancer. Nat Rev Genet. doi: 10.1038/nrg3123. In Press. [DOI] [PubMed] [Google Scholar]
- 2.Weaver BA, Cleveland DW. Aneuploidy: instigator and inhibitor of tumorigenesis. Cancer Res. 2007;67:10103–10105. doi: 10.1158/0008-5472.CAN-07-2266. [DOI] [PMC free article] [PubMed] [Google Scholar]
- 3.Schvartzman JM, Sotillo R, Benezra R. Mitotic chromosomal instability and cancer: mouse modelling of the human disease. Nat Rev Cancer. 2010;10:102–115. doi: 10.1038/nrc2781. [DOI] [PMC free article] [PubMed] [Google Scholar]
- 4.Ricke RM, van Ree JH, van Deursen JM. Whole chromosome instability and cancer: a complex relationship. Trends Genet. 2008;24:457–466. doi: 10.1016/j.tig.2008.07.002. [DOI] [PMC free article] [PubMed] [Google Scholar]
- 5.Weaver BA, Silk AD, Montagna C, Verdier-Pinard P, Cleveland DW. Aneuploidy acts both oncogenically and as a tumor suppressor. Cancer Cell. 2007;11:25–36. doi: 10.1016/j.ccr.2006.12.003. [DOI] [PubMed] [Google Scholar]
- 6.Sotillo R, et al. Mad2 overexpression promotes aneuploidy and tumorigenesis in mice. Cancer Cell. 2007;11:9–23. doi: 10.1016/j.ccr.2006.10.019. [DOI] [PMC free article] [PubMed] [Google Scholar]
- 7.Baker DJ, Jin F, Jeganathan KB, van Deursen JM. Whole chromosome instability caused by Bub1 insufficiency drives tumorigenesis through tumor suppressor gene loss of heterozygosity. Cancer Cell. 2009;16:475–486. doi: 10.1016/j.ccr.2009.10.023. [DOI] [PMC free article] [PubMed] [Google Scholar]
- 8.Fujiwara T, et al. Cytokinesis failure generating tetraploids promotes tumorigenesis in p53-null cells. Nature. 2005;437:1043–1047. doi: 10.1038/nature04217. [DOI] [PubMed] [Google Scholar]
- 9.Cimini D. Merotelic kinetochore orientation, aneuploidy, and cancer. Biochim Biophys Acta. 2008;1786:32–40. doi: 10.1016/j.bbcan.2008.05.003. [DOI] [PubMed] [Google Scholar]
- 10.Ganem NJ, Godinho SA, Pellman D. A mechanism linking extra centrosomes to chromosomal instability. Nature. 2009;460:278–282. doi: 10.1038/nature08136. [DOI] [PMC free article] [PubMed] [Google Scholar]
- 11.Terradas M, Martin M, Tusell L, Genesca A. Genetic activities in micronuclei: is the DNA entrapped in micronuclei lost for the cell? Mutat Res. 2010;705:60–67. doi: 10.1016/j.mrrev.2010.03.004. [DOI] [PubMed] [Google Scholar]
- 12.Gisselsson D, et al. Abnormal nuclear shape in solid tumors reflects mitotic instability. Am J Pathol. 2001;158:199–206. doi: 10.1016/S0002-9440(10)63958-2. [DOI] [PMC free article] [PubMed] [Google Scholar]
- 13.Thompson SL, Compton DA. Chromosome missegregation in human cells arises through specific types of kinetochore-microtubule attachment errors. Proc Natl Acad Sci U S A. 2011;108:17974–17978. doi: 10.1073/pnas.1109720108. [DOI] [PMC free article] [PubMed] [Google Scholar]
- 14.Hoffelder DR, et al. Resolution of anaphase bridges in cancer cells. Chromosoma. 2004;112:389–397. doi: 10.1007/s00412-004-0284-6. [DOI] [PubMed] [Google Scholar]
- 15.Geraud G, et al. Three-dimensional organization of micronuclei induced by colchicine in PtK1 cells. Exp Cell Res. 1989;181:27–39. doi: 10.1016/0014-4827(89)90179-1. [DOI] [PubMed] [Google Scholar]
- 16.Cimini D, et al. Merotelic kinetochore orientation is a major mechanism of aneuploidy in mitotic mammalian tissue cells. J Cell Biol. 2001;153:517–527. doi: 10.1083/jcb.153.3.517. [DOI] [PMC free article] [PubMed] [Google Scholar]
- 17.Dalton WB, Nandan MO, Moore RT, Yang VW. Human cancer cells commonly acquire DNA damage during mitotic arrest. Cancer Res. 2007;67:11487–11492. doi: 10.1158/0008-5472.CAN-07-5162. [DOI] [PMC free article] [PubMed] [Google Scholar]
- 18.Quignon F, et al. Sustained mitotic block elicits DNA breaks: one-step alteration of ploidy and chromosome integrity in mammalian cells. Oncogene. 2007;26:165–172. doi: 10.1038/sj.onc.1209787. [DOI] [PubMed] [Google Scholar]
- 19.Orth JD, Loewer A, Lahav G, Mitchison TJ. Prolonged mitotic arrest induces partial activation of apoptosis, DNA damage and p53 activation. Mol Biol Cell. doi: 10.1091/mbc.E11-09-0781. In Press. [DOI] [PMC free article] [PubMed] [Google Scholar]
- 20.Rogakou EP, Pilch DR, Orr AH, Ivanova VS, Bonner WM. DNA double-stranded breaks induce histone H2AX phosphorylation on serine 139. J Biol Chem. 1998;273:5858–5868. doi: 10.1074/jbc.273.10.5858. [DOI] [PubMed] [Google Scholar]
- 21.Gavrieli Y, Sherman Y, Ben-Sasson SA. Identification of programmed cell death in situ via specific labeling of nuclear DNA fragmentation. J Cell Biol. 1992;119:493–501. doi: 10.1083/jcb.119.3.493. [DOI] [PMC free article] [PubMed] [Google Scholar]
- 22.Singh NP, McCoy MT, Tice RR, Schneider EL. A simple technique for quantitation of low levels of DNA damage in individual cells. Exp Cell Res. 1988;175:184–191. doi: 10.1016/0014-4827(88)90265-0. [DOI] [PubMed] [Google Scholar]
- 23.Thompson SL, Compton DA. Proliferation of aneuploid human cells is limited by a p53-dependent mechanism. J Cell Biol. 2010;188:369–381. doi: 10.1083/jcb.200905057. [DOI] [PMC free article] [PubMed] [Google Scholar]
- 24.Li M, et al. The ATM-p53 pathway suppresses aneuploidy-induced tumorigenesis. Proc Natl Acad Sci U S A. 2010;107:14188–14193. doi: 10.1073/pnas.1005960107. [DOI] [PMC free article] [PubMed] [Google Scholar]
- 25.Branzei D, Foiani M. Maintaining genome stability at the replication fork. Nat Rev Mol Cell Biol. 2010;11:208–219. doi: 10.1038/nrm2852. [DOI] [PubMed] [Google Scholar]
- 26.Kline-Smith SL, Khodjakov A, Hergert P, Walczak CE. Depletion of centromeric MCAK leads to chromosome congression and segregation defects due to improper kinetochore attachments. Mol Biol Cell. 2004;15:1146–1159. doi: 10.1091/mbc.E03-08-0581. [DOI] [PMC free article] [PubMed] [Google Scholar]
- 27.DeLuca JG, Moree B, Hickey JM, Kilmartin JV, Salmon ED. hNuf2 inhibition blocks stable kinetochore-microtubule attachment and induces mitotic cell death in HeLa cells. J Cell Biol. 2002;159:549–555. doi: 10.1083/jcb.200208159. [DOI] [PMC free article] [PubMed] [Google Scholar]
- 28.Nakano M, et al. Inactivation of a human kinetochore by specific targeting of chromatin modifiers. Dev Cell. 2008;14:507–522. doi: 10.1016/j.devcel.2008.02.001. [DOI] [PMC free article] [PubMed] [Google Scholar]
- 29.Binz SK, Sheehan AM, Wold MS. Replication protein A phosphorylation and the cellular response to DNA damage. DNA Repair (Amst) 2004;3:1015–1024. doi: 10.1016/j.dnarep.2004.03.028. [DOI] [PubMed] [Google Scholar]
- 30.O’Keefe RT, Henderson SC, Spector DL. Dynamic organization of DNA replication in mammalian cell nuclei: spatially and temporally defined replication of chromosome-specific alpha-satellite DNA sequences. J Cell Biol. 1992;116:1095–1110. doi: 10.1083/jcb.116.5.1095. [DOI] [PMC free article] [PubMed] [Google Scholar]
- 31.DePamphilis ML, Bell SD. Genome duplication. Garland Science; 2011. [Google Scholar]
- 32.Dimitrova DS, Prokhorova TA, Blow JJ, Todorov IT, Gilbert DM. Mammalian nuclei become licensed for DNA replication during late telophase. J Cell Sci. 2002;115:51–59. doi: 10.1242/jcs.115.1.51. [DOI] [PMC free article] [PubMed] [Google Scholar]
- 33.Mendez J, Stillman B. Chromatin association of human origin recognition complex, cdc6, and minichromosome maintenance proteins during the cell cycle: assembly of prereplication complexes in late mitosis. Mol Cell Biol. 2000;20:8602–8612. doi: 10.1128/mcb.20.22.8602-8612.2000. [DOI] [PMC free article] [PubMed] [Google Scholar]
- 34.Terradas M, Martin M, Tusell L, Genesca A. DNA lesions sequestered in micronuclei induce a local defective-damage response. DNA Repair (Amst) 2009;8:1225–1234. doi: 10.1016/j.dnarep.2009.07.004. [DOI] [PubMed] [Google Scholar]
- 35.Obe G, Beek B, Vaidya VG. The human leukocyte test system. III. Premature chromosome condensation from chemically and x-ray induced micronuclei. Mutat Res. 1975;27:89–101. [PubMed] [Google Scholar]
- 36.Johnson RT, Rao PN. Mammalian cell fusion: induction of premature chromosome condensation in interphase nuclei. Nature. 1970;226:717–722. doi: 10.1038/226717a0. [DOI] [PubMed] [Google Scholar]
- 37.Smith L, Plug A, Thayer M. Delayed replication timing leads to delayed mitotic chromosome condensation and chromosomal instability of chromosome translocations. Proc Natl Acad Sci U S A. 2001;98:13300–13305. doi: 10.1073/pnas.241355098. [DOI] [PMC free article] [PubMed] [Google Scholar]
- 38.Nichols WW, Levan A, Aula P, Norrby E. Chromosome damage associated with the measles virus in vitro. Hereditas. 1965;54:101–118. doi: 10.1111/j.1601-5223.1965.tb02008.x. [DOI] [PubMed] [Google Scholar]
- 39.Kato H, Sandberg AA. Chromosome pulverization in human binucleate cells following colcemid treatment. J Cell Biol. 1967;34:35–45. doi: 10.1083/jcb.34.1.35. [DOI] [PMC free article] [PubMed] [Google Scholar]
- 40.Ando R, Hama H, Yamamoto-Hino M, Mizuno H, Miyawaki A. An optical marker based on the UV-induced green-to-red photoconversion of a fluorescent protein. Proc Natl Acad Sci U S A. 2002;99:12651–12656. doi: 10.1073/pnas.202320599. [DOI] [PMC free article] [PubMed] [Google Scholar]
- 41.Janssen A, van der Burg M, Szuhai K, Kops GJ, Medema RH. Chromosome segregation errors as a cause of DNA damage and structural chromosome aberrations. Science. 2011;333:1895–1898. doi: 10.1126/science.1210214. [DOI] [PubMed] [Google Scholar]
- 42.Stephens PJ, et al. Massive genomic rearrangement acquired in a single catastrophic event during cancer development. Cell. 2011;144:27–40. doi: 10.1016/j.cell.2010.11.055. [DOI] [PMC free article] [PubMed] [Google Scholar]
- 43.Liu P, et al. Chromosome catastrophes involve replication mechanisms generating complex genomic rearrangements. Cell. 2011;146:889–903. doi: 10.1016/j.cell.2011.07.042. [DOI] [PMC free article] [PubMed] [Google Scholar]
- 44.Hastings PJ, Lupski JR, Rosenberg SM, Ira G. Mechanisms of change in gene copy number. Nat Rev Genet. 2009;10:551–564. doi: 10.1038/nrg2593. [DOI] [PMC free article] [PubMed] [Google Scholar]
- 45.Sen S, Hittelman WN, Teeter LD, Kuo MT. Model for the formation of double minutes from prematurely condensed chromosomes of replicating micronuclei in drug-treated Chinese hamster ovary cells undergoing DNA amplification. Cancer Res. 1989;49:6731–6737. [PubMed] [Google Scholar]
- 56.Bekker-Jensen S, et al. Spatial organization of the mammalian genome surveillance machinery in response to DNA strand breaks. J Cell Biol. 2006;173:195–206. doi: 10.1083/jcb.200510130. [DOI] [PMC free article] [PubMed] [Google Scholar]
- 57.Franz C, et al. MEL-28/ELYS is required for the recruitment of nucleoporins to chromatin and postmitotic nuclear pore complex assembly. EMBO Rep. 2007;8:165–172. doi: 10.1038/sj.embor.7400889. [DOI] [PMC free article] [PubMed] [Google Scholar]
- 58.Peterson-Roth E, Reynolds M, Quievryn G, Zhitkovich A. Mismatch repair proteins are activators of toxic responses to chromium-DNA damage. Mol Cell Biol. 2005;25:3596–3607. doi: 10.1128/MCB.25.9.3596-3607.2005. [DOI] [PMC free article] [PubMed] [Google Scholar]
- 59.Prasanth SG, Mendez J, Prasanth KV, Stillman B. Dynamics of pre-replication complex proteins during the cell division cycle. Philos Trans R Soc Lond B Biol Sci. 2004;359:7–16. doi: 10.1098/rstb.2003.1360. [DOI] [PMC free article] [PubMed] [Google Scholar]
- 60.Dultz E, et al. Systematic kinetic analysis of mitotic dis- and reassembly of the nuclear pore in living cells. J Cell Biol. 2008;180:857–865. doi: 10.1083/jcb.200707026. [DOI] [PMC free article] [PubMed] [Google Scholar]
Associated Data
This section collects any data citations, data availability statements, or supplementary materials included in this article.
Supplementary Materials
1
2