Critical Analysis of Rhinovirus RNA Load Quantification by Real-Time Reverse Transcription-PCR (original) (raw)
Abstract
Rhinoviruses are the most frequent cause of human respiratory infections, and quantitative rhinovirus diagnostic tools are needed for clinical investigations. Although results obtained by real-time reverse-transcription PCR (RT-PCR) assays are frequently converted to viral RNA loads, this presents several limitations regarding accurate virus RNA quantification, particularly given the need to reliably quantify all known rhinovirus genotypes with a single assay. Using an internal extraction control and serial dilutions of an _in vitro_-transcribed rhinovirus RNA reference standard, we validated a quantitative one-step real-time PCR assay. We then used chimeric rhinovirus genomes with 5′-untranslated regions (5′UTRs) originating from the three rhinovirus species and from one enterovirus to estimate the impact of the 5′UTR diversity. Respiratory specimens from infected patients were then also analyzed. The assay quantification ability ranged from 4.10 to 9.10 log RNA copies/ml, with an estimated error margin of ±10%. This variation was mainly linked to target variability and interassay variability. Taken together, our results indicate that our assay can reliably estimate rhinovirus RNA load, provided that the appropriate error margin is used. In contrast, due to the lack of a universal rhinovirus RNA standard and the variability related to sample collection procedures, accurate absolute rhinovirus RNA quantification in respiratory specimens is currently hardly feasible.
INTRODUCTION
Human rhinoviruses (HRVs) are small nonenveloped viruses containing a positive-strand RNA genome. They belong to the Enterovirus genus, which is part of the Picornaviridae family. HRVs are important human pathogens and the most frequent cause of respiratory infections. Their tropism is not restricted to the upper respiratory tract, and they can cause complications in the lower respiratory tract, especially in children, the elderly, and immunocompromised patients (5–7, 15, 16). Many HRVs, in particular those belonging to the newly discovered HRV-C species, do not grow under traditional cell culture conditions. Therefore, molecular diagnostic tools, such as real-time reverse transcription-PCR (RT-PCR), are the methods of choice for diagnosing HRVs.
Thanks to numerous clinical studies, data have been gathered regarding implication of HRV in the exacerbation of underlying diseases, such as cystic fibrosis, asthma, and chronic obstructive pulmonary disease (1, 3, 7, 8, 10, 17, 18, 20, 21, 25), as well as concerning the possible impact of a given HRV species on disease severity (9, 11–13, 23). However, there are inconsistent data about whether viral load is correlated with disease severity, and the threshold cycle (CT) values from real-time RT-PCR are converted too frequently into viral copies per milliliter without any validation. This is particularly important because many published assays include primers with degenerate nucleotides or probe sequences that are biased toward a given genotype or species (4, 14, 22, 24).
We validated previously a two-step real-time RT-PCR assay, named Panenterhino/Ge/08, which could detect all known HRV genotypes and, to a lesser extent, human respiratory enteroviruses (HEVs) (22). In this study, we first validated the Panenterhino/Ge/08 assay in a one-step quantitative format using an internal extraction control and serial dilutions of an _in vitro_-transcribed rhinovirus RNA reference standard. HRV-positive clinical specimens were then quantified with this assay, and the results were compared to those obtained with the two-step Panenterhino/Ge/08 real-time RT-PCR. Interassay reproducibility was analyzed, and the level of imprecision linked to the use of a single real-time RT-PCR assay to detect the whole HRV group consisting of genetically variable types was experimentally investigated. Other sources of inaccuracy and imprecision occurring in the HRV RNA quantification process are discussed.
MATERIALS AND METHODS
Plasmids.
The plasmids QCpR16.11 and pWR3.26-HRV-14 encode the full-length genomes of the HRV-A16 and the HRV-B14 strains, respectively, and were kindly provided by W.-M. Lee (University of Wisconsin). The HRV-Ca/A16, HRV-B37/A16, and HEV-A71/A16 plasmids encode chimeric viral genomes in which the 5′-untranslated region (5′UTR) of the HRV-A16 is replaced with the 5′UTR of an HRV-Ca, HRV-B37, or HEV-A71 strain, respectively, and were constructed as previously described (19).
Production and quantification of in vitro RNA transcripts.
For each construct, 5 to 10 μg of plasmid was linearized at a unique SacI restriction site downstream of the 3′-viral poly(A) tail. The MEGAscript T7 kit (Ambion) was used to synthesize RNA transcripts from the linear templates for 3 h at 37°C. The transcripts were then purified with the RNeasy minikit (Qiagen). _In vitro_-transcribed RNAs were quantified by measuring the optical density (see below), diluted to 1 μg/μl, and checked by 0.1% sodium dodecyl sulfate–1% agarose gel analysis. The transcripts were diluted into the NucliSens easyMAG extraction buffer 3 (bioMérieux). The weight of one RNA molecule in grams was determined using the mean nucleotide molecular weight and the number of nucleotides per RNA molecule.
Patient cohorts and clinical specimens.
Nasopharyngeal swab (NPS) and bronchoalveolar lavage (BAL) specimens were obtained from patients enrolled in a cohort of lung transplant recipients (September 2008 to November 2010). These respiratory specimens were screened using the Panenterhino/Ge/08 two-step assay, and stored positive samples were reanalyzed for viral load quantification. This study was approved by the institutional review board and the ethics committee of the University of Geneva Hospitals. Written informed consent was obtained from all individuals.
To test the linearity of the assay in clinical samples, an NPS specimen and a BAL specimen with high HRV RNA load were selected; they were diluted 10-fold into a pool of HRV-negative NPS and BAL specimens, respectively, and into Universal transport medium (UTM; Copan).
Primers and hydrolysis probes.
The two-step Panenterhino/Ge/08 and canine distemper virus (CDV) real-time RT-PCR assays were performed as previously described (2, 22). For CDV one-step real-time RT-PCRs, the primers and hydrolysis probe were used at final concentrations of 0.9 μM and 0.5 μM, respectively. The HRV-A16-specific two-step real-time RT-PCR assay (HRV-A16 3D), designed to amplify nucleotides (nt) 6903 to 6970 in the 3D gene of the HRV-A16 genome (GenBank accession no. L24917), was used as previously described (19).
The human glyceraldehyde-3-phosphate dehydrogenase (GAPDH) endogenous control (VIC/TAMRA [6-carboxytetramethylrhodamine] probe; Primer limited) assay (Applied Biosystems) and the CELL control r-gene kit (Argene) were used according to the manufacturer's instructions.
Available sequences of primers and hydrolysis probes are listed in Table S1 in the supplemental material.
RNA extraction and real-time RT-PCR.
As an internal control, 10 μl of a homogeneous dilution of a CDV stock was added to each sample before extraction. The RNA was extracted from clinical samples (190 μl of clinical sample) using the NucliSens easyMAG magnetic bead system (bioMérieux) and eluted into 25 μl. Five microliters of the extracted RNA was reverse transcribed with Superscript II (Invitrogen) with random hexamers (Roche) according to the manufacturer's instructions in a reaction volume of 20 μl. Forty microliters of water was added to the RT product to have enough volume to conduct all assays in parallel. Five microliters of diluted cDNA was used for each real-time RT-PCR. For the one-step reactions, the extracted RNA was diluted so as to obtain the same copy number in each real-time RT-PCR format.
For the real-time PCRs, the chimeric plasmids were analyzed with the HRV-A16 3D and Panenterhino/Ge/08 assays, and the reverse-transcribed cDNAs were analyzed with the Panenterhino/Ge/08 and the CDV assays using the TaqMan Universal PCR master mix (Applied Biosystems) in a 7500 or a 7000 Applied Biosystems thermocycler. The following cycling conditions were used: 50°C for 2 min, 95°C for 10 min, and 45 cycles of 95°C for 15 s and 60°C for 1 min.
For one-step real-time PCRs, RNAs were analyzed with the Panenterhino/Ge/08 and CDV assays using the QuantiTect probe RT-PCR kit (Qiagen) according to the manufacturer's instructions in a 7000 Applied Biosystems thermocycler. The following cycling conditions were used: 50°C for 30 min, 95°C for 15 min, and 45 cycles of 94°C for 15 s and 60°C for 1 min. Results were analyzed using the program SDS version 1.4 (Applied Biosystems).
Standard curves and RNA quantification.
To establish a standard curve for the quantitative real-time RT-PCR experiments, we used serial 10-fold dilutions (from 6.25 × 10⁴ to 62.5 copies/reaction) of an _in vitro_-transcribed full-length HRV-A16 RNA that was quantified by optical density. To check the accuracy of RNA quantification by optic density measurements, the amount of _in vitro_-transcribed RNA was measured in triplicate at two different time points separated by a freeze-thaw cycle. The mean values were 5.77 ng/μl (standard deviation [SD], 0.15 ng/μl) for day 1 and 5.73 ng/μl (SD, 0.31 ng/μl) for day 2 (corresponding to 2.00 × 10¹¹ RNA copies/ml and 1.99 × 10¹¹ copies/ml, respectively). To evaluate the linearity of the measurements, the RNA stock was diluted 10-fold within the range of quantification by optical density and measured in triplicate. The first dilution had a mean concentration of 486.57 ng/μl (SD, 80.19 ng/μl), the second 49.80 ng/μl (SD, 0.17 ng/μl), and the third 4.67 ng/μl (SD, 0.51 ng/μl), which correspond to 1.68 × 10¹⁴, 1.72 × 10¹³, and 1.62 × 10¹² RNA copies/ml, respectively.
The RNA of each respiratory specimen used for HRV RNA load quantification was extracted twice at two different time points. Each set of extracted RNA was tested in duplicate with the one-step and two-step Panenterhino/Ge/08 assays and with the internal control CDV assay. The duplicates from the Panenterhino/Ge/08 assay were normalized as follows: the lowest CDV CT value of each run was set as the reference value, and the difference in the CDV CT values between the sample and the reference was subtracted from the value obtained from the Panenterhino/Ge/08 CT assay. The means of the normalized CT values from the real-time RT-PCR duplicates were used to quantify the RNA copy numbers per reaction using the slope-intercept form. The number of RNA copies per reaction was then corrected for the dilution factor performed between the extraction and the real-time RT-PCR (315.79-fold) to obtain a final viral RNA copy number per ml of initial sample (described above).
PCR efficiency (E) was calculated using the formula E = 10−1/slope − 1.
Statistical analysis.
To evaluate the statistical significance of differences in RNA quantification values obtained with the one-step and two-step Panenterhino/Ge/08 assays, P values were determined using the paired t test.
RESULTS
Analytical sensitivity and linear range of the one-step Panenterhino/Ge/08 real-time RT-PCR assay.
The limit of detection (LOD) and the limit of quantification (LOQ) of the one-step Panenterhino/Ge/08 assay were assessed and compared to those obtained with the two-step assay using three 10-fold dilution series of an HRV-A16 RNA transcript. The one-step and two-step reactions were performed in parallel on each diluted RNA. The LOD were 3.10 log copies/ml for the one-step assay and 2.10 log copies/ml for the two-step assay. For both assays, the LOQ was 4.10 log copies/ml, and linearity was conserved from 4.10 to 9.10 log copies/ml. Intra-assay reproducibility was better for the one-step assay (_r_2 = 0.999) than for the two-step assay (_r_2 = 0.987) (Fig. 1A and B).
Fig 1.
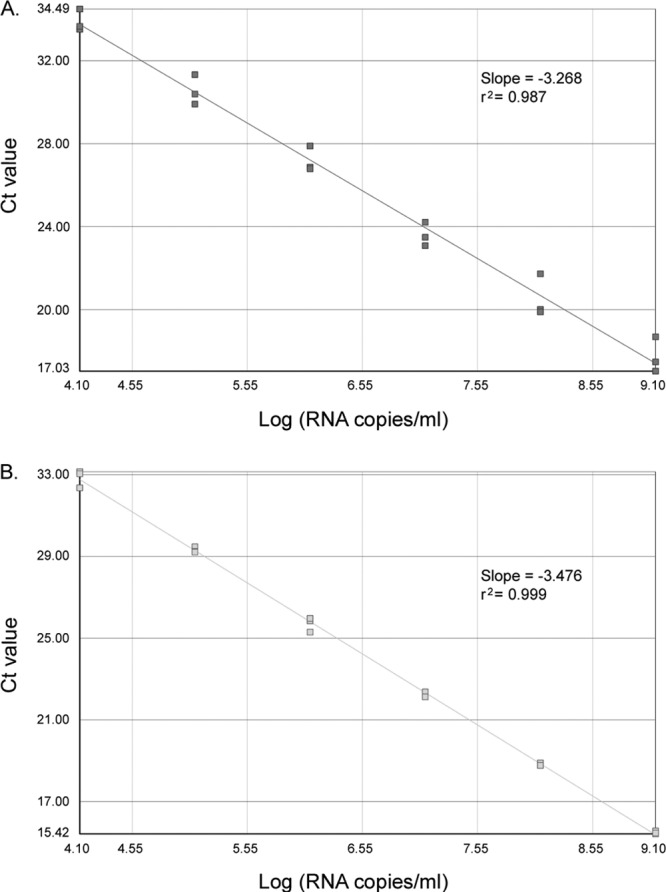
Linearity and variability of the Panenterhino/Ge/08 two-step (A) and one-step (B) real-time RT-PCR on three 10-fold dilution series of _in vitro_-transcribed HRV-A16 RNA (A and B). The standard curves, slopes, and _r_2 values are shown.
The linearity of the one-step Panenterhino/Ge/08 assay on clinical specimens was also analyzed using 10-fold dilution series of a Panenterhino/Ge/08-positive NPS and a Panenterhino/Ge/08-positive BAL specimen. The assay was linear for clinical specimens with CT values between 22 and 34 (_r_2 = 0.988 for the NPS experiment and _r_2 = 0.996 for the BAL experiment). However, the PCR efficiency (E) was lower with these clinical specimens (E = 80.3 to 80.7%) than with the _in vitro_-transcribed RNA (E = 84.9 to 99.1%). Comparable results were obtained when the HRV-positive specimens were diluted into the widely used UTM (data not shown).
Sources of HRV RNA load quantification bias in clinical specimens. (i) Quantification with one-step versus two-step real-time RT-PCR.
The HRV viral RNA load was determined in a collection of 44 NPS and 6 BAL picornavirus-positive specimens using the one- and two-step Panenterhino/Ge/08 assays. The sequences of 22 of the 50 picornavirus-positive specimens were available: 12 were HRV-A members, 1 was an HRV-B member, and 9 were HRV-C members. In each real-time RT-PCR experiment, a four-dilution series of a reference RNA standard of known quantity was included. The RNA load was calculated as described in Materials and Methods. Samples presenting less than 4.10 log copies/ml, and thus below the LOQ, were not included in the quantitative analysis.
The comparison between one-step and two-step Panenterhino/Ge/08 HRV RNA quantifications is illustrated by the Bland-Altman plot presented in Fig. 2, and the raw data are given in Table S2 in the supplemental material. The median viral RNA loads were 5.68 log RNA copies/ml (range, 4.44 to 7.45 log RNA copies/ml) with the one-step assay and 5.83 log RNA copies/ml (range, 4.57 to 7.53 log RNA copies/ml) with the two-step assay. On average, viral loads obtained with the two-step assay were 0.15 log RNA copy/ml (SD, 0.47 log RNA copy/ml) higher than those obtained using the one-step assay (P = 0.026, paired t test). Differences above 0.5 log RNA copy/ml were observed in 36% of the samples and within all viral RNA levels. The mean percent coefficient of variation (% CV) related to one-step versus two-step HRV RNA quantification was 4.9% (range, 0.3 to 13.0%).
Fig 2.
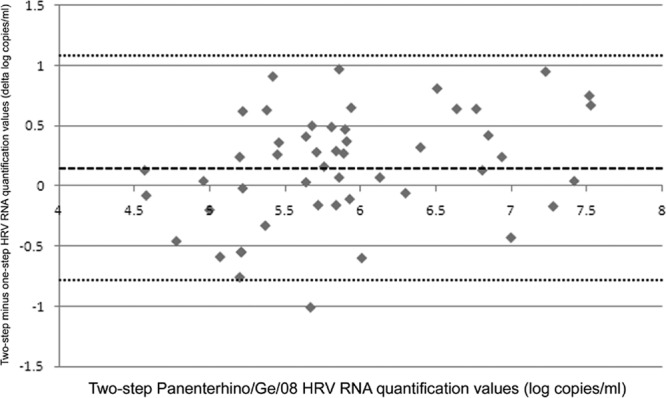
One-step Panenterhino/Ge/08 HRV RNA quantification values compared to two-step Panenterhino/Ge/08 HRV RNA quantification values. A Bland-Altman plot shows the distribution of HRV RNA quantification values in log copies/ml, compared to the values obtained with the two-step assay. Two-step HRV quantification values are represented on the x axis. Differences in quantification values between the one-step and two-step assays in log copies/ml are represented on the y axis. The dashed line represents the mean difference of log copies/ml between both assays (two-step assay = one-step assay + 0.15 log), and the dotted lines represent the mean difference of log copies/ml between both assays + 2 SD (1.09) and − 2 SD (−0.79), respectively. Raw data are available in Table S2 in the supplemental material.
(ii) Interassay variability.
Interassay quantification reproducibility was evaluated using 12 HRV-positive respiratory samples with viral loads ranging from 4.4 to 7.6 log RNA copies/ml and processed by two different laboratory technicians. For each specimen, two biological replicates were performed from RNA extraction to one-step or two-step real-time RT-PCR. The mean % CV of the log RNA copies/ml was 2.1% (range, 0.3 to 3.8%) for the one-step and 6.8% (range, 1.3 to 14.0% for the two-step assay) (see Fig. 4 and see Table S3 in the supplemental material).
Fig 4.
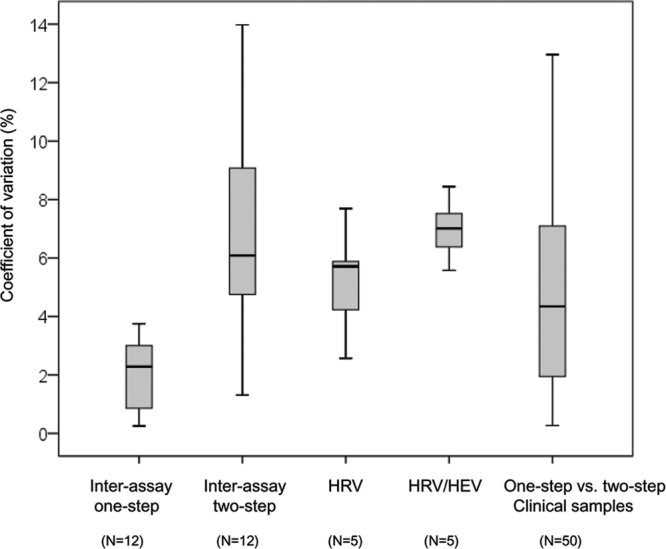
Putative sources of real-time RT-PCR viral load quantification variation. Box plots show the variation of viral load quantification (% CV) related to interassay variability (one-step and two-step assays), HRV genetic variability, HRV/HEV genetic variability, and one-step assay versus two-step assay variability.
(iii) Sample heterogeneity.
For the same 12 samples, the GAPDH endogenous transcript control assay and the CELL control r-gene assay, which amplify, respectively, the mRNA and DNA of the host cells, were run in parallel (see Table S3 in the supplemental material). The results revealed an important variability in cell content among the different clinical specimens, with GAPDH CT values ranging from 32.13 to undetected and CELL control r-gene CT values ranging from 28.57 to 33.93. There was no correlation between HRV RNA load and the amount of human cells in these specimens. Indeed, some samples enriched in cells presented a low viral load, and, inversely, samples with low cellular RNA or DNA presented a high viral load.
(iv) Target genetic variability.
To experimentally evaluate the variations in quantification related to the genetic variability of HRVs, we took advantage of plasmids that encode chimeric viral genomes (19). These genomes have a common HRV-A16 polyprotein sequence, but the 5′UTRs are derived from three different HRV species and one HEV-A species (HRV-B37, HRV-A16, HRV-C11, and HEV-A71, respectively).
Ten-fold dilution series were performed for each chimera, and for each dilution, the number of plasmid copies per ml was quantified with the Panenterhino/Ge/08 assay using the standard curve derived from the CT values obtained with the specific assay (HRV-A16 3D) run on the same template. Figure 3 illustrates the viral genome log copies/ml obtained using the four different constructs. In comparison to HRV-A16 3D, the mean viral genome loads were as follows: on the HRV-Ca construct, −0.38 log copies/ml (95% confidence interval [CI], −0.17 to −0.59); on the HRV-A16 construct, −0.23 log copies/ml (95% CI, −0.08 to −0.37); on the HRV-B37 construct, 0.17 log copies/ml (95% CI, 0.33 to 0.02); and on the HEV A-71 construct, −0.77 log copies/ml (95% CI, −0.47 to −1.07). Of note, differences above 0.5 log copies/ml were only observed for the HEV A-71/A16 construct. The mean % CV between values obtained with 5 10-fold dilutions of each of the different constructs and HRV-A16 3D was then calculated. When considering only the three HRV 5′UTRs, the mean % CV was 5.2% (range, 2.6 to 7.7%), whereas it was 7.0% (range, 5.6 to 8.4%) when the HEV 5′UTR was included (Fig. 4).
Fig 3.
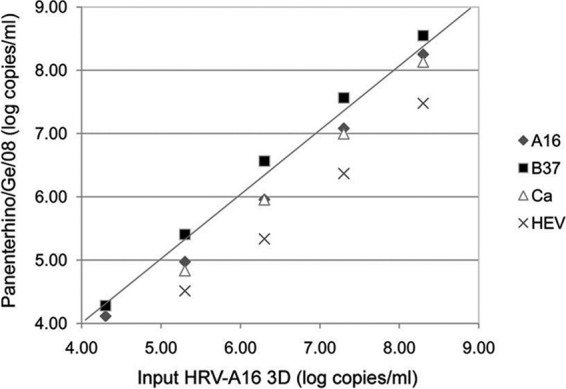
Experimental evaluation of HRV nucleic acid quantification variation linked to HRV genetic variability. The plot shows chimeric plasmid quantifications expressed in log copies/ml using the Panenterhino/Ge/08 assay (y axis) compared to the HRV-A16 3D values (x axis), using five 10-fold dilutions of chimeric plasmids, ranging from 4.30 to 8.30 copies/ml. Raw data are available in Table S4 in the supplemental material.
Figure 4 summarizes the sources of viral load quantification errors analyzed in this study. The % CV linked to one-step or two-step interassay variability (see Table S3 in the supplemental material), to HRV/HRV and HRV/HEV target genetic variability (Fig. 3; see Table S4 in the supplemental material), and to the assay used to quantify viral load in respiratory specimens (Fig. 2; see Table S2 in the supplemental material) are shown. Of note, when combining the % CV linked to interassay variability and that related to target genetic variability, the mean % CV of the HRV log RNA copies/ml ranged between 7.3% and 9.1% for the one-step assay and between 12.1% and 13.8% for the two-step assay.
DISCUSSION
Molecular techniques that detect RNA viruses have quickly evolved, and real-time RT-PCR provides the opportunity to quantify viral loads. The one-step real-time RT-PCR is a welcome simplification of the two-step RT-PCR, saves time, and results in a lower risk of technical errors. In this study, we adapted a two-step real-time RT-PCR assay, designed on the basis of an alignment of all HRV-A and HRV-B genotype sequences, as well as including 11 divergent HRV-C 5′UTR sequences (22) for one-step use. We have carefully assessed the feasibility and the limitations of its application for viral RNA load quantification in clinical specimens.
Comparison of one-step and two-step formats on serially diluted HRV RNA samples revealed that both assays were linear between 1.25 × 10⁹ and 1.25 × 10⁴ RNA copies/ml and had an LOD of 1.25 × 10³ RNA copies/ml for the one-step assay and 1.25 × 10² RNA copies/ml for the two-step assay.
However, the reproducibility of the one-step assay was higher, implying that the quantification reliability is better in this format. Application of the one-step and two-step assays for the quantification of HRV load among clinical specimens, as well as comparison of experiments performed by two different laboratory technicians, supported the increased reliability of the one-step assay. In summary, the one-step Panenterhino/Ge/08 real-time RT-PCR assay is recommended for diagnostic use and for HRV RNA quantification.
Several factors can lead to inaccurate measurements and limit the quantification of HRV RNAs in respiratory samples. Therefore, the viral loads in this study, as well as in other clinical studies, have to be considered with caution.
The most important limitation is probably the lack of an accurately quantified international reference standard RNA used for the establishment of standard curves, which makes absolute quantification currently impossible. However, _in vitro_-transcribed HRV-A16 RNA measurement by optical densitometry was revealed to be reproducible and quantitative during this study, enabling precise quantification, which allows comparison of viral loads in different specimens. As the PCR efficiency may vary from one experiment to another, it is important to include this standard RNA in every single experiment to obtain a standard curve that reflects the PCR efficiency of each experiment. Still, as demonstrated by the serial dilutions of the clinical specimens, the PCR efficiency of the standard will not be totally comparable to the efficiency of the same PCR performed on clinical samples.
We also demonstrated that HRV RNA quantification values differed significantly between the one-step and the two-step technologies. It is therefore important to use the same format when comparing such quantification results.
The technical reproducibility may also have some limitations. In our study, the interassay reproducibility was satisfactory with the one-step format, as shown by the low % CV. In contrast, the interassay reproducibility was much lower with the two-step assay.
Additionally, the use of a single real-time RT-PCR assay to detect over 150 described HRV genotypes has trade-offs. Although the Panenterhino/Ge/08 assay targets a conserved sequence stretch, the primers and probe contain degenerate positions, and there is a possibility of mismatches because of genetic variability. Moreover, two forward primers are present in the mix, one of which was designed to detect the more divergent HRV-Cs (22). Therefore, the efficiency of the RT-PCR will vary, depending on the genotype being amplified. This bias is important and needs to be taken into account not only for the absolute, but also for the relative quantification of HRVs. In this study, we estimated the impact of the 5′UTR genetic variability on viral quantification by the use of chimeric 5′UTR/polyprotein plasmids. As expected, HEV-A71, which has the most divergent target sequence with respect to our assay, generated the highest differences. Based on our experiments, we estimate that the variation in quantification related to HRV and HEV genetic variability is less than 10%. When combining the % CV linked to interassay variability and that related to target genetic variability in order to estimate global variability related to HRV RNA quantification in respiratory specimens, the mean % CV of the HRV log RNA copies/ml remained below 10% for the one-step assay, whereas it was around 14% with the two-step assay. It should be noted, however, that interassay variability may depend on the target sequence being amplified and that interassay variability may thus not be totally independent from target variability.
Finally, and perhaps most importantly, the nature of the respiratory specimens renders the interpretation of RNA quantifications difficult. Sampling techniques between individuals may differ considerably, especially regarding the NPS. Depending on which part of the nasal cavity is reached and how much force is applied to the mucosa, the quantities of viral RNA collected may vary significantly. Of note, we have shown that there was no strict correlation between the HRV RNA load and the amount of human cells in the specimens tested in our study. This may be explained by the fact that HRV viral RNA is not exclusively found inside the cells. However, the presence of a few cells in a specimen may indicate poor sampling technique, and the resulting determination of the viral load will thus likely be underestimated. Hence, when comparing the viral loads between two different specimens, it might be advisable to take human cell numbers into account to assess the reproducibility of the sampling procedure. Importantly, because the sampling techniques used for NPS and BAL specimens are completely different, the viral RNA quantities present in these two different kinds of samples should not be compared.
In summary, we validated the Panenterhino/Ge/08 real-time RT-PCR assay for one-step use and for HRV RNA quantification. Several technical difficulties limit the use of real-time RT-PCR for the quantification of the absolute viral load in respiratory specimens, and the lack of an accurately quantified international reference RNA for the establishment of standard curves is probably the most important limitation. The variability related to sampling procedures, which complicates the interpretation of HRV RNA quantification results, may be assessed by the use of an internal cellularity control. Despite these limitations, one-step real-time RT-PCR HRV RNA quantification was revealed to be precise, with an estimated global variability below 10%. It therefore enables comparison of HRV RNA amounts in respiratory specimens, provided that the samples are collected using a standard procedure and that the same reference RNA standard is used.
Supplementary Material
Supplemental material
ACKNOWLEDGMENTS
This study was supported by the Swiss National Science Foundation (grant no. 310030-127159 to C.T. and grant no. 32003B_127160 to L.K.) and partly supported by the Research Fund of the Department of Internal Medicine of the University Hospital and the Faculty of Medicine of Geneva. This fund receives an unrestricted grant from AstraZeneca Switzerland, GlaxoSmithKline, and Merck Sharp & Dohme.
Footnotes
Published ahead of print 20 June 2012
REFERENCES
- 1.Burns JL, et al. 2012. Respiratory viruses in children with cystic fibrosis: viral detection and clinical findings. Influenza Other Respir. Viruses 6:218–223 [DOI] [PMC free article] [PubMed] [Google Scholar]
- 2.Cordey S, et al. 2010. Rhinovirus genome evolution during experimental human infection. PLoS One 5:e10588 doi:10.1371/journal.pone.0010588 [DOI] [PMC free article] [PubMed] [Google Scholar]
- 3.de Almeida MB, et al. 2010. Rhinovirus C and respiratory exacerbations in children with cystic fibrosis. Emerg. Infect. Dis. 16:996–999 [DOI] [PMC free article] [PubMed] [Google Scholar]
- 4.Do DH, et al. 2010. A one-step, real-time PCR assay for rapid detection of rhinovirus. J. Mol. Diagn. 12:102–108 [DOI] [PMC free article] [PubMed] [Google Scholar]
- 5.Garbino J, et al. 2004. Lower respiratory viral illnesses: improved diagnosis by molecular methods and clinical impact. Am. J. Respir. Crit. Care Med. 170:1197–1203 [DOI] [PubMed] [Google Scholar]
- 6.Garbino J, et al. 2009. Respiratory viruses in bronchoalveolar lavage: a hospital-based cohort study in adults. Thorax 64:399–404 [DOI] [PubMed] [Google Scholar]
- 7.Hayden FG. 2004. Rhinovirus and the lower respiratory tract. Rev. Med. Virol. 14:17–31 [DOI] [PMC free article] [PubMed] [Google Scholar]
- 8.Heymann PW, Platts-Mills TA, Johnston SL. 2005. Role of viral infections, atopy and antiviral immunity in the etiology of wheezing exacerbations among children and young adults. Pediatr. Infect. Dis. J. 24:S217–S222 [DOI] [PubMed] [Google Scholar]
- 9.Iwane MK, et al. 2011. Human rhinovirus species associated with hospitalizations for acute respiratory illness in young US children. J. Infect. Dis. 204:1702–1710 [DOI] [PubMed] [Google Scholar]
- 10.Jackson DJ, Johnston SL. 2010. The role of viruses in acute exacerbations of asthma. J. Allergy Clin. Immunol. 125:1178–1189 [DOI] [PMC free article] [PubMed] [Google Scholar]
- 11.Jin Y, et al. 2009. Prevalence and clinical characterization of a newly identified human rhinovirus C species in children with acute respiratory tract infections. J. Clin. Microbiol. 47:2895–2900 [DOI] [PMC free article] [PubMed] [Google Scholar]
- 12.Kiang D, et al. 2007. Molecular characterization of a variant rhinovirus from an outbreak associated with uncommonly high mortality. J. Clin. Virol. 38:227–237 [DOI] [PubMed] [Google Scholar]
- 13.Lau SK, et al. 2007. Clinical features and complete genome characterization of a distinct human rhinovirus (HRV) genetic cluster, probably representing a previously undetected HRV species, HRV-C, associated with acute respiratory illness in children. J. Clin. Microbiol. 45:3655–3664 [DOI] [PMC free article] [PubMed] [Google Scholar]
- 14.Lu X, et al. 2008. Real-time reverse transcription-PCR assay for comprehensive detection of human rhinoviruses. J. Clin. Microbiol. 46:533–539 [DOI] [PMC free article] [PubMed] [Google Scholar]
- 15.Papadopoulos NG, et al. 2000. Rhinoviruses infect the lower airways. J. Infect. Dis. 181:1875–1884 [DOI] [PubMed] [Google Scholar]
- 16.Papadopoulos NG, Johnston SL. 2000. Rhinoviruses as pathogens of the lower respiratory tract. Can. Respir. J. 7:409–414 [DOI] [PubMed] [Google Scholar]
- 17.Papadopoulos NG, Psarras S. 2003. Rhinoviruses in the pathogenesis of asthma. Curr. Allergy Asthma Rep. 3:137–145 [DOI] [PubMed] [Google Scholar]
- 18.Rosenthal LA, et al. 2010. Viral respiratory tract infections and asthma: the course ahead. J. Allergy Clin. Immunol. 125:1212–1217 [DOI] [PMC free article] [PubMed] [Google Scholar]
- 19.Schibler M, et al. 2012. Experimental human rhinovirus and enterovirus interspecies recombination. J. Gen. Virol. 93:93–101 [DOI] [PubMed] [Google Scholar]
- 20.Seemungal TA, Harper-Owen R, Bhowmik A, Jeffries DJ, Wedzicha JA. 2000. Detection of rhinovirus in induced sputum at exacerbation of chronic obstructive pulmonary disease. Eur. Respir. J. 16:677–683 [DOI] [PMC free article] [PubMed] [Google Scholar]
- 21.Smyth AR, Smyth RL, Tong CY, Hart CA, Heaf DP. 1995. Effect of respiratory virus infections including rhinovirus on clinical status in cystic fibrosis. Arch. Dis. Child. 73:117–120 [DOI] [PMC free article] [PubMed] [Google Scholar]
- 22.Tapparel C, et al. 2009. New molecular detection tools adapted to emerging rhinoviruses and enteroviruses. J. Clin. Microbiol. 47:1742–1749 [DOI] [PMC free article] [PubMed] [Google Scholar]
- 23.Tapparel C, et al. 2011. Rhinovirus genome variation during chronic upper and lower respiratory tract infections. PLoS One 6:e21163 doi:10.1371/journal.pone.0021163 [DOI] [PMC free article] [PubMed] [Google Scholar]
- 24.Utokaparch S, et al. The relationship between respiratory viral loads and diagnosis in children presenting to a pediatric hospital emergency department. Pediatr. Infect. Dis. J. 30:e18–e23 [DOI] [PubMed] [Google Scholar]
- 25.Wat D, et al. 2008. The role of respiratory viruses in cystic fibrosis. J. Cyst. Fibros. 7:320–328 [DOI] [PMC free article] [PubMed] [Google Scholar]
Associated Data
This section collects any data citations, data availability statements, or supplementary materials included in this article.
Supplementary Materials
Supplemental material