Transcriptome-Wide RNA Interaction Profiling Reveals Physical and Functional Targets of hnRNP L in Human T Cells (original) (raw)
Abstract
The RNA processing factor hnRNP L is required for T cell development and function. However, the spectrum of direct targets of hnRNP L activity in T cells has yet to be defined. In this study, we used cross-linking and immunoprecipitation followed by high-throughput sequencing (CLIP-seq) to identify the RNA binding sites of hnRNP L within the transcriptomes of human CD4+ and cultured Jurkat T cells. We find that hnRNP L binds preferentially to transcripts encoding proteins involved in RNA processing and in Wnt and T cell receptor (TCR) signaling. This binding is largely conserved across both quiescent and activated T cells, in agreement with the critical role of hnRNP L throughout T cell biology. Importantly, based on the binding profile of hnRNP L, we validate numerous instances of hnRNP L-dependent alternative splicing of genes critical to T cell function. We further show that alternative exons with weak 5′ splice site sequences specifically show a strong correlation between hnRNP L binding and hnRNP L-dependent splicing regulation. Together, these data provide the first transcriptome-wide analysis of the RNA targets of hnRNP L in lymphoid cells and add to the functional understanding of hnRNP L in human biology.
INTRODUCTION
RNA-based gene regulation encompasses many universal processes that are essential to shaping the composition and function of the proteome in eukaryotic cells (1). In particular, mechanisms such as alternative splicing, alternative 3′-end processing, and microRNA (miRNA)-directed processes control not only the level of expression of a transcript but also the distinct protein isoforms encoded by a given gene. Therefore, such regulatory mechanisms allow for both the expansion and the control of genetic information.
Virtually all processes of RNA-based gene regulation are controlled by the activity of a family of RNA binding proteins known as hnRNPs (heterogeneous nuclear ribonucleoproteins) (2–5). Most members of the hnRNP family are ubiquitously expressed and bind to RNA substrates through RRM (RNA recognition motif) or KH (hnRNP K homology) domains (4). Depending on the location of binding and associated proteins, hnRNPs have been shown to either enhance or repress the inclusion of particular exons, promote or inhibit splicing efficiency, alter the use of competing 3′ cleavage and polyadenylation sites, control mRNA stability, and regulate miRNA access to target genes (2–5). All hnRNPs that have been well studied appear to be capable of carrying out all of these activities; therefore, the location of binding appears to be a primary determinant of whether and how a specific hnRNP controls the expression of a particular gene (2–4, 6).
Given the intricacy of T cell development and function, it is not surprising that RNA-based gene regulation is increasingly recognized as a critical determinant of the growth and activity of T cells (7, 8). In particular, one hnRNP for which there is much evidence of a functional role in T cell biology is hnRNP L (9–12). hnRNP L is a 65-kDa hnRNP family member that contains 4 RRM domains spaced throughout the length of the protein. These RRMs bind preferentially to CA repeat sequences (13), although at least one biologically relevant target sequence of hnRNP L does not conform to a strict CA repeat motif (9).
hnRNP L was first implicated in T cell biology through its role in regulating the splicing of the CD45 gene, which encodes a transmembrane phosphatase essential for T cell activation (9–12, 14). The CD45 gene contains three cassette exons (exons 4 to 6) that are independently regulated at the level of alternative splicing to control phosphatase activity (15, 16). We and others have shown previously that hnRNP L is a key determinant of CD45 splicing and expression (9, 10, 12, 17). Each of the three CD45 variable exons contains an exonic splicing silencer (ESS) that is constitutively bound by hnRNP L (11, 18). The binding of hnRNP L to these ESSs directly induces skipping of these exons both in vivo and in vitro (9–12, 19).
Recent investigation of the in vivo consequences of hnRNP L ablation in mouse thymocytes revealed a broad impact on thymic cellularity, T cell development, and the egress of mature T cells to the periphery (12). The effect of hnRNP L on CD45 expression may account for some of the T cell development phenotypes observed; however, dysregulation of CD45 splicing is not sufficient to explain all of the functional defects (15, 16). Therefore, the phenotypes of hnRNP L-deficient mice suggest that hnRNP L mediates a broad range of yet unidentified RNA-regulatory events critical to T cell development and function.
Here we have used in vivo cross-linking and immunoprecipitation (CLIP) (20, 21) to comprehensively identify the spectrum of hnRNP L targets within the transcriptome of human peripheral CD4+ T cells. In agreement with the idea that the primary role of hnRNP L in T cells is the regulation of alternative splicing, we observe extensive hnRNP L RNA interactions in the introns of protein-coding genes. While a subset of hnRNP L binding profiles may differ in different cell states, we find significant overlap between the hnRNP L binding profiles in the two primary functional states of CD4+ cells (resting and activated), as well as between those in primary CD4+ cells and JSL1 Jurkat cells, a common T cell model cell line. Such an overlap suggests a broadly conserved role for hnRNP L in T cell physiology. Importantly, we use the conserved binding sites for hnRNP L to identify several hnRNP L-regulated alternative splicing events in genes known to impact T cell development and function, and we demonstrate that 5′ splice site (5′ss) strength is a strong predictor of hnRNP L-regulated exons. Together, our data greatly expand the understanding of the cellular activity of hnRNP L, provide a transcriptome-wide profile of hnRNP L RNA interactions in human T cells, and identify hnRNP L-dependent splicing regulation of cellular pathways as critical for T cell development and immune function.
MATERIALS AND METHODS
CLIP-seq.
CD4+ T cells purified from peripheral blood mononuclear cells from three separate anonymized donors were obtained from the University of Pennsylvania Human Immunology Core (Institutional Review Board [IRB] protocol 811028). For each sample, half of the cell population was cultured in RPMI medium containing 10% fetal bovine serum at 37°C under 5% CO2 for 24 h, while the other half was stimulated with 10 μg anti-CD3 and anti-CD28 antibodies for 60 h. CLIP was carried out according to a previously published protocol (20, 21). Briefly, resting and stimulated cells were washed twice with Hanks' balanced salt solution (HBSS) and were subjected to UV cross-linking on ice. Cells were lysed in a high-stringency buffer (containing 0.1% SDS, 0.5% sodium deoxycholate, and 0.5% NP-40), treated with DNase and RNase T1, and immunoprecipitated using protein G Dynabeads coated with an anti-hnRNP L antibody (Abcam). After stringent washing, a radioactive 3′ RNA linker was ligated to RNA cross-linked to protein, and samples were resolved on 10% Bis-Tris Novex NuPAGE gels. The RNA bound to hnRNP L was eluted from the membrane by proteinase K–7 M urea and was ligated to a 5′ RNA linker, and cDNA was synthesized. The library was prepared from the cDNA samples by using two-step PCR, with the second PCR step incorporating primers containing bar codes for high-throughput sequencing. Individually bar-coded sequencing libraries were pooled and sequenced on an Illumina Genome Analyzer IIx (for JSL1 cell samples) or an Illumina HiSeq 2000 sequencing system (for CD4+ cell samples) at the University of Pennsylvania Next Generation Sequencing Core (NGSC). CLIP followed by high-throughput sequencing (CLIP-seq) using JSL1 Jurkat cells was carried out as described above, except that the cells were stimulated with 20 ng/ml phorbol myristate acetate (PMA) for 60 h.
CLIP-seq data analysis.
Raw reads were first trimmed from the 3′ end for a base call quality of zero (Phred score). Sequencing adaptors were removed using cutadapt, version 0.9.4, and homopolymeric runs of ≥6 nucleotides (nt) were trimmed from the 3′ end. Reads were aligned to hg19 with Bowtie, version 0.12.7, allowing for a maximum of 2 mismatches between the read and the index. Alignments were filtered for unambiguous mapping, and duplicate alignments (start and end coordinates) were removed before calling peaks (see Table S1 in the supplemental material). Replicates were combined, allowing duplicate alignments only when they originated in separately bar-coded and sequenced samples. Peaks were called empirically using a false discovery rate (FDR) threshold of 0.001, comparing the CLIP signal to backgrounds generated from 100 permutations of CLIP tags within bound transcripts (a method similar to that used in reference 22). RefSeq mRNAs were searched for peaks, and peaks within 50 nt were merged into binding sites. Binding sites with support from fewer than 2 replicates were discarded from further analysis.
Binding site definition and analysis.
For each cell type, resting-state and stimulated-state binding profiles were intersected using a 50-nt joining distance. The resulting genomic regions were classified as shared if at least one resting-state binding site was joined to at least one stimulated-state binding site, extending the boundaries of the shared genomic region to the edges of the constituent binding sites. The remaining binding sites were not shared between the resting and stimulated conditions. We further divided these remaining sites into two classes: condition biased and condition specific. Condition-biased sites were called as a peak under one condition and not the other yet had at least one aligned CLIP tag under the other condition. Condition-specific sites were identified as a peak under one condition but had zero aligned CLIP tags within the 50-nt joining distance under the other. To identify sites of hnRNP L RNA interaction observed under all four CLIP conditions, we extracted genomic regions in which binding sites in all four binding profiles occurred within 50 nt of each other. These regions are thus defined as “common regions.”
Binding sites were annotated based on overlap with RefSeq mRNA features from the UCSC Genome Browser. Nucleotides overlapping each type of transcript feature were enumerated and compared to total RefSeq mRNAs. In cases where a nucleotide within a binding site overlapped more than one type of transcript feature, precedence was assigned first to coding exons, then to untranslated region (UTR) exons, then to proximal introns (within 300 nt of an exon), and finally to distal intronic regions. Individual nucleotides overlapping each type of genomic annotation were enumerated and compared to the composition of the RefSeq mRNAs by using identical precedence assignments and considering only unique nucleotides within the genome.
To calculate the overlap between CLIP experiments, the percentage of total nucleotides that overlap the resting- and stimulated-state binding profiles were counted. As a control, resting- and stimulated-state binding sites from CD4+ cells were permuted within bound transcripts, and the percentages of overlapping nucleotides were enumerated in the same manner.
Motif enrichment analysis.
Z-scores were assigned to each of the 4,096 possible hexamers observed within binding sites based on 100 permutations of the positions of binding sites within bound transcripts. The top 20 hexamers were aligned with ClustalW2 to generate sequence logos with WebLogo, version 2.8 (23).
Gene ontology analysis.
We analyzed enriched gene ontology (GO) terms and KEGG pathways among transcripts using DAVID, version 6.7 (http://david.abcc.ncifcrf.gov/), comparing genes with common CLIP-defined hnRNP L binding regions to all transcripts expressed in JSL1 cells (as we have described previously [24]).
Computational analysis.
We used bedtools 2.16.2, Perl 5.16.2, Python 2.7, Gnuplot 4.6, and R 2.15.3 for computational and graphical analysis. We executed parallel computation on the Penn Genome Frontiers Institute High Performance Compute cluster.
RT-PCR splicing analysis.
We depleted hnRNP L in JSL1 T cells by using lentivirus-based delivery of a short hairpin RNA (shRNA) targeting hnRNP L (25). The shRNA sequence used is AGCGACGGCCATCTTCTGTGAAAGTATAGTGAAGCCACAGATCTATACTTTCACAGAAGATGGCCG (targeting a transcript encoding amino acid residues 477 to 483) and is expressed from a tetracycline-inducible promoter. Cells stably expressing the lentivirus-derived shRNA construct were grown in doxycycline (product no. D9891; 1 μg/ml; Sigma) for 24 h, then split into two samples, and grown for an additional 48 h in the presence of doxycycline either alone or with 20 ng/ml PMA. RNA was harvested using RNAzol (Tel-Test Inc.), and the splicing of individual genes was assayed by reverse transcription-PCR (RT-PCR) as described previously (18) using the primers listed in Table S10 in the supplemental material.
CLIP-seq data accession numbers.
Raw sequencing reads for all 12 biological samples in this study are available, along with processed binding profiles, under GEO accession number GSE47604. A UCSC Genome Browser view of the complete CLIP-seq data is available at http://tinyurl.com/hnRNPL-CLIP-Tcells.
RESULTS
hnRNP L has been well documented to control the splicing of the CD45 gene in both mouse and human T cells (9–12). However, the dramatic developmental defect observed in hnRNP L-deficient thymocytes, together with the high abundance of this protein in T cells (12, 26) (Fig. 1a), suggests that hnRNP L controls the expression of a large set of functionally important genes. Therefore, to begin to understand the physiological impact of hnRNP L on T cell function, we performed cross-linking and immunoprecipitation followed by high-throughput sequencing (CLIP-seq) in primary human CD4+ T cells (20, 21).
FIG 1.

Transcriptome-wide hnRNP L RNA interactions in primary human CD4+ T cells revealed by CLIP-seq. (a) Western blot of hnRNP L expression in resting and anti-CD3- and anti-CD28-stimulated human CD4+ T cells. Shown are both total expression (Total) and the efficiency of immunoprecipitation (IP) versus the protein remaining uncollected (Sup). Note that “Total” and “Sup” levels are 5% of IP levels. (b) Flow chart of analysis of CLIP-seq reads obtained from CD4+ cells from three independent donors. Each sample was analyzed before and after stimulation by anti-CD3 and anti-CD28. Data from resting CD4+ cells are shown in blue, while data from stimulated CD4+ cells are shown in red. Numbers of reads passing key filters in the analysis are shown, including the final number of binding sites defined within RefSeq transcripts in resting and stimulated human CD4+ cells (see Materials and Methods and Table S1 in the supplemental material for details). (c) Distribution of hnRNP L binding sites that map to each indicated feature of RefSeq mRNAs compared to the distribution of each feature in the total RefSeq transcriptome. (d and e) Z-scores for the enrichment of hexamers within binding sites in resting (d) and stimulated (e) cells were calculated by comparing observed hexamer frequencies within CLIP-defined hnRNP L binding sites to randomized binding profiles within bound transcripts. (Insets) The top 20 hexamers were aligned to generate sequence logos.
All previous studies of hnRNP L in T cells have shown this protein to function similarly in resting and activated cell states, with no data suggesting a widespread change in the binding specificity of this protein in response to T cell stimulation (10, 27). Nevertheless, since our goal is to understand the role of hnRNP L in promoting T cell function, we performed CLIP in parallel in quiescent (resting) cells and cells activated through the T cell receptor, since these two cell conditions represent critical states of T cell physiology. Briefly, purified CD4+ T cells were obtained from three healthy donors. For each donor, half the cells were stimulated in culture with antibodies against CD3 and CD28 (T cell receptor and coreceptor), while the other half were maintained in medium alone. Direct protein-RNA interactions were fixed in living cells by treatment with UV light, which induces covalent cross-links between proteins and the RNAs to which they are directly bound (21). Cells were then lysed; RNA was fragmented to a size range of 30 to 110 nt; and hnRNP L RNA complexes were stringently purified using a well-described antibody to endogenous human hnRNP L (see Fig. S1 in the supplemental material). The efficiency of the immunoprecipitation and the consistency of hnRNP L expression in resting and stimulated CD4+ T cells are shown in Fig. 1a. Following isolation of the hnRNP L RNA complexes from cells, RNAs were released from the protein, tagged with RNA linkers, and subjected to high-throughput sequencing (see Materials and Methods).
hnRNP L RNA interaction profiles in T cells.
We obtained a total of ∼200 million reads from the 3 pools of resting CD4+ cells and ∼100 million reads from the stimulated samples (Fig. 1b). In each case, more than 80% of reads mapped unambiguously to the genome, corresponding to a final total of 13 to 15 million unique alignments (Fig. 1b; see also Table S1 in the supplemental material). Of these unique aligned reads (i.e., “CLIP tags”), ∼23% mapped within protein-coding transcripts (Fig. 1b, RefSeq alignments), 6% to established noncoding RNAs, 19% to antisense RNAs, and the remaining 51% to mitochondrial RNAs or RNAs deriving from intergenic regions of the genome (see Table S2 in the supplemental material). We note that the numbers of unique alignments, as well as the genomic distributions of reads, are virtually identical for the resting and stimulated samples despite the 2-fold differential in raw reads. We thus conclude that the sequencing depth of the stimulated samples is essentially a saturating sampling of hnRNP L binding and that the increased sequencing depth from the resting samples provides little extra discovery. We also note that the majority of intergenic alignments represented isolated reads, suggesting that these are due to spurious binding events and/or background noise in the sequencing (see Table S2 in the supplemental material).
Because our primary interest is to understand the role of hnRNP L in shaping protein expression in T cells, we focused on those reads within protein-coding transcripts (Fig. 1b, RefSeq alignments). In order to identify a reliable binding profile of hnRNP L within transcripts, we defined binding sites empirically, using an algorithm similar to published methods that accounts for transcript length and expression (22) (see Materials and Methods). To identify sites of reproducible hnRNP L RNA interaction, we required that a binding site be represented in at least two of three biological replicates. By this criterion we observed, in total, 49,619 sites of hnRNP L binding in resting CD4+ cells and 47,137 in anti-CD3- and anti-CD28-stimulated cells (Fig. 1b). We note that the overlap between biological samples was high: ∼85% of total peaks met the requirement of being present in at least two of the replicates (see below). Moreover, on average, each site was supported by 8 to 12 reads, although a subset of sites were supported by many more (see Table S3 in the supplemental material).
As expected from general predictions of hnRNP function in pre-mRNA splicing, the majority of the binding sites we identify occur within proximal (within 300 nt of an exon) and distal intronic regions (Fig. 1c). Furthermore, hnRNP L binding sites are depleted within coding exons but are enriched in 3′ UTR exons (Fig. 1c), in agreement with previously identified roles for hnRNP L in the regulation of 3′-end processing and the modulation of miRNA regulation (5, 28). Finally, hexamer enrichment analysis reveals a strong preference for CA repeat elements, as evidenced both in the 2 most enriched hexamers and by multiple sequence alignment of the top 20 enriched hexamers (Fig. 1d and e; see also Table S4 in the supplemental material). Such a bias toward CA repeats is anticipated from previous biochemical studies of the binding specificity of hnRNP L (29). In sum, the concurrence of the locations and sequence bias of the CLIP-identified hnRNP L binding sites with those from previous studies, together with the presence of sites of known hnRNP L RNA regulatory interactions within CLIP-derived binding profiles (see below), provides confidence that we have reliably identified major binding sites of hnRNP L across the transcriptome of CD4+ T cells.
Previous studies from our lab and others have used Jurkat cells, an immortalized T cell line, to investigate the function of hnRNP L in T cell biology (9–11, 30). In order to correlate our findings in primary CD4+ cells to Jurkat cells and to determine the utility of Jurkat cells for future mechanistic studies of hnRNP L function, we performed CLIP analysis in parallel with that described above using JSL1 Jurkat cells (see Fig. S1 in the supplemental material). As with the CD4+ cells, we used triplicate biological samples of JSL1 cells grown in medium alone (resting) or stimulated with the phorbol ester PMA, which mimics T cell signaling in these cells (31). In these experiments, we collected a total of 51 million and 68 million reads from the resting and stimulated cells, respectively, from which we defined 41,440 binding sites in resting cells and 32,156 binding sites in stimulated cells by using the criteria described for CD4+ cells (Fig. 2a). Notably, the distribution of transcript features bound by hnRNP L in JSL1 cells is similar to that in CD4+ cells (Fig. 2b). Additionally, the sequence motifs enriched within hnRNP L binding profiles are consistent both with previous experiments (29) and with the results for CD4+ primary T cells (Fig. 2c and d). Interestingly, using expression data for resting and stimulated JSL1 cells from previous studies (24), we find that there is no general correlation between the density of CLIP tags aligning to a gene and its overall expression level (see Fig. S2 in the supplemental material). This lack of correlation of CLIP detection and gene expression confirms that the abundance of CLIP tags is a true reflection of the binding preference of hnRNP L.
FIG 2.

Transcriptome-wide hnRNP L RNA interaction profiles obtained in JSL1 T cells. (a) Six biological replicates of JSL1 T cells, representing triplicate samples of resting and PMA-stimulated cells, were subjected to CLIP-seq analysis. Data were processed by a pipeline identical to that used to analyze hnRNP L binding sites in CD4+ cells. (b) Nucleotides of each type of transcript feature were enumerated within hnRNP L binding sites for both resting and stimulated conditions. (c and d) Z-scores for the enrichment of hexamers within binding sites in resting (c) and stimulated (d) cells were calculated by comparing observed hexamer frequencies within CLIP-defined hnRNP L binding sites to randomized binding profiles within bound transcripts. (Insets) The top 20 hexamers were aligned to generate sequence logos.
CLIP-seq identifies consistent binding profiles in JSL1 and CD4+ T cells.
Given the similarity between the sequence features and genomic annotations of the hnRNP L binding profiles obtained in CD4+ and JSL1 T cells, we asked how consistent the binding of hnRNP L was between cell types and growth conditions. By calculating the percentage of total overlapping nucleotides for the two cell types, or for the two conditions, we find significantly greater overlap between the hnRNP L CLIP samples from the four cell populations than between randomized binding profiles (Fig. 3a). For each cell type, we also investigated the number of peaks in resting cells that fell within 50 nt of a peak in the corresponding stimulated cells (Fig. 3b and c). Strikingly, for both CD4+ and JSL1 cells, at least one-third of the peaks are shared between the resting and stimulated conditions by this logic. For a further ∼50% of binding sites defined as “biased,” we observe reads in both cell states, although these reads reach significance thresholds under only one of the two conditions. Indeed, at most ∼20% of hnRNP L binding sites in any cell appear to be truly “condition specific,” in that reads are identified in only one of the growth states investigated. While this minority population of condition-specific binding events may be of interest (see below), our data clearly demonstrate that the bulk of hnRNP L binding is conserved between primary and cultured T cells as well as between resting and stimulated states. Specifically, we identify a set of 4,585 common hnRNP L binding regions that are present in all four cell types analyzed (see Table S5 in the supplemental material). These common regions occupy 2,460 genes in the T cell transcriptome. Importantly, among these common hnRNP L binding sites, we observe the two best characterized hnRNP L functional sites of interaction, namely, the ESS1 regulatory element in CD45 exon 4 (9) (Fig. 3d) and an autoregulatory intronic site in HNRNPL (32) (Fig. 3e).
FIG 3.

CLIP-seq identifies common hnRNP L RNA interactions among primary and cultured T cells. (a) The percentages of overlapping nucleotides for different binding profiles were computed transcriptome-wide. The P value was ∼0 for all pairwise overlaps of the data compared to the overlap of 100 permutations of resting and stimulated CD4+ binding profiles randomized within bound transcripts (control). (b and c) Total binding sites in resting and stimulated binding profiles for CD4+ (b) and JSL1 (c) cells were classified as shared, biased, or condition specific as described in Materials and Methods and in Results. (d and e) UCSC Genome Browser view of CD45 exon 4 (d) or intron 6 from HNRNPL (e), showing binding profiles from four experimental conditions. Bars above the gene schematics indicate previously identified binding sites for hnRNP L (ESS1 in CD45 and CA region in HNRNPL).
hnRNP L binds transcripts from the Wnt and TCR signaling pathways.
Given the presence of known targets of hnRNP L regulatory function the common binding regions, we focused on this set of 4,585 binding events to identify new functional targets of hnRNP L and to begin to understand how this protein influences T cell development and function. First, we analyzed the KEGG pathways enriched the common target genes. Strikingly, genes involved in Wnt signaling (P, 1.67E−4) and T cell receptor (TCR) signaling (P, 0.0011) are in the most overrepresented pathways among hnRNP L-bound transcripts (Table 1). Importantly, Wnt signaling is critical for thymic development (33), while TCR signaling is essential for both the development and the function of T cells (34). We also analyzed biological process GO terms with DAVID, which revealed a strong enrichment of terms related to transcription and RNA-based gene regulation among common hnRNP L-bound transcripts (Table 1). Together, these analyses suggest that hnRNP L may broadly affect T cell function both directly, by regulating key signaling pathways, and indirectly, by altering the expression of other DNA- and RNA-binding proteins that control gene expression.
TABLE 1.
Pathways and biological processes enriched among transcripts with common hnRNP L binding regions_a_
| Category | Term | No. of transcripts | Fold enrichment | P b | FDR |
|---|---|---|---|---|---|
| KEGG pathway | Wnt signaling pathway | 41 | 2.066 | 1.67E−04 | 0.0012 |
| T cell receptor signaling pathway | 38 | 2.006 | 0.001088 | 0.0079 | |
| Long-term potentiation | 22 | 2.38 | 0.007826 | 0.0572 | |
| Pathways in cancer | 62 | 1.571 | 0.012093 | 0.0886 | |
| Focal adhesion | 38 | 1.832 | 0.012704 | 0.0931 | |
| Biological process | Positive regulation of transcription from RNA polymerase II promoter | 68 | 1.774173 | 0.001251 | 6.33E−04 |
| Positive regulation of nucleobase, nucleoside, nucleotide, and nucleic acid metabolic process | 106 | 1.476789 | 0.023944 | 0.012258 | |
| Positive regulation of macromolecule metabolic process | 143 | 1.368027 | 0.055268 | 0.028755 | |
| Positive regulation of nitrogen compound metabolic process | 107 | 1.448531 | 0.055639 | 0.028953 | |
| Positive regulation of RNA metabolic process | 82 | 1.508582 | 0.124865 | 0.067444 | |
| Positive regulation of transcription, DNA dependent | 81 | 1.509538 | 0.135902 | 0.07386 | |
| Positive regulation of macromolecule biosynthetic process | 104 | 1.425853 | 0.148022 | 0.080999 | |
| Positive regulation of cellular biosynthetic process | 105 | 1.416999 | 0.177101 | 0.09855 |
Novel targets of hnRNP L-dependent splicing regulation.
There are numerous mechanisms by which the binding of hnRNP L to a transcript may influence its expression, including regulation of transcription, stability, and efficiency of processing. Because hnRNP L is best characterized as a splicing regulatory protein, we focused this study on determining new targets of hnRNP L splicing regulation. We first identified several instances in which common hnRNP L binding regions (as defined above) were located in introns flanking known alternative exons, and we then assayed the inclusion of these exons in JSL1 cells depleted of hnRNP L (Fig. 4a). In agreement with the prediction from Table 1 that hnRNP L regulates genes involved in TCR signaling, T cell development, and RNA synthesis and processing, we find that hnRNP L depletion significantly alters the inclusion of known variable exons in the genes encoding the RNA-binding protein PUM2 (Fig. 4b) and the transcription factors NFAT, Bcl11A, and TCF3, which are involved in T cell developmental and activation pathways (35–37) (Fig. 4c to e). We also observe hnRNP L-dependent alternative splicing of the mitogen-activated protein (MAP) kinase TAK1 and the GTPase ACAP1, which regulate NF-κB signaling upon immune signaling (38, 39), and of CCAR1, a coactivator required for Wnt-dependent gene activation (40) (Fig. 4f to h). For all these genes, inclusion of the variable exon either regulates overall protein expression (NFAT5 and CCAR1) or alters the domain structure of the protein (PUM2, Bcl11A, TCF3, TAK1, and ACAP1) (see Discussion). Therefore, hnRNP L-regulated splicing of these genes is likely to impact T cell development and signaling, in agreement with the prediction from Table 1 and the phenotype of hnRNP L thymic deletion mice (12).
FIG 4.

HnRNP L regulates exon inclusion of transcripts important to T cell development and signaling. (a) Lysates from wild-type cells and from cells stably transfected with a lentivirus carrying shRNA targeted to hnRNP L (L-KD) were immunoblotted using antibodies against hnRNP L or tubulin to assess loading. (b to h) Representative RT-PCR analyses of the indicated genes. Gray and black boxes represent the variable and constitutive exons, respectively, while the black line represents introns. Blue boxes represent the hnRNP L binding sites (see Fig. S3 in the supplemental material for an expanded browser view of CLIP data). The percentages of inclusion (% Inc) of the variable exons are averages for at least three independent experiments; standard deviations (SD) are shown. (e) a1 and a2 represent mutually exclusive exons. (h) The dashed box denotes the poison exon, while % alt represents the percentage of inclusion of the poison exon relative to the three isoforms.
The case of CCAR1 is particularly interesting, since we discovered that the binding of hnRNP L is in fact not in an intron but rather in an unannotated poison exon (i.e., an exon containing a stop codon). The fact that hnRNP L strongly represses this CCAR1 poison exon, together with our previous data on hnRNP L-mediated repression of CD45 exon 4 (9), suggests that although binding of hnRNP L to exons is rare (Fig. 1c and 2b), these events represent robust repressive activity of hnRNP L. Consistently, we identify ∼60 genes that contain common hnRNP L binding sites within or overlapping an exon (see Table S5 in the supplemental material). For five of the hnRNP L-bound exons tested, we find that the variable exon is markedly upregulated upon hnRNP L depletion (Fig. 5). Importantly, these hnRNP L-regulated exons include those in genes encoding splicing factors (ZRANB2), cell surface receptors (SPG11, IL2RG), intracellular signaling proteins (ARAP1), and a transcription coactivator (SS18), all of which have potential roles in T cell biology.
FIG 5.
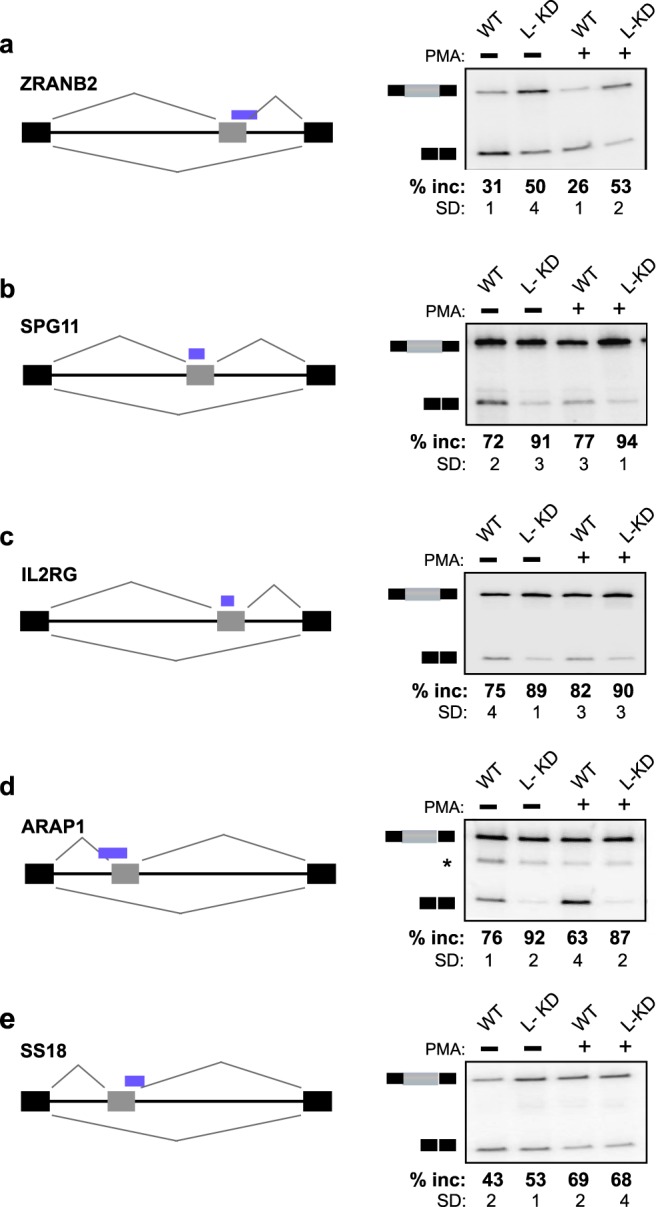
Binding of hnRNP L within exons represses exon inclusion. (a to e) Representative RT-PCR analyses of the indicated genes, as described in the legend to Fig. 4. The percentages of inclusion of the variable exons are averages from at least three independent experiments; standard deviations (SD) are shown. The asterisk in panel d indicates a nonspecific PCR product. See Fig. S4 in the supplemental material for an expanded browser view of CLIP data.
5′ splice site (5′ss) strength is a determinant of hnRNP L function.
In addition to their functional implications, the newly identified targets of hnRNP L-mediated splicing regulation presented in Fig. 4 and 5 demonstrate the breadth of the mechanism of hnRNP L function. While exon binding appears to correlate with hnRNP L-dependent repression (Fig. 5), we observe no clear correlation between intron binding and hnRNP L-dependent splicing regulation. For instance, reduction of hnRNP L levels increases the inclusion of the variable exon of PUM2, whereas it decreases the inclusion of the variable exon in Bcl11A, despite binding on either side of the exon in both instances. Conversely, hnRNP L appears to enhance variable-exon inclusion whether it is bound to the upstream (NFAT5) or the downstream (TAK1) intron. Moreover, ∼50% of exons containing or flanked by common hnRNP L binding sites that we tested for splicing displayed no change in inclusion in response to hnRNP L depletion (see Table S6 in the supplemental material). This lack of defined correlation between binding location and function is consistent both with our previous studies demonstrating that factors in addition to the location of hnRNP L binding determine its functional impact on splicing (19) and with other studies that have revealed that CLIP-defined binding sites for hnRNPs are not strong predictors of splicing regulation (41, 42).
To determine if we could increase our ability to utilize the CLIP-defined hnRNP L binding sites to identify novel targets of hnRNP L-mediated splicing regulation, we grouped the 27 exons tested by a variety of parameters, such as intron length, position of the CLIP site, and splice site strength (see Table S6 in the supplemental material). Strikingly, we find that hnRNP L-dependent splicing regulation correlates best with the strength of the 5′ splice site of the alternative exon. Specifically, no alternative exons with 5′ss scores of 10 or greater (MaxEnt [43]) were regulated by hnRNP L, even when multiple common binding sites were detected close to the variable exon (see, e.g., DIAPH1 and ATM in Table S6 in the supplemental material). In contrast, all of the hnRNP L-regulated exons had 5′ss scores less than 9.5, and 70% of the alternative exons with scores less than 9.5 exhibited hnRNP L-dependent regulation (see Table S6). Notably, no other single feature encompassed all of the 14 validated hnRNP L regulatory events with a discovery rate of 70% or more.
To further validate the relevance of 5′ splice site strength, we tested an additional 14 exons in functionally important genes for hnRNP L-dependent splicing regulation (see Table S6 in the supplemental material). These exons were chosen with a range of 5′ss scores, including two in the window between 9.5 and 10 that was not represented in our initial exon set. In agreement with our predictions, we find that neither exon with a 5′ss score above 9.9 exhibits changes in splicing upon depletion of hnRNP L, while 8 of the 12 exons with 5′ss scores less than 9.9 are regulated by hnRNP L (Fig. 6; see also Table S6 in the supplemental material). Therefore, we conclude that 5′ss strength is an important criterion in determining regulation by hnRNP L and can be applied to CLIP-identified physical targets to increase the discovery power of functional targets of hnRNP L-regulated splicing. Importantly, using these criteria, we have identified a total of 20 previously unrecognized targets of hnRNP L-mediated splicing regulation, all of which are genes implicated in critical signaling and gene expression pathways in T cells, thus providing further insight into the functional role of hnRNP L in T cell biology.
FIG 6.

Validation of hnRNP L targets based on 5′ splice site strength. (a to h) Representative RT-PCR analysis of the indicated genes, as described in the legend to Fig. 4. 5′ss scores, as calculated by MaxEntScan, are shown for the alternative exons. The percentages of inclusion of the variable exons are averages from at least three independent experiments, and standard deviations (SD) are shown. See Fig. S5 in the supplemental material for an expanded browser view of CLIP data.
Condition specificity of hnRNP L binding.
Our analysis of the transcriptome-wide binding of hnRNP L has thus far been focused on the binding sites that are present in all four T cell populations tested, since these reveal much about the ubiquitous role of hnRNP L in T cell biology. However, as mentioned above, we did identify a subset of hnRNP L RNA interactions in both cell types that are condition specific, occurring either entirely in resting samples or entirely in stimulated samples, with no reads observed under the opposite condition (Fig. 3b and c). To further investigate the nature of these condition-specific events, we analyzed changes in gene expression for these resting-state-specific and stimulated-state-specific binding sites, using gene expression data that we had obtained previously for JSL1 cells (24). Remarkably, we find that the majority of condition-specific sites are in genes whose expression does not differ significantly between resting and stimulated samples, demonstrating that the difference in association with hnRNP L is not a secondary consequence of differential gene expression (Fig. 7a and b). We also find that these condition-specific binding sites maintain the general bias toward CA repeats that is seen in the common sites (Fig. 7c and d; see also Table S4 in the supplemental material), although this bias is less dramatic, particularly within the stimulation-specific peaks (see Table S4 in the supplemental material and Discussion). While the possibility of direct condition-specific regulation of hnRNP L binding is not inconsistent with previous studies in T cells, there are no data to directly support such a model. Moreover, we find that the discovery of condition-specific peaks is diminished the more stringently we require biological replication of a binding site (see Table S7 in the supplemental material). Therefore, it remains possible that only a minor subset of the condition-specific peaks we have defined here truly represent signal-regulated changes in the binding of hnRNP L, while the majority reflect false positives due to limited sequencing depth and biological noise.
FIG 7.

Condition-specific binding sites in JSL1 cells are not due to changes in transcript expression. (a and b) The difference in the gene expression level (expressed as the number of RNA-Seq reads per kilobase of transcript per million reads [RPKM]) between resting and stimulated JSL1 cells was calculated as log2(RPKM for stimulated cells/RPKM for resting cells) from preexisting data (24) and was plotted for all transcripts bearing resting-state-specific (a) or stimulated-state-specific (b) binding sites in JSL1 cells. (c) Hexamer enrichment for all resting-state-specific sites that are not in genes with a ≤−0.5 change in gene expression (as indicated by the gray bar in panel a). (Inset) Sequence logo generated by multiple alignment of the top 20 hexamers. (d) Hexamer enrichment for all stimulated-state-specific sites that are not in genes with a ≥0.5 change in gene expression (as indicated in panel b). (Inset) Sequence logo generated by multiple alignment of the top 20 hexamers.
DISCUSSION
hnRNP L has been shown to be necessary for thymic maturation (12), suggesting that this protein plays a widespread role in shaping the proteomes of developing and mature T cells. Here we utilize CLIP-seq to identify hnRNP L binding targets within human CD4+ T cells and within a cell line commonly used for mechanistic studies of T cell biology. Importantly, the data we present here provide the first transcriptome-wide analysis of the RNA targets of hnRNP L in primary human lymphoid cells and offer novel insight into functional targets of hnRNP L in T cells.
Novel functional targets of hnRNP L revealed by CLIP.
Because the primary goal of this study was to identify novel targets of hnRNP L activity relevant to T cell function, we focused on the most conserved of the hnRNP L binding events in protein-coding genes. Using these sites, we have identified 20 new targets of hnRNP L splicing regulation. These targets include genes required for T cell signaling, such as the genes for PTK2B (44), FYN (45), NFAT5 (35), and TAK1 (38), genes required for T cell development (the genes for TCF3 [46], Bcl11A [36, 47], and NFAT5 [35]), and the WNT signaling pathway mediator CCAR1 (40). Additional hnRNP L targets include other receptor and signaling proteins (SPG11, IL2RG, ACAP1, ARAP1, WNK1, PPIP5K2, and ITGA6), transcription factors (GPBP1, SS18), and RNA binding proteins (PUM2, ZRANB2, HNRNPC, and LUC7L), all of which may broadly influence signaling and gene expression patterns in T cells. These validated targets are consistent with the enrichment of common hnRNP L binding regions in genes involved in TCR and Wnt signaling pathways and proteins involved in transcription and RNA processing.
Of particular interest is the hnRNP L-dependent regulation of TCF3, PTK2B, and FYN, since these proteins are known to be essential for the proper development and function of T cells. In the case of FYN, we show that hnRNP L is responsible for promoting the preferential inclusion of the second mutually exclusive exon relative to the first (Fig. 6g). Inclusion of the second exon gives rise to the FynT isoform, which is preferentially expressed in hematopoietic cells and displays altered catalytic activity relative to FynB (including the first alternative exon) (48). Mice that specifically lack the FynT isoform have a marked defect in T cell signaling during thymic development (49). Similarly, hnRNP L promotes the expression of the hematopoiesis-specific smaller PTK2B isoform, which exhibits a substrate profile distinct from that of the larger isoform (44). Like FYN, PTK2B is required for appropriate T cell activation by promoting signaling through the interleukin 2 (IL-2) and LFA-1 receptors (50, 51). Lastly, the TCF3 gene encodes the E12 and E47 E-box transcription factors through alternative inclusion of the mutually exclusive exons (52). Our data demonstrate that hnRNP L modulates the relative expression of these factors, favoring the E12 isoform. Interestingly, ectopic overexpression of E47, as would be predicted to occur upon depletion of hnRNP L, has been shown to cause inappropriate activation of the immunoglobulin locus in pre-T cells, which would inhibit normal T cell development (53). Therefore, while the exact contributions of FYN, PTK2B, and TCF3 misregulation to the phenotype of hnRNP L-deficient mice remain to be tested, changes in the splicing of any of these proteins upon depletion of hnRNP L in thymocytes could be sufficient to explain the developmental defects observed in vivo (12).
Finally, in addition to the identification of new targets of hnRNP L-dependent splicing regulation, we also find enrichment of 3′ UTRs among the hnRNP L binding sites, suggesting that hnRNP L may play a more widespread role in the regulation of 3′-end processing or miRNA binding than was suggested by the few instances reported previously (5, 28). We also observe binding of hnRNP L outside of protein-coding genes. While the majority of these interactions are isolated events (see Fig. S2 in the supplemental material), such binding may indicate additional activities of hnRNP L in the maturation of noncoding RNAs or the control of antisense transcription. In sum, the spectrum of binding events we identify here by CLIP-seq is fully consistent with known and predicted activities of hnRNP L, has identified several new targets of hnRNP L splicing regulation among genes critical for T cell development and function, and underscores the scope of the functional interactions of this abundant protein with a diverse repertoire of RNAs in T cells.
Interplay of hnRNP L with T cell activation.
Because T cell activation by antigens is an essential component in T cell physiology, we analyzed both the binding and splicing activities of hnRNP L in both resting and activated T cell states. Proper protein expression in these two cell states is critical for maintaining appropriate functioning of the immune system. Aberrant protein expression in resting cells can lead to hyperproliferation and autoimmunity, while incorrect protein expression in activated T cells hinders the body's ability to respond to foreign antigens. Previously, we have identified ∼180 exons for which inclusion is significantly regulated upon T cell stimulation (24). While there is no evidence that the activity of hnRNP L is altered in response to T cell activation or directly drives these activation-induced changes in splicing, this protein has been shown to critically influence the expression of at least three of these exons (CD45 exons 4 to 6) in both resting and activated T cells. Furthermore, loss of hnRNP L-dependent repression of these exons contributes to autoimmune defects (9, 54, 55).
Importantly, we find common sites for hnRNP L binding around CD45 (PTPRC) exons 4 to 6 under all four cell conditions tested here (Fig. 3d; see also Table S8 in the supplemental material). We also observe common hnRNP L binding sites in 25 other signal-regulated genes, including 4 for which we have validated the function of hnRNP L in regulating exon inclusion in at least one cell state (the genes for TAK1, PTK2B, LUC7L, and FYN [Fig. 4 and 6; see also Table S8 in the supplemental material]). Interestingly, in three of these cases (TAK1, LUC7L, and FYN), depletion of hnRNP L is observed to influence splicing only under one cell condition, despite the fact that robust binding is observed under both conditions. Such condition-specific function was also observed for hnRNP L-dependent regulation of Bcl11A and SS18 despite the presence of common binding sites. Importantly, condition-specific effects of hnRNP L depletion are an expected result due to the combinatorial regulation of splicing. In other words, most splicing events are determined by the interplay of multiple regulatory proteins. Therefore, the requirement for any one protein is influenced by the presence or absence of other proteins. For instance, the stimulation-specific requirement for hnRNP L in repressing the LUC7L exon likely reflects the presence of a more efficient repressor protein that specifically associates with LUC7L in resting cells and compensates for the loss of hnRNP L under resting conditions. Alternatively, condition-specific effects of hnRNP L might reflect regulation of the intrinsic activity of hnRNP L upon T cell activation, although such regulation has not been described and would have to be gene specific.
Finally, in addition to the correlation of common binding sites with condition-specific function in some cases, we also detect a subset of binding sites that are apparent only in resting or stimulated T cells and cannot be explained solely by differences in the availability of transcripts. Notably, there are ∼40 genes with condition-specific binding events among the previously defined signal-responsive splicing targets (see Table S8 in the supplemental material). While further study will be required to determine the biological relevance of these and other apparently condition specific binding sites, we note that a subset of hexamers enriched among the JSL1 stimulation-specific binding sites are distinct from the typical CA repeat element and are not enriched in the resting-state-specific or total binding site sets (see Table S4 in the supplemental material). Interestingly, these stimulation-specific hexamers contain motifs, such as TCT repeats and poly(C) elements, similar to those of known binding sites of other hnRNPs, such as PTB (hnRNP I) and hnRNP K and hnRNP E2, respectively (4). Therefore, it is possible that hnRNP I, K, or E2 directs at least a subset of hnRNP L binding events in stimulated cells. We also note the possibility that stimulation of T cells results in a posttranslational modification(s) of hnRNP L that alters its binding affinity and/or specificity. While such regulation of hnRNP L binding has not been reported in T cells, at least two reports have suggested that phosphorylation of hnRNP L in other cell types can alter its ability to recognize specific RNA target sequences (56, 57). We emphasize, however, that less than 10% of the total binding events we detect for hnRNP L appear to be condition specific, and this number decreases further with increased stringency of peak calling (see Table S7 in the supplemental material). Therefore, whatever mechanism(s) is at play to direct condition-specific binding of hnRNP L, the majority of hnRNP L interactions remain unaffected, underscoring the consistency of hnRNP L association with the transcriptome in both resting and activated T cells.
Mechanisms of hnRNP L splicing regulation.
An inherent limitation of CLIP-seq analysis is that the method identifies physical interactions but provides no information regarding function. Therefore, a challenge in moving forward from such studies is how to identify which physical interactions are meaningful for any given function of interest. In some cases, “RNA maps” have been constructed to correlate binding location with splicing function; however, the construction of these maps requires knowledge of a large number of functional targets, so they are not suitable for de novo discovery. Furthermore, we and others have shown previously that hnRNP L can function as an enhancer or a repressor from similar locations within an exon (5, 19), suggesting that location is not a primary determinant of hnRNP L splicing activity. Indeed, simply scoring for proximity of a conserved hnRNP L binding site to a known alternative exon provided only ∼50% confidence of hnRNP L-dependent splicing (see Table S6 in the supplemental material).
As an alternative approach to better prediction of binding sites that correspond to splicing regulation, we scored a range of features of the first 28 test exons we investigated for hnRNP L-dependent splicing regulation and found that the strength of the 5′ss of the alternative exon was the strongest predictor of hnRNP L activity. Using this criterion, we then identified another eight targets of hnRNP L-regulated splicing, with an accuracy of ∼70%. Interestingly, 3 of the 4 alternative exons that were not regulated by hnRNP L despite a low 5′ss score were flanked by introns that were each >10 kb long, whereas all of the hnRNP L-regulated exons were flanked by at least one intron of <9 kb. Therefore, intron length may provide additional predictive power in identifying targets of hnRNP L splicing regulation.
In addition to the predictive power of 5′ss strength, the fact that this feature correlated best with hnRNP L-regulated splicing has important mechanistic implications. Previously, we have shown that 5′ss strength influences the ability of hnRNP L to regulate a model exon and that at least one mechanism by which hnRNP L acts is remodeling of the interaction of the U1 snRNA with the 5′ss region (19, 58). Interestingly, we have identified 26 hnRNP L-bound exons within our CLIP data that have the sequence hallmarks of the U1 remodeling mechanism (see Table S9 in the supplemental material), including the exon in PUM2 that we have validated as strongly repressed by hnRNP L (Fig. 4b). Therefore, our CLIP data provide further evidence of the importance of 5′ss identity in the mechanism by which hnRNP L regulates T cell biology, and they set the stage for further investigation of the determinants of hnRNP L binding and function.
Supplementary Material
Supplemental material
ACKNOWLEDGMENTS
We are grateful to Gene Yeo, Gabriel Pratt, Michael Lovci, and Juan Gonzalez Vallinas for analytical advice; to Joe Grubb, Jonathan Schug, the Philadelphia Perl Mongers, Grace Babcock, and Matt Lynch for technical and administrative assistance; and to members of the Lynch laboratory for helpful discussions and reading of the manuscript. Sequencing was performed at the Next Generation Sequencing Core within the Functional Genomics Core at the Perelman School of Medicine, University of Pennsylvania.
This work was funded by R01 GM084034 and GM103383 (to K.W.L.). G.S. is a fellow of the American Heart Association.
Footnotes
Published ahead of print 28 October 2013
REFERENCES
- 1.Nilsen TW, Graveley BR. 2010. Expansion of the eukaryotic proteome by alternative splicing. Nature 463:457–463. 10.1038/nature08909 [DOI] [PMC free article] [PubMed] [Google Scholar]
- 2.Bomsztyk K, Denisenko O, Ostrowski J. 2004. hnRNP K: one protein multiple processes. Bioessays 26:629–638. 10.1002/bies.20048 [DOI] [PubMed] [Google Scholar]
- 3.Makeyev AV, Liebhaber SA. 2002. The poly(C)-binding proteins: a multiplicity of functions and a search for mechanisms. RNA 8:265–278. 10.1017/S1355838202024627 [DOI] [PMC free article] [PubMed] [Google Scholar]
- 4.Martinez-Contreras R, Cloutier P, Shkreta L, Fisette J-F, Revil T, Chabot B. 2007. hnRNP proteins and splicing control. Adv. Exp. Med. Biol. 623:123–147. 10.1007/978-0-387-77374-2_8 [DOI] [PubMed] [Google Scholar]
- 5.Hung LH, Heiner M, Hui J, Schreiner S, Benes V, Bindereif A. 2008. Diverse roles of hnRNP L in mammalian mRNA processing: a combined microarray and RNAi analysis. RNA 14:284–296. 10.1261/rna.725208 [DOI] [PMC free article] [PubMed] [Google Scholar]
- 6.Erkelenz S, Mueller WF, Evans MS, Busch A, Schoneweis K, Hertel KJ, Schaal H. 2013. Position-dependent splicing activation and repression by SR and hnRNP proteins rely on common mechanisms. RNA 19:96–102. 10.1261/rna.037044.112 [DOI] [PMC free article] [PubMed] [Google Scholar]
- 7.Martinez NM, Lynch KW. 2013. Control of alternative splicing in immune responses: many regulators, many predictions, much still to learn. Immunol. Rev. 253:216–236. 10.1111/imr.12047 [DOI] [PMC free article] [PubMed] [Google Scholar]
- 8.Ansel KM. 2013. RNA regulation of the immune system. Immunol. Rev. 253:5–11. 10.1111/imr.12062 [DOI] [PMC free article] [PubMed] [Google Scholar]
- 9.Rothrock CR, House AE, Lynch KW. 2005. HnRNP L represses exon splicing via a regulated exonic splicing silencer. EMBO J. 24:2792–2802. 10.1038/sj.emboj.7600745 [DOI] [PMC free article] [PubMed] [Google Scholar]
- 10.Topp JD, Jackson J, Melton AA, Lynch KW. 2008. A cell-based screen for splicing regulators identifies hnRNP LL as a distinct signal-induced repressor of CD45 variable exon 4. RNA 14:2038–2049. 10.1261/rna.1212008 [DOI] [PMC free article] [PubMed] [Google Scholar]
- 11.Tong A, Nguyen J, Lynch KW. 2005. Differential expression of CD45 isoforms is controlled by the combined activity of basal and inducible splicing-regulatory elements in each of the variable exons. J. Biol. Chem. 280:38297–38304. 10.1074/jbc.M508123200 [DOI] [PubMed] [Google Scholar]
- 12.Gaudreau MC, Heyd F, Bastien R, Wilhelm B, Moroy T. 2012. Alternative splicing controlled by heterogeneous nuclear ribonucleoprotein L regulates development, proliferation, and migration of thymic pre-T cells. J. Immunol. 188:5377–5388. 10.4049/jimmunol.1103142 [DOI] [PubMed] [Google Scholar]
- 13.Hui J, Stangl K, Lane WS, Bindereif A. 2003. HnRNP L stimulates splicing of the eNOS gene by binding to variable-length CA repeats. Nat. Struct. Biol. 10:33–37. 10.1038/nsb875 [DOI] [PubMed] [Google Scholar]
- 14.Hermiston ML, Xu Z, Majeti R, Weiss A. 2002. Reciprocal regulation of lymphocyte activation by tyrosine kinases and phosphatases. J. Clin. Invest. 109:9–14. 10.1172/JCI14794 [DOI] [PMC free article] [PubMed] [Google Scholar]
- 15.Xu Z, Weiss A. 2002. Negative regulation of CD45 by differential homodimerization of the alternatively spliced isoforms. Nat. Immunol. 3:764–771. 10.1038/ni822 [DOI] [PubMed] [Google Scholar]
- 16.Majeti R, Bilwes AM, Noel JP, Hunter T, Weiss A. 1998. Dimerization-induced inhibition of receptor protein tyrosine phosphatase function through an inhibitory wedge. Science 279:88–91. 10.1126/science.279.5347.88 [DOI] [PubMed] [Google Scholar]
- 17.Preussner M, Schreiner S, Hung LH, Porstner M, Jack HM, Benes V, Ratsch G, Bindereif A. 2012. HnRNP L and L-like cooperate in multiple-exon regulation of CD45 alternative splicing. Nucleic Acids Res. 40:5666–5678. 10.1093/nar/gks221 [DOI] [PMC free article] [PubMed] [Google Scholar]
- 18.Rothrock C, Cannon B, Hahm B, Lynch KW. 2003. A conserved signal-responsive sequence mediates activation-induced alternative splicing of CD45. Mol. Cell 12:1317–1324. 10.1016/S1097-2765(03)00434-9 [DOI] [PubMed] [Google Scholar]
- 19.Motta-Mena LB, Heyd F, Lynch KW. 2010. Context-dependent regulatory mechanism of the splicing factor hnRNP L. Mol. Cell 37:223–234. 10.1016/j.molcel.2009.12.027 [DOI] [PMC free article] [PubMed] [Google Scholar]
- 20.Ule J. 2009. High-throughput sequencing methods to study neuronal RNA-protein interactions. Biochem. Soc. Trans. 37:1278–1280. 10.1042/BST0371278 [DOI] [PubMed] [Google Scholar]
- 21.Ule J, Jensen K, Mele A, Darnell RB. 2005. CLIP: a method for identifying protein-RNA interaction sites in living cells. Methods 37:376–386. 10.1016/j.ymeth.2005.07.018 [DOI] [PubMed] [Google Scholar]
- 22.Xue Y, Zhou Y, Wu T, Zhu T, Ji X, Kwon YS, Zhang C, Yeo G, Black DL, Sun H, Fu XD, Zhang Y. 2009. Genome-wide analysis of PTB-RNA interactions reveals a strategy used by the general splicing repressor to modulate exon inclusion or skipping. Mol. Cell 36:996–1006. 10.1016/j.molcel.2009.12.003 [DOI] [PMC free article] [PubMed] [Google Scholar]
- 23.Crooks GE, Hon G, Chandonia JM, Brenner SE. 2004. WebLogo: a sequence logo generator. Genome Res. 14:1188–1190. 10.1101/gr.849004 [DOI] [PMC free article] [PubMed] [Google Scholar]
- 24.Martinez NM, Pan Q, Cole BS, Yarosh CA, Babcock GA, Heyd F, Zhu W, Ajith S, Blencowe BJ, Lynch KW. 2012. Alternative splicing networks regulated by signaling in human T cells. RNA 18:1029–1040. 10.1261/rna.032243.112 [DOI] [PMC free article] [PubMed] [Google Scholar]
- 25.Shin KJ, Wall EA, Zavzavadjian JR, Santat LA, Liu J, Hwang JI, Rebres R, Roach T, Seaman W, Simon MI, Fraser ID. 2006. A single lentiviral vector platform for microRNA-based conditional RNA interference and coordinated transgene expression. Proc. Natl. Acad. Sci. U. S. A. 103:13759–13764. 10.1073/pnas.0606179103 [DOI] [PMC free article] [PubMed] [Google Scholar]
- 26.Wu Z, Jia X, de la Cruz L, Su XC, Marzolf B, Troisch P, Zak D, Hamilton A, Whittle B, Yu D, Sheahan D, Bertram E, Aderem A, Otting G, Goodnow CC, Hoyne GF. 2008. Memory T cell RNA rearrangement programmed by heterogeneous nuclear ribonucleoprotein hnRNPLL. Immunity 29:863–875. 10.1016/j.immuni.2008.11.004 [DOI] [PMC free article] [PubMed] [Google Scholar]
- 27.Melton AA, Jackson J, Wang J, Lynch KW. 2007. Combinatorial control of signal-induced exon repression by hnRNP L and PSF. Mol. Cell. Biol. 27:6972–6984. 10.1128/MCB.00419-07 [DOI] [PMC free article] [PubMed] [Google Scholar]
- 28.Jafarifar F, Yao P, Eswarappa SM, Fox PL. 2011. Repression of VEGFA by CA-rich element-binding microRNAs is modulated by hnRNP L. EMBO J. 30:1324–1334. 10.1038/emboj.2011.38 [DOI] [PMC free article] [PubMed] [Google Scholar]
- 29.Hui J, Hung LH, Heiner M, Schreiner S, Neumuller N, Reither G, Haas SA, Bindereif A. 2005. Intronic CA-repeat and CA-rich elements: a new class of regulators of mammalian alternative splicing. EMBO J. 24:1988–1998. 10.1038/sj.emboj.7600677 [DOI] [PMC free article] [PubMed] [Google Scholar]
- 30.Oberdoerffer S, Moita LF, Neems D, Freitas RP, Hacohen N, Rao A. 2008. Regulation of CD45 alternative splicing by heterogeneous ribonucleoprotein, hnRNPLL. Science 321:686–691. 10.1126/science.1157610 [DOI] [PMC free article] [PubMed] [Google Scholar]
- 31.Lynch KW, Weiss A. 2000. A model system for activation-induced alternative splicing of CD45 pre-mRNA in T cells implicates protein kinase C and Ras. Mol. Cell. Biol. 20:70–80. 10.1128/MCB.20.1.70-80.2000 [DOI] [PMC free article] [PubMed] [Google Scholar]
- 32.Rossbach O, Hung LH, Schreiner S, Grishina I, Heiner M, Hui J, Bindereif A. 2009. Auto- and cross-regulation of the hnRNP L proteins by alternative splicing. Mol. Cell. Biol. 29:1442–1451. 10.1128/MCB.01689-08 [DOI] [PMC free article] [PubMed] [Google Scholar]
- 33.Maillard I, Fang T, Pear WS. 2005. Regulation of lymphoid development, differentiation, and function by the Notch pathway. Annu. Rev. Immunol. 23:945–974. 10.1146/annurev.immunol.23.021704.115747 [DOI] [PubMed] [Google Scholar]
- 34.Weiss A. 1995. Molecular and genetic insights into the role of protein tyrosine kinases in T cell receptor signaling. Clin. Immunol. Immunopathol. 76:S158–S162. 10.1016/S0090-1229(95)90054-3 [DOI] [PubMed] [Google Scholar]
- 35.Go WY, Liu X, Roti MA, Liu F, Ho SN. 2004. NFAT5/TonEBP mutant mice define osmotic stress as a critical feature of the lymphoid microenvironment. Proc. Natl. Acad. Sci. U. S. A. 101:10673–10678. 10.1073/pnas.0403139101 [DOI] [PMC free article] [PubMed] [Google Scholar]
- 36.Liu P, Keller JR, Ortiz M, Tessarollo L, Rachel RA, Nakamura T, Jenkins NA, Copeland NG. 2003. Bcl11a is essential for normal lymphoid development. Nat. Immunol. 4:525–532. 10.1038/ni925 [DOI] [PubMed] [Google Scholar]
- 37.Ikawa T, Kawamoto H, Goldrath AW, Murre C. 2006. E proteins and Notch signaling cooperate to promote T cell lineage specification and commitment. J. Exp. Med. 203:1329–1342. 10.1084/jem.20060268 [DOI] [PMC free article] [PubMed] [Google Scholar]
- 38.Wan YY, Chi H, Xie M, Schneider MD, Flavell RA. 2006. The kinase TAK1 integrates antigen and cytokine receptor signaling for T cell development, survival and function. Nat. Immunol. 7:851–858. 10.1038/ni1355 [DOI] [PubMed] [Google Scholar]
- 39.Yamamoto-Furusho JK, Barnich N, Xavier R, Hisamatsu T, Podolsky DK. 2006. Centaurin β1 down-regulates nucleotide-binding oligomerization domains 1- and 2-dependent NF-κB activation. J. Biol. Chem. 281:36060–36070. 10.1074/jbc.M602383200 [DOI] [PubMed] [Google Scholar]
- 40.Ou CY, Kim JH, Yang CK, Stallcup MR. 2009. Requirement of cell cycle and apoptosis regulator 1 for target gene activation by Wnt and beta-catenin and for anchorage-independent growth of human colon carcinoma cells. J. Biol. Chem. 284:20629–20637. 10.1074/jbc.M109.014332 [DOI] [PMC free article] [PubMed] [Google Scholar]
- 41.Huelga SC, Vu AQ, Arnold JD, Liang TY, Liu PP, Yan BY, Donohue JP, Shiue L, Hoon S, Brenner S, Ares M, Jr, Yeo GW. 2012. Integrative genome-wide analysis reveals cooperative regulation of alternative splicing by hnRNP proteins. Cell Rep. 1:167–178. 10.1016/j.celrep.2012.02.001 [DOI] [PMC free article] [PubMed] [Google Scholar]
- 42.Lagier-Tourenne C, Polymenidou M, Hutt KR, Vu AQ, Baughn M, Huelga SC, Clutario KM, Ling SC, Liang TY, Mazur C, Wancewicz E, Kim AS, Watt A, Freier S, Hicks GG, Donohue JP, Shiue L, Bennett CF, Ravits J, Cleveland DW, Yeo GW. 2012. Divergent roles of ALS-linked proteins FUS/TLS and TDP-43 intersect in processing long pre-mRNAs. Nat. Neurosci. 15:1488–1497. 10.1038/nn.3230 [DOI] [PMC free article] [PubMed] [Google Scholar]
- 43.Yeo G, Burge CB. 2004. Maximum entropy modeling of short sequence motifs with applications to RNA splicing signals. J. Comput. Biol. 11:377–394. 10.1089/1066527041410418 [DOI] [PubMed] [Google Scholar]
- 44.Dikic I, Schlessinger J. 1998. Identification of a new Pyk2 isoform implicated in chemokine and antigen receptor signaling. J. Biol. Chem. 273:14301–14308. 10.1074/jbc.273.23.14301 [DOI] [PubMed] [Google Scholar]
- 45.Davidson D, Chow LM, Fournel M, Veillette A. 1992. Differential regulation of T cell antigen responsiveness by isoforms of the src-related tyrosine protein kinase p59fyn. J. Exp. Med. 175:1483–1492. 10.1084/jem.175.6.1483 [DOI] [PMC free article] [PubMed] [Google Scholar]
- 46.Van Parijs L, Refaeli Y, Lord JD, Nelson BH, Abbas AK, Baltimore D. 1999. Uncoupling IL-2 signals that regulate T cell proliferation, survival, and Fas-mediated activation-induced cell death. Immunity 11:281–288. 10.1016/S1074-7613(00)80103-X [DOI] [PubMed] [Google Scholar]
- 47.Yu Y, Wang J, Khaled W, Burke S, Li P, Chen X, Yang W, Jenkins NA, Copeland NG, Zhang S, Liu P. 2012. Bcl11a is essential for lymphoid development and negatively regulates p53. J. Exp. Med. 209:2467–2483. 10.1084/jem.20121846 [DOI] [PMC free article] [PubMed] [Google Scholar]
- 48.Davidson D, Viallet J, Veillette A. 1994. Unique catalytic properties dictate the enhanced function of p59fynT, the hemopoietic cell-specific isoform of the Fyn tyrosine protein kinase, in T cells. Mol. Cell. Biol. 14:4554–4564 [DOI] [PMC free article] [PubMed] [Google Scholar]
- 49.Appleby MW, Gross JA, Cooke MP, Levin SD, Qian X, Perlmutter RM. 1992. Defective T cell receptor signaling in mice lacking the thymic isoform of p59fyn. Cell 70:751–763. 10.1016/0092-8674(92)90309-Z [DOI] [PubMed] [Google Scholar]
- 50.Beinke S, Phee H, Clingan JM, Schlessinger J, Matloubian M, Weiss A. 2010. Proline-rich tyrosine kinase-2 is critical for CD8 T-cell short-lived effector fate. Proc. Natl. Acad. Sci. U. S. A. 107:16234–16239. 10.1073/pnas.1011556107 [DOI] [PMC free article] [PubMed] [Google Scholar]
- 51.Miyazaki T, Takaoka A, Nogueira L, Dikic I, Fujii H, Tsujino S, Mitani Y, Maeda M, Schlessinger J, Taniguchi T. 1998. Pyk2 is a downstream mediator of the IL-2 receptor-coupled Jak signaling pathway. Genes Dev. 12:770–775. 10.1101/gad.12.6.770 [DOI] [PMC free article] [PubMed] [Google Scholar]
- 52.Slattery C, Ryan MP, McMorrow T. 2008. E2A proteins: regulators of cell phenotype in normal physiology and disease. Int. J. Biochem. Cell Biol. 40:1431–1436. 10.1016/j.biocel.2007.05.014 [DOI] [PubMed] [Google Scholar]
- 53.Schlissel M, Voronova A, Baltimore D. 1991. Helix-loop-helix transcription factor E47 activates germ-line immunoglobulin heavy-chain gene transcription and rearrangement in a pre-T-cell line. Genes Dev. 5:1367–1376. 10.1101/gad.5.8.1367 [DOI] [PubMed] [Google Scholar]
- 54.Lynch KW, Weiss A. 2001. A CD45 polymorphism associated with multiple sclerosis disrupts an exonic splicing silencer. J. Biol. Chem. 276:24341–24347. 10.1074/jbc.M102175200 [DOI] [PubMed] [Google Scholar]
- 55.Jacobsen M, Schweer D, Ziegler A, Gaber R, Schock S, Schwinzer R, Wonigeit K, Lindert RB, Kantarci O, Hemmer B. 2000. A point mutation in PTPRC is associated with the development of multiple sclerosis. Nat. Genet. 26:495–499. 10.1038/82659 [DOI] [PubMed] [Google Scholar]
- 56.Liu G, Razanau A, Hai Y, Yu J, Sohail M, Lobo VG, Chu J, Kung SK, Xie J. 2012. A conserved serine of heterogeneous nuclear ribonucleoprotein L (hnRNP L) mediates depolarization-regulated alternative splicing of potassium channels. J. Biol. Chem. 287:22709–22716. 10.1074/jbc.M112.357343 [DOI] [PMC free article] [PubMed] [Google Scholar]
- 57.Goehe RW, Shultz JC, Murudkar C, Usanovic S, Lamour NF, Massey DH, Zhang L, Camidge DR, Shay JW, Minna JD, Chalfant CE. 2010. hnRNP L regulates the tumorigenic capacity of lung cancer xenografts in mice via caspase-9 pre-mRNA processing. J. Clin. Invest. 120:3923–3939. 10.1172/JCI43552 [DOI] [PMC free article] [PubMed] [Google Scholar]
- 58.Chiou NT, Shankarling G, Lynch KW. 2013. hnRNP L and hnRNP A1 induce extended U1 snRNA interactions with an exon to repress spliceosome assembly. Mol. Cell 49:972–982. 10.1016/j.molcel.2012.12.025 [DOI] [PMC free article] [PubMed] [Google Scholar]
Associated Data
This section collects any data citations, data availability statements, or supplementary materials included in this article.
Supplementary Materials
Supplemental material