PRENATAL EXPRESSION PATTERNS OF GENES ASSOCIATED WITH NEUROPSYCHIATRIC DISORDERS (original) (raw)
. Author manuscript; available in PMC: 2015 Jul 1.
Abstract
Objective
Neurodevelopmental disorders presumably involve events that occur during brain development. We hypothesized that neuropsychiatric disorders considered to be developmental in etiology are associated with susceptibility genes that are relatively upregulated during fetal life (i.e. differentially expressed).
Method
We investigated the presence of prenatal expression enrichment of susceptibility genes systematically, as composite gene sets associated with 6 neuropsychiatric disorders in the microarray-based “BrainCloud” dorsolateral prefrontal cortex (DLPFC) transcriptome.
Results
Using a fetal/post-natal log2 fold change threshold of 0.5, genes associated with syndromic neurodevelopmental disorders (n = 31 genes, p = 3.37×10⁻³), intellectual disability (n = 88 genes, p = 5.53×10⁻³), and autism spectrum disorder (n = 242 genes, p = 3.45×10⁻⁴) were relatively enriched in prenatal transcript abundance, compared to the overall transcriptome. Genes associated with schizophrenia by GWAS were not preferentially fetal expressed (n = 106 genes, p = 0.46), nor were genes associated with schizophrenia by exome sequencing (n = 212 genes, p = .21), but specific genes within CNV regions associated with schizophrenia were relatively enriched in prenatal transcript abundance, and genes associated with schizophrenia by meta-analysis were functionally enriched for some neurodevelopmental processes. In contrast, genes associated with neurodegenerative disorders were significantly underexpressed during fetal life (n = 46 genes, p = 1.67×10⁻³).
Conclusions
We found evidence for relative prenatal enrichment of putative susceptibility genes for syndromic neurodevelopmental disorders, intellectual disability, and autism spectrum disorders. Future transcriptome-level association studies should evaluate regions other than the DLPFC, at other time points, and incorporate further RNA sequencing analyses.
Keywords: Neurodevelopment, Transcription, Dorsolateral prefrontal cortex, microarray, schizophrenia, autism spectrum disorders, intellectual disability, Copy Nucleotide Variant (CNV), RNA Sequencing
INTRODUCTION
Adult onset psychiatric disorders are increasingly being viewed as of neurodevelopment origin, at least in part. For example, neurodevelopmental hypotheses of schizophrenia introduced and articulated in the 1980’s, posited that a pathological perturbation occurs early in life and that after a latent period, as the brain matures in early adulthood and calls into action the compromised neural systems, and concurrent with environmental complexity, the perturbation becomes clinically manifest, resulting in the symptoms that constitute the syndrome of adult-onset schizophrenia.1
The neurodevelopmental model of schizophrenia has gained considerable traction and evidentiary support since first proposed. Different versions of the neurodevelopmental model have speculated that different temporal periods of brain development are most critical in pathogenesis: e.g. pre-natal or post-natal events,2 or adolescent synaptic refinement.3 Epidemiologic evidence for pre-natal insults associated with increased schizophrenia frequency include famine exposure 4 and maternal infection.5 Minor physical anomalies in the craniofacial region and limbs observed in patients with schizophrenia suggest disturbed pre-natal ectoderm development.6 Evidence for peri-natal insults includes the association of obstetric complications with schizophrenia, which leads to up to a 2-fold increase in the frequency of schizophrenia, with the magnitude of the effect varying by the type of obstetric complication,7,8 and with schizophrenia risk associated genes potentially interacting with obstetric complications.9,10 In children who subsequently develop schizophrenia, motor abnormalities,11 social abnormalities,12 and cognitive deficits13,14 are present long before the onset of psychotic symptomatology. In animal models, prenatal and neonatal disruptions of cortical development lead to the emergence of abnormalities in a number of cognitive and dopamine-related behaviors and glutamatergic-gabaergic pharmacological abnormalities that do not emerge until early adulthood.15,16,17 At the cellular level, altered post-natal maturation processes hypothesized to play a role in pathogenesis include GABA interneuron maturation, pruning of glutamate synapses, maturation of dopaminergic projections, and oligodendrocyte differentiation and myelination.18
Yet, despite the accumulating circumstantial evidence for a neurodevelopmental pathogenesis, a definitive cellular or molecular explanation of the neurobiology of an early pathogenic process has remained elusive. Recent emerging molecular evidence suggest that analysis of the temporal expression patterns of genes associated with schizophrenia may provide insight into neurodevelopmental pathogenesis; for several genes associated with schizophrenia, alternatively spliced transcripts expressed relatively abundantly in the developing fetal brain may in fact contribute differentially to the mechanism of risk that underlies the clinical association.19 Alternatively spliced transcripts that are expressed pre-natally and associated with schizophrenia allelic risk variants have been demonstrated for multiple schizophrenia candidate genes to date, including DISC1, neuregulin 1, neuregulin 3, GAD1, ZNF804A, and KCNH2.20–25 Further, some groups reported that genes associated with schizophrenia by exome sequencing of de novo rare variants are prenatally enriched in transcript abundance.26,27
More broadly, beyond schizophrenia, other psychiatric disorders have been implicated as having a developmental etiology. Obstetric complications may be an antecedent, or risk factor, for psychiatric disorders other than schizophrenia.28 Autism spectrum disorders and intellectual disability are readily classified as neurodevelopmental disorders in the clinical and research literature,29 and their clinical onset in infancy or early childhood especially implicates an early developmental abnormality.
An intriguing hypothesis then is that a neuropsychiatric disorder considered to be early developmental in etiology is associated with genes that are preferentially fetally expressed, that is with genes that are more transcriptionally active or abundant (i.e. differentially regulated) in the pre-natal period compared to the post-natal period. Furthermore, the preferentially fetally expressed genes are likely to be enriched for functions that have been associated in previous gene expression studies with the developing fetal brain: neural development and differentiation, axon guidance, transcription factor and gene regulation activity.30,31 This would implicate factors related to gene regulation in the fetally developing brain as critical for the genetic association with a developmental phenotype.
The present study investigated risk genes systematically, as composite gene sets associated with a specific neuropsychiatric disorder, for the presence of transcripts that are preferentially fetally expressed in the transcriptome of the dorsolateral prefrontal cortex (DLPFC). We report the prenatal expression patterns of susceptibility genes associated with 4 neuropsychiatric disorders that are thought to have developmental components to their pathogenesis: syndromic neurodevelopmental disorders, autism spectrum disorders (ASD), intellectual disability, and schizophrenia, and one group of disorders thought not to be principally of developmental origin: neurodegenerative disorders. We also include genes associated with bipolar affective disorder in the current analysis.
METHODS
Gene Set Assignment
Based on literature review, susceptibility genes were classified into 6 neuropsychiatric disorders and 12 gene sets based on differing genetic evidence (See Supplementary Methods for methodology of gene set assignment). The gene sets were then explored in data derived from BrainCloud,32 the public database of human prefrontal cortex gene expression across the lifespan (http://braincloud.jhmi.edu/). As described by Colantuoni et al, 2011, RNA from 269 human post-mortem DLPFC samples ranging from fetal life (n = 38 fetal samples) up to 80 years of age, was extracted and analyzed on custom 2-color microarrays using a reference RNA comprised of a pool of all samples in each array, with hybridization at 30,167 probes reported.
Statistical Methods
Linear regression was performed at each of 30,176 probes, modeling gene expression as a continuous dependent variable, as a function of a binary “fetal” stage variable, including surrogate variables as adjustment variables to account for potential batch effects and other unwanted technical and biological variation.
More formally, the statistical model was:
yij=αi+βiXjfetal+∑γSV+εij
for probe i ∈ [1, …, 30,176] and subject j ∈ [1, …, 269], with indicator variable Xjfetal∈[0,1] and surrogate variable set SV (SV1, …, SV30). This regression model generated a “fetal effect” (βi), the log2 fold change of pre-natal versus post-natal transcript abundance, at each probe on the microarray.
Each gene set was then evaluated by a Wilcoxon signed rank test to determine if the fetal effect distribution of the set differed significantly from the entire DLPFC transcriptome, using the reduced statistic of one fetal effect per gene.
The significance of genes within each gene set with at least 1 transcript that was preferentially fetally expressed was assessed using a binomial proportion test, compared to background proportions in the genome, at increasing stringency of fetal effects on the log2 scale, 0.5, 1.0, and 1.5 (that is, a 1.4 fold, 2 fold, and 2.8 fold increase on a non-log2 scale,).
RESULTS
Fetal Effect Analysis
As an example of the “fetal effect” metric, Figure 1 displays the neurodevelopmental expression patterns of two genes across the lifespan, ANK3 and HTR2A. ANK3 is preferentially fetally expressed while HTR2A is relatively fetally under expressed, with a fetal effect of 2.42 and −2.85 respectively. Across the transcriptome, of 30,176 probes that mapped to 17,677 genes, 43% of genes expressed a transcript with a fetal effect greater than 0 (and p < 0.05). Twenty-five percent of genes expressed a transcript with a fetal effect greater than 0.5, and 12% of genes expressed a transcript with a fetal effect greater than 1. All probes with a fetal-post natal log2 fold change greater than 0.5 had a p-value less than 0.05 (except for 2 probes). Supplementary Tables 1 lists each gene in a gene set and its ”fetal effect”, that is the log2 fold change, or the calculated regression coefficient.
Figure 1. Fetal Effect, by individual gene.
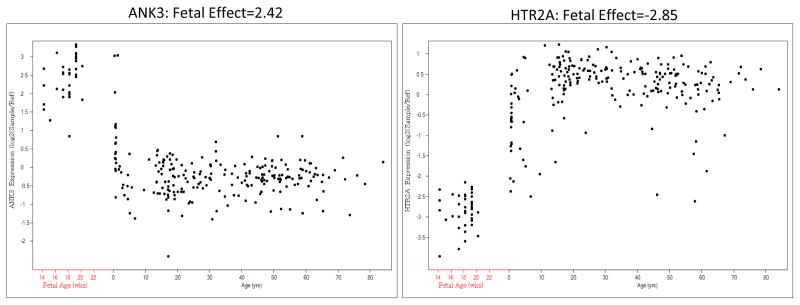
Fetal Effect is Pre vs Post Natal Log2 (Fold Change), or Regression Coefficient n = 269 controls (including 38 fetal samples)
The binomial proportion tests (Table 1) reveal statistically significant preferential fetal expression for the following disease-associated gene groups: syndromic neurodevelopmental disorders (n = 31 genes, 52% of genes with a fetal effect greater than 0.5, p = 3.37×10⁻³), intellectual disability (n = 88 genes, 40% of genes with a fetal effect greater than 0.5, p = 5.53×10⁻³) and autism spectrum disorder (n = 242 genes, 36% of genes with a fetal effect greater than 0.5, p = 3.45×10⁻⁴). In contrast, as illustrated in the density plots and Wilcoxon tests in Figure 2, there was statistically significant fetal underexpression for neurodegenerative disorders (n = 46 genes, one-sided p-value for Wilcoxon signed-rank test in the negative direction = 9.96×10⁻⁴). The dissociation between relative fetal overexpression in genes associated with intellectual disability, syndromic neurodevelopmental disorders, and autism spectrum disorders, and the relative fetal underexpression of genes associated with late-life neurodegenerative disorders, provides conceptual support for the current approach.
Table 1. Fetal Effect by Gene Set and Binomial Test.
The percentage of genes within each gene set that are preferentially fetally expressed by increasing stringency of fetal effect: 0.5, 1.0, and 1.5. Significant two-sided p-value for binomial proportion tests is shown. Red indicates significant elevation compared to the genome and purple indicates significant decrease compared to the genome.
| GENE SET | n Genes | n Genes Mapped to a Probe | % of Genes in Gene Set with Fetal Effect > 0 | p-value (2-sided) | % of Genes in Gene Set with Fetal Effect > 0.5 | p-value (2-sided) | % of Genes in Gene Set with Fetal Effect > 1 | p-value (2-sided) | % of Genes in Gene Set with Fetal Effect > 1.5 | p-value (2-sided) |
|---|---|---|---|---|---|---|---|---|---|---|
| GENOME WIDE | 17,678 | 43% | 25% | 12% | 5% | |||||
| NEURODEVELOPMENTAL DISORDERS | 33 | 31 | 65% | 1.13E-02 | 52% | 3.37E-03 | 23% | 1.50E-01 | 16% | 9.64E-02 |
| SCZ (SRF) Meta-analysis | 40 | 36 | 42% | 8.95E-01 | 22% | 6.57E-01 | 8% | 4.57E-01 | 3% | 3.87E-01 |
| SCZ (PGC) GWAS | 132 | 106 | 50% | 1.13E-01 | 29% | 4.58E-01 | 15% | 3.21E-01 | 6% | 8.02E-01 |
| SCZ CNV | 154 | 113 | 41% | 6.58E-01 | 26% | 9.29E-01 | 11% | 6.94E-01 | 4% | 7.09E-01 |
| SCZ SNV/INDEL | 240 | 212 | 48% | 1.54E-01 | 29% | 2.06E-01 | 15% | 1.75E-01 | 6% | 7.47E-01 |
| ASD CNV | 216 | 176 | 41% | 5.57E-01 | 23% | 5.60E-01 | 9% | 2.30E-01 | 3% | 2.11E-01 |
| ASD DATABASE | 262 | 242 | 49% | 4.58E-02 | 36% | 3.45E-04 | 19% | 4.06E-03 | 11% | 2.98E-03 |
| BIPOLAR DISORDER GWAS | 146 | 123 | 38% | 3.00E-01 | 24% | 8.15E-01 | 11% | 8.95E-01 | 6% | 7.95E-01 |
| INTELLECTUAL DISABLITY | 94 | 88 | 56% | 1.46E-02 | 40% | 5.53E-03 | 22% | 2.50E-02 | 13% | 3.70E-02 |
| NEURODEGENERATIVE DISORDERS | 59 | 46 | 28% | 2.90E-02 | 11% | 1.67E-03 | 4% | 1.37E-02 | 0% | |
| OVERLAP ACROSS ALL CATEGORIES | 62 | 45% | 7.03E-01 | 31% | 3.61E-01 | 16% | 3.50E-01 | 11% | 1.26E-01 | |
| SCZ/ASD CNV OVERLAP | 73 | 45% | 6.74E-01 | 26% | 8.87E-01 | 8% | 2.71E-01 | 4% | 6.55E-01 |
Figure 2. Density Plot of Fetal Effect by Gene Set and Wilcoxon signed-rank test.

The density of each gene set’s fetal effect compared to the fetal effect of the whole genome. The x-axis is the fetal effect, or regression coefficient (pre-natal vs post-natal) and y-axis is the density. Black line indicates the genome and colored line indicates the gene set. Red line indicates significant increase, Purple line indicates significant decrease. Blue line is default, no significant difference in fetal effect of gene set compared to the transcriptome. One-sided p-values are shown for Wilcoxon signed-rank test for each gene set, elevation in the positive direction on the upper right side, and decrease in the negative direction on the upper left side.
Genes associated with schizophrenia by meta-analysis were not significantly different than the genome in relative overall fetal expression (n = 36 genes, 22% of genes with a fetal effect greater than 0.5, p = 0.66) nor were the genes reported in a series of GWAS reports by Ripke et al, 2011 and 2013 (n = 106 genes, 29% of genes with a fetal effect greater than 0.5, p = 0.46). Genes associated with schizophrenia by CNV analysis also were not significantly different compared to the genome in relative fetal expression (n = 113 genes, one sides p-value for Wilcoxon signed-rank test in the positive direction = 0.80) nor were genes associated with schizophrenia by exome sequencing and rare de novo SNV/Indels (n = 212 genes, one sided p-value for Wilcoxon signed rank test in the positive direction = .29).
Genes within loci associated with ASD by CNV analysis did not show any statistically significant difference, neither elevation nor decrease in relative fetal expression, compared to the genome (n = 176 genes, one-sided p-value for Wilcoxon signed-rank test in the positive direction is 0.91 and 0.09 in the negative direction). The gene set associated with bipolar disorder by GWAS also was not significantly different than the genome in prenatal expression abundance (n = 123 genes, 24% with a fetal effect greater than 0.5, p = 0.82). Further, the set of genes that overlapped diagnostic categories (listed in Supplementary Table 2) was not significantly different than the genome in prenatal expression abundance (n = 62 genes, 31% with a fetal effect greater than 0.5, p = 0.36).
Functional Analysis of Prenatally Enriched Genes
Gene set enrichment analysis was performed for the subset of prenatally enriched genes for each gene set (defined as a gene with a “fetal effect” greater than 0.5), compared to the background universe of all brain-expressed genes (Supplementary Table 3 lists significant GO terms). The gene sets that demonstrated preferential fetal expression patterns were enriched for multiple functions pertinent to early cellular development and neurodevelopment. For example, genes associated with syndromic neurodevelopmental disorders were broadly enriched for “generation of neurons” (GO:0048699) and for “system development” (GO:0048731) and genes associated with intellectual disability were enriched for “central nervous system development” (GO:0007417) and “cell projection organization” (GO:0030030).
Genes from the ASD database demonstrated the most significant enrichment of all genes sets for multiple neurodevelopmental processes, including “neurogenesis” (GO:0022008), “axogenesis” (GO:0007409), and “neuron development” (GO:0048666). The group of genes associated with schizophrenia by meta-analysis were enriched for multiple developmental processes including “nervous system development” (GO:0007399) and “neuron differentiation” (GO: 0048468).
Further functional investigation of the prenatally enriched genes consisted of a co-expression analysis, determining which genes are co-expressed during the second trimester with a disease-associated and prenatally enriched gene. As reported in Supplementary Table 4, while some genes revealed isolated patterns of expression, others appeared to be co-expressed with numerous genes in the second trimester, indicating a potential functional concordance or co-regulation.
To determine potential interactions among prenatally enriched genes, Supplementary Figure 1 illustrates the “top scoring” networks from the IPA interaction analysis for genes prenatally enriched in the ASD gene set and for the genes prenatally enriched in the combined SCZ datasets (GWAS studies, CNV association, and SNVs) along with selected functional annotation of individual genes. The networks yielded some noteworthy potential interactions and candidates, for example the 26s Proteasome complex in ASD and the NF-kB complex in schizophrenia.
Secondary Analysis of CNV regions
We performed a secondary post hoc analysis on genes within CNV regions associated with schizophrenia and ASD, under the assumption that these broad regions involve multiple genes, some of which may demonstrate a pattern of preferential fetal expression and therefore be more pathogenically relevant (Supplementary Table 5). Within the loci affected by CNVs associated with schizophrenia and ASD, select genes were indeed preferentially fetally expressed, with one or two genes at each locus demonstrating a comparatively greater fetal effect.
At the 1q21.2 locus, PRKAB2 (fetal effect = 1.39) and BCL9 (fetal effect = 2.02) were most abundant in pre-natal compared to post-natal transcript abundance. The single gene deletion at 16p11.2, NRXN1, also common to both schizophrenia and autism, demonstrated a fetal effect of 1.31. At the 15q13.3 locus, CHRNA7 demonstrated a fetal effect greater than other genes at 0.83, followed by MTMR15 (fetal effect = 0.50). At the 16p11.2 region, PAGR1/C16orf53 (fetal effect = 1.29) and PPP4C (fetal effect = 1.29) were most relatively fetally abundant. Lastly at the 22q11.2 region, CDC45L (fetal effect = 3.89) and HIC2 (fetal effect = 2.32) were most notable in relative fetal abundance, along with ZNF74 (fetal effect = 1.70). Supplementary Tables 5 list the genes within each CNV locus for schizophrenia and ASD, respectively, to enable comparison of genes with a given disease-associated CNV locus.
Secondary Analysis of Genes in ASD Database
Since the genes in the SFARI ASD database were of differing genetic evidence, functional biology (n = 29 genes), genetic association (n = 110 genes), and single rare variants (n = 103 genes), we conducted a secondary analysis to determine if one subgroup was driving the fetal effect. Indeed, while the former two were not significantly different than the genome in fetal effect, the set of genes with single rare variants was highly significantly different than the overall genome (n = 103 genes, one sided p-value for Wilcoxon signed rank test in the positive direction = 4.75×10⁻⁷) with 15% of the genes with a fetal effect > 1.5 (p = 0.007)
As most of our candidate genes were sequence variants based on clinical association studies, we examined an additional ASD gene set, from the recently published study by Voineagu et al. 33 that identified differentially expressed genes between adult autism cases and controls, and also identified weighted gene co-expression networks associated with ASD. We found that the M12 module, reported to be underexpressed in autism samples, and whose eigengene was correlated with disease status, was highly significant for underexpression in fetal samples compared to the fetal expression of the overall genome. (n = 273 genes, p = 1.59×10⁻³⁴). It is important to note that only 18 of the genes in the reported M12 module overlap our combined list of 418 ASD candidate genes, and the ASD etiological candidacy of the remaining genes in the M12 module remains to be determined.
Seconday Analysis of Genes Associated with Schizophrenia by exome sequencing of rare single nucleotide variants (SNVs)
Due to possibly discrepant findings between previously published reports of prenatal enrichment of transcripts of genes associated with schizophrenia by exome sequencing and the current analysis, we further analyzed the subset of genes recently reported by Gulsuner et al, 2013 (Supp Ref 13). While Gulsuner et al. report that genes associated with schizophrenia by exome sequencing of rare variants are expressed during the fetal period, relative and differentially increased prenatal expression was not determined in that report, which is the scope of the current inquiry. Thus, we used the publicly-available BrainSpan RNA sequencing data,34 to evaluate the DLPFC expression of 52 of the reported genes by Gulsuner et al. in fetal samples (n = 17) and post-natal samples (n = 18) and found that only 21 of the 52 genes had a higher fetal mean of RPKM expression, that is 40% were preferentially fetally expressed, corroborating our microarray data of a lack of a preferential fetal expression pattern for this subset of genes.
DISCUSSION
In the present analysis, we calculated a “fetal effect” for each gene expressed in the DLPFC transcriptome by comparing gene expression in the second trimester of fetal development to post-natal expression, and then by comparing the disease-associated gene sets to the genome at large. The principal question we asked was whether genes associated with putatively neurodevelopmental behavioral disorders would show a relatively positive “fetal effect”, i.e. preferential fetal compared with post-natal expression.
Our finding of prenatal enrichment of expression of genes associated with syndromic neurodevelopmental disorders and intellectual disability may be interpreted as a “positive control”. It is probable that syndromic neurodevelopmental disorders and intellectual disability have a fetal pathogenic causality; syndromic neurodevelopmental disorders may be apparent at birth, and intellectual deficiencies are often apparent by infancy or early childhood. In contrast, the counterpoint finding of significant underexpression of genes associated with neurodegenerative disorders is consistent with an onset later in life, and with increased disease-associated gene expression preceding or concurrent with gliosis, apoptosis, and other cellular processes characteristic of neurodegeneration. Thus, notwithstanding the limitations of our approach, which include the imprecision and low biological resolution of surveys of gene expression in postmortem brain based on oligonucleotide arrays (vide infra), our positive results at the two extremes of the spectrum of neurodevelopmental disorders add credibility to the current approach.
Prenatal Expression of ASD-Associated Genes
Genes with rare single nucleotide variants associated with ASD demonstrated a strong pattern of preferential fetal expression. This finding, however, should be viewed in the context of the phenotypic heterogeneity of the reported ASD cases, with different studies using different criteria for ASD, some studies including syndromic forms of ASD or intellectual deficits of varying magnitude. Nevertheless, for the current putative ASD candidate gene list, there is an overall pattern of preferential fetal expression compared to the genome, as might be expected for genes contributing to the pathogenesis of a clinical phenotype present by early childhood.
Prenatal Expression of Schizophrenia-Associated Genes
The current findings do not strongly support a specific fetal pathogenic causality for the composite set of genes associated with schizophrenia, by GWAS, CNV analysis, or exome sequencing of rare variants, at least not a causality that would be reflected in differential fetal expression. We believe, however, that several caveats are important to consider in interpreting these results.
- For genes implicated by GWAS, multiple genes in the LD region of an associated SNP were selected for the current analysis. The probable over-inclusion of genes in disease-associated loci (but not true risk genes) might have decreased the probability of observing an overall fetal expression pattern.-Within each CNV locus associated with schizophrenia (or ASD), one or two genes were enriched in pre-natal abundance, suggesting that they may be particularly relevant to a potential fetal pathogenesis. For example, at the 22q11.2 region, CDC45L showed an especially high relative fetal abundance, the second highest of all of the genes in the present analysis. It encodes the CDC45 protein which forms a complex required for the activation of DNA helicase, and essential for DNA replication.35 At 16p11.2, PAGR1(C16orf53) was preferentially fetally expressed, and recent evidence suggests that this gene modulates glucocorticoid-receptor gene induction.36
- Overall, the gene-set enrichment analyses confirmed the critical functionality of genes that are preferentially fetally expressed and associated with syndromic neurodevelopmental disorders, intellectual disability, and ASD. The results also suggest that genes associated with schizophrenia by meta-analysis are enriched for neurodevelopmental processes, potentially supporting a fetal pathogenic mechanism for schizophrenia.
Future Transcriptome Investigations
As the current evaluation is a quantitative assessment of genes that are preferentially fetally expressed, further investigation should also consider qualitative evaluation of individual specific genes, potential splicing variation and fetal transcriptional activity, and their impact on cellular processes and consequently neuropsychiatric disorders. Within each gene set, there may be a qualitative distinction in fetal expression e.g. splicing or 3′ UTR activity that overrides the significance of an overall quantitative measure.
It is important to consider neurodevelopmental pathogenic models beyond simply a fetal pathogenic effect. For example, a disease-associated gene may exert its pathogenic effect at multiple time points. Alternatively, the disorder may be heterogeneous with different phenotypic subtypes of differing etiology, so that one subtype may have a fetal pathogenic mechanism, while another subtype may have a different pathogenic mechanism. Further, genes may be pathogenic factors in disorders like schizophrenia but not necessarily be differentially upregulated-they may be repressed in programmed development, act at low levels in gradient patterning, or by another mode of regulatory action in fetal development. Also, a pathogenic role for genes in fetal development may be subserved simply by their being expressed at any level in fetal developmental.
The current analysis compared prenatal to post-natal expression but did not further explore the timing of specific peaks and troughs, or specific post-natal trends. Previous transcriptome-level studies of fetal post-mortem samples including those by Kang et al. and Johnson et al. (Ref 30,31) have demonstrated that regional transcriptomes are developmentally regulated. Thus, ongoing refined examination during particular developmental time windows and at regions other than the DLPFC may lead to further functional and ontological insight for an individual gene, gene group, or cluster of co-expressed genes.
From a methodological perspective, our post-mortem analysis is potentially confounded by shifting cellular heterogeneity (post-natal samples are increasingly populated by glial cells, while pre-natal samples are predominantly neuronal) and RNA integrity (higher quality in the pre- than post-natal samples). While the issue of cellular composition warrants further investigation, the present analysis controlled for RIN by considering “negative control genes” associated with RIN. Lastly, the microarray platform is limited by an a priori probe design, which may not include the presence of pathogenic and alternatively spliced fetal transcripts; future RNA sequencing analysis will be advantageous in permitting the investigation of novel, as yet uncharacterized transcripts. Thus, the results of the present study, while provocative, must be viewed as preliminary in exploration of the developmental aspects of psychiatric genetics. As the polygenic and developmental etiology of schizophrenia and other neuropsychiatric disorders becomes increasingly substantiated, and as the hope for gene-based diagnostics and therapeutics grows, a fetal component to pathogenesis is critical to consider, since well prior to the onset of apparent symptoms, in utero disease-associated gene expression may have prophylactic and therapeutic implications.
Supplementary Material
Supplement Data
Supplementary Figure 1a: Network of Prenatally Enriched Genes in ASD: Top scoring interaction network using the Ingenuity algorithm indicating direct (solid line) and indirect (dashed line) interactions, as well as directionality. Gray shading indicates genes/gene products in the prenatally enriched ASD gene set.
Supplementary Figure 1b: Network of Prenatally Enriched Genes in SCZ (GWAS, CNV, SNV): Top scoring interaction network using the Ingenuity algorithm indicating direct (solid line) and indirect (dashed line) interactions, as well as directionality. Gray shading indicates genes/gene products in the prenatally enriched SCZ gene sets.
Supplementary Table 1: “Fetal Effect Analysis”, by disease-associated gene set and gene: Regression analysis results for each gene in a disease-associated gene set that mapped to a microarray probe (t-statistic, Regression Coefficient (i.e. “Fetal Effect), p-value, Adjusted R2)
Supplementary Table 2: Overlap Category: Of the 10 gene sets, the subset of 62 genes that overlapped more than one diagnostic category.
Supplementary Table 3: Gene Set Enrichment Analysis: Gene set enrichment analysis, indicating significant GO terms. Unadjusted p-values, corrected FDR and Bonferonni p-values are listed, and the size of a significant gene set and the count-number of genes enriched for a GO term.
Supplementary Table 3: Co-expression Analysis: Correlation analysis for disease-associated and pre-natally enriched genes (listed by gene set) assessed across 38 fetal samples, using a Pearson’s correlation coefficient threshold of 0.8.
Supplementary Table 5: ASD/CNV Loci: Each gene investigated at an ASD and/or SCZ associated locus and its “fetal effect”/regression coefficient. Genes with a fetal effect greater than 0.5 are highlighted in red and genes with a fetal effect greater than 1 are shaded.
Acknowledgments
Dr. Rebecca Birnbaum is funded by an NIH T32, 5T32MH015330-36
Footnotes
Disclosures:
The authors have no conflicts of interest to report.
MAIN REFERENCES
- 1.Weinberger DR. Implications of normal brain development for the pathogenesis of schizophrenia. Arch Gen Psychiatry. 1987;44(7):660–9. doi: 10.1001/archpsyc.1987.01800190080012. [DOI] [PubMed] [Google Scholar]
- 2.Murray RM, Lewis SW. Is schizophrenia a neurodevelopmental disorder? Br Med J (Clin Res Ed) 1987;295(6600):681–2. doi: 10.1136/bmj.295.6600.681. [DOI] [PMC free article] [PubMed] [Google Scholar]
- 3.Feinberg I. Schizophrenia: caused by a fault in programmed synaptic elimination during adolescence? J Psychiatr Res. 1982–1983;17(4):319–3. doi: 10.1016/0022-3956(82)90038-3. [DOI] [PubMed] [Google Scholar]
- 4.Susser E, Neugebauer R, Hoek HW, Brown AS, Lin S, Labovitz D, Gorman JM. Schizophrenia after prenatal famine: further evidence. Arch Gen Psychiatry. 1996;53:25–31. doi: 10.1001/archpsyc.1996.01830010027005. [DOI] [PubMed] [Google Scholar]
- 5.Brown AS. Exposure to prenatal infection and risk of schizophrenia. Front Psychiatry. 2011 Nov 23;2:63. doi: 10.3389/fpsyt.2011.00063. [DOI] [PMC free article] [PubMed] [Google Scholar]
- 6.Weinberg SM, Jenkins EA, Marazita ML, Maher BS. Minor physical anomalies in schizophrenia: a meta-analysis. Schizophr Res. 2007;89(1–3):72–85. doi: 10.1016/j.schres.2006.09.002. [DOI] [PMC free article] [PubMed] [Google Scholar]
- 7.Lewis SW, Murray RM. Obstetric complications, neurodevelopmental deviance and risk of schizophrenia. J Psychiatr Res. 1987;21(4):413–21. doi: 10.1016/0022-3956(87)90088-4. [DOI] [PubMed] [Google Scholar]
- 8.Geddes JR, Lawrie SM. Obstetric complications and schizophrenia: a meta-analysis. Br J Psychiatry. 1995;167:786–93. doi: 10.1192/bjp.167.6.786. [DOI] [PubMed] [Google Scholar]
- 9.Cannon TD, Yolken R, Buka S, Torrey EF Collaborative Study Group on the Perinatal Origins of Severe Psychiatric Disorders. Decreased neurotrophic response to birth hypoxia in the etiology of schizophrenia. Biol Psychiatry. 2008;64(9):797–802. doi: 10.1016/j.biopsych.2008.04.012. [DOI] [PMC free article] [PubMed] [Google Scholar]
- 10.Nicodemus KK, Marenco S, Batten AJ, Vakkalanka R, Egan MF, Straub RE, Weinberger DR. Serious obstetric complications interact with hypoxia-regulated/vascular-expression genes to influence schizophrenia risk. Mol Psychiatry. 2008;13(9):873–7. doi: 10.1038/sj.mp.4002153. [DOI] [PubMed] [Google Scholar]
- 11.Walker EF. Developmentally moderated expressions of the neuropathology underlying schizophrenia. Schizophr Bull. 1994;20:453–80. doi: 10.1093/schbul/20.3.453. [DOI] [PubMed] [Google Scholar]
- 12.Done DJ, Crow TJ, Johnstone EC, Sacker A. Childhood antecedents of schizophrenia and affective illness: social adjustment at ages 7 and 11. BMJ. 1994;309(6956):699–703. doi: 10.1136/bmj.309.6956.699. [DOI] [PMC free article] [PubMed] [Google Scholar]
- 13.Davidson M, Reichenberg A, Rabinowitz J, Weiser M, Kaplan Z, Mark M. Behavioral and intellectual markers for schizophrenia in apparently healthy male adolescents. Am J Psychiatry. 1999;156(9):1328–35. doi: 10.1176/ajp.156.9.1328. [DOI] [PubMed] [Google Scholar]
- 14.Woodberry KA, Giuliano AJ, Seidman LJ. Premorbid IQ in schizophrenia: a meta-analytic review. Am J Psychiatry. 2008;165(5):579–87. doi: 10.1176/appi.ajp.2008.07081242. [DOI] [PubMed] [Google Scholar]
- 15.Lipska BK, Weinberger DR. Delayed effects of neonatal hippocampal damage on haloperidol-induced catalepsy and apomorphine-induced stereotypic behaviors in the rat. Brain Res Dev Brain Res. 1993;75(2):213–22. doi: 10.1016/0165-3806(93)90026-7. [DOI] [PubMed] [Google Scholar]
- 16.Lodge DJ, Grace AA. Gestational methylazoxymethanol acetate administration: a developmental disruption model of schizophrenia. Behav Brain Res. 2009b;204:306–312. doi: 10.1016/j.bbr.2009.01.031. [DOI] [PMC free article] [PubMed] [Google Scholar]
- 17.Lavin A, Moore HM, Grace AA. Prenatal disruption of neocortical development alters prefrontal cortical neuron responses to dopamine in adult rats. Neuropsychopharmacology. 2005 Aug;30(8):1426–35. doi: 10.1038/sj.npp.1300696. [DOI] [PMC free article] [PubMed] [Google Scholar]
- 18.Jaaro-Peled Hanna, Hayashi-Takagi Akiko, Seshadri Saurav, Kamiya Atsushi, Brandon Nicholas J, Sawa Akira. Neurodevelopmental mechanisms of schizophrenia: understanding disturbed postnatal brain maturation through Neuregulin-1–ErbB4 and DISC1. Trends Neurosci. 2009;32(9):485–495. doi: 10.1016/j.tins.2009.05.007. [DOI] [PMC free article] [PubMed] [Google Scholar]
- 19.Kleinman JE, Law AJ, Lipska BK, Hyde TM, Ellis JK, Harrison PJ, Weinberger DR. Genetic neuropathology of schizophrenia: new approaches to an old question and new uses for postmortem human brains. Biol Psychiatry. 2011;69(2):140–5. doi: 10.1016/j.biopsych.2010.10.032. [DOI] [PMC free article] [PubMed] [Google Scholar]
- 20.Nakata K, Lipska BK, Hyde TM, Ye T, Newburn EN, Morita Y, Vakkalanka R, Barenboim M, Sei Y, Weinberger DR, Kleinman JE. DISC1 splice variants are upregulated in schizophrenia and associated with risk polymorphisms. Proc Natl Acad Sci U S A. 2009;106(37):15873–8. doi: 10.1073/pnas.0903413106. [DOI] [PMC free article] [PubMed] [Google Scholar]
- 21.Tan W, Wang Y, Gold B, Chen J, Dean M, Harrison PJ, Weinberger DR, Law AJ. Molecular cloning of a brain-specific, developmentally regulated neuregulin 1 (NRG1) isoform and identification of a functional promoter variant associated with schizophrenia. J Biol Chem. 2007;282(33):24343–51. doi: 10.1074/jbc.M702953200. [DOI] [PubMed] [Google Scholar]
- 22.Kao WT, Wang Y, Kleinman JE, Lipska BK, Hyde TM, Weinberger DR, Law AJ. Common genetic variation in Neuregulin 3 (NRG3) influences risk for schizophrenia and impacts NRG3 expression in human brain. Proc Natl Acad Sci U S A. 2010;107(35):15619–24. doi: 10.1073/pnas.1005410107. [DOI] [PMC free article] [PubMed] [Google Scholar]
- 23.Tao R, Li C, Newburn EN, Ye T, Lipska BK, Herman MM, Weinberger DR, Kleinman JE, Hyde TM. Transcript-specific associations of SLC12A5 (KCC2) in human prefrontal cortex with development, schizophrenia, and affective disorders. J Neurosci. 2012;32(15):5216–22. doi: 10.1523/JNEUROSCI.4626-11.2012. [DOI] [PMC free article] [PubMed] [Google Scholar]
- 24.Tao R, Cousijn H, Jaffe AE, Burnet P, Philip WJ, Edwards F, Eastwood S, Shin JH, Lane T, Walker MA, Maher BJ, Weinberger DR, Harrison P, Hyde TM, Kleinman JE. A Novel Transcript Fetally Regulated by the Psychosis Risk SNP rs1344706, and Alterations in Schizophrenia. Bipolar Disorder and Major Depression. doi: 10.1001/jamapsychiatry.2014.1079. under review. [DOI] [PMC free article] [PubMed] [Google Scholar]
- 25.Huffaker SJ, Chen J, Nicodemus KK, Sambataro F, Yang F, Mattay V, Lipska BK, Hyde TM, Song J, Rujescu D, Giegling I, Mayilyan K, Proust MJ, Soghoyan A, Caforio G, Callicott JH, Bertolino A, Meyer-Lindenberg A, Chang J, Ji Y, Egan MF, Goldberg TE, Kleinman JE, Lu B, Weinberger DR. A primate-specific, brain isoform of KCNH2 affects cortical physiology, cognition, neuronal repolarization and risk of schizophrenia. Nat Med. 2009;15(5):509–18. doi: 10.1038/nm.1962. [DOI] [PMC free article] [PubMed] [Google Scholar]
- 26.Xu B, Ionita-Laza I, Roos JL, Boone B, Woodrick S, Sun Y, Levy S, Gogos JA, Karayiorgou M. De novo gene mutations highlight patterns of genetic and neural complexity in schizophrenia. Nat Genet. 2012;44(12):1365–9. doi: 10.1038/ng.2446. [DOI] [PMC free article] [PubMed] [Google Scholar]
- 27.Gulsuner S, Walsh T, Watts AC, Lee MK, Thornton AM, Casadei S, Rippey C, Shahin H, Nimgaonkar VL, Go RC, Savage RM, Swerdlow NR, Gur RE, Braff DL, King MC, McClellan JM Consortium on the Genetics of Schizophrenia (COGS); PAARTNERS Study Group. Spatial and temporal mapping of de novo mutations in schizophrenia to a fetal prefrontal cortical network. Cell. 2013;154(3):518–29. doi: 10.1016/j.cell.2013.06.049. [DOI] [PMC free article] [PubMed] [Google Scholar]
- 28.Buka SL, Fan AP. Association of prenatal and perinatal complications with subsequent bipolar disorder and schizophrenia. Schizophr Res. 1999;39(2):113–9. doi: 10.1016/s0920-9964(99)00109-7. [DOI] [PubMed] [Google Scholar]
- 29.Diagnostic and Statistical Manual of Mental Disorders. 5. DSM-5. [Google Scholar]
- 30.Johnson MB, Kawasawa YI, Mason CE, Krsnik Z, Coppola G, Bogdanović D, Geschwind DH, Mane SM, State MW, Sestan N. Functional and evolutionary insights into human brain development through global transcriptome analysis. Neuron. 2009;62(4):494–509. doi: 10.1016/j.neuron.2009.03.027. [DOI] [PMC free article] [PubMed] [Google Scholar]
- 31.Kang HJ, Kawasawa YI, Cheng F, Zhu Y, Xu X, Li M, Sousa AM, Pletikos M, Meyer KA, Sedmak G, Guennel T, Shin Y, Johnson MB, Krsnik Z, Mayer S, Fertuzinhos S, Umlauf S, Lisgo SN, Vortmeyer A, Weinberger DR, Mane S, Hyde TM, Huttner A, Reimers M, Kleinman JE, Sestan N. Spatio-temporal transcriptome of the human brain. Nature. 2011;478(7370):483–9. doi: 10.1038/nature10523. [DOI] [PMC free article] [PubMed] [Google Scholar]
- 32.Colantuoni C, Lipska BK, Ye T, Hyde TM, Tao R, Leek JT, Colantuoni EA, Elkahloun AG, Herman MM, Weinberger DR, Kleinman JE. Temporal dynamics and genetic control of transcription in the human prefrontal cortex. Nature. 2011;478(7370):519–23. doi: 10.1038/nature10524. [DOI] [PMC free article] [PubMed] [Google Scholar]
- 33.Voineagu I, Wang X, Johnston P, Lowe JK, Tian Y, Horvath S, Mill J, Cantor RM, Blencowe BJ, Geschwind DH. Transcriptomic analysis of autistic brain reveals convergent molecular pathology. Nature. 2011 May 25;474(7351):380–4. doi: 10.1038/nature10110. [DOI] [PMC free article] [PubMed] [Google Scholar]
- 34.BrainSpan. Atlas of the Developing Human Brain [Internet] 2011 Funded by ARRA Awards 1RC2MH089921-01, 1RC2MH090047-01, and 1RC2MH089929-01. ©. Available from: http://developinghumanbrain.org.
- 35.Galal WC, Farina A, Tappin I, Hurwitz J. Properties of the human Cdc45/Mcm2-7/GINS helicase complex and its action with DNA polymerase epsilon in rolling circle DNA synthesis. Proc Natl Acad Sci U S A. 2012;109(16):6042–7. doi: 10.1073/pnas.1203734109. [DOI] [PMC free article] [PubMed] [Google Scholar]
- 36.Zhang Z, Sun Y, Cho YW, Chow CC, Simons SS., Jr PA1 protein, a new competitive decelerator acting at more than one step to impede glucocorticoid receptor-mediated transactivation. J Biol Chem. 2013;288(1):42–58. doi: 10.1074/jbc.M112.427740. [DOI] [PMC free article] [PubMed] [Google Scholar]
Associated Data
This section collects any data citations, data availability statements, or supplementary materials included in this article.
Supplementary Materials
Supplement Data
Supplementary Figure 1a: Network of Prenatally Enriched Genes in ASD: Top scoring interaction network using the Ingenuity algorithm indicating direct (solid line) and indirect (dashed line) interactions, as well as directionality. Gray shading indicates genes/gene products in the prenatally enriched ASD gene set.
Supplementary Figure 1b: Network of Prenatally Enriched Genes in SCZ (GWAS, CNV, SNV): Top scoring interaction network using the Ingenuity algorithm indicating direct (solid line) and indirect (dashed line) interactions, as well as directionality. Gray shading indicates genes/gene products in the prenatally enriched SCZ gene sets.
Supplementary Table 1: “Fetal Effect Analysis”, by disease-associated gene set and gene: Regression analysis results for each gene in a disease-associated gene set that mapped to a microarray probe (t-statistic, Regression Coefficient (i.e. “Fetal Effect), p-value, Adjusted R2)
Supplementary Table 2: Overlap Category: Of the 10 gene sets, the subset of 62 genes that overlapped more than one diagnostic category.
Supplementary Table 3: Gene Set Enrichment Analysis: Gene set enrichment analysis, indicating significant GO terms. Unadjusted p-values, corrected FDR and Bonferonni p-values are listed, and the size of a significant gene set and the count-number of genes enriched for a GO term.
Supplementary Table 3: Co-expression Analysis: Correlation analysis for disease-associated and pre-natally enriched genes (listed by gene set) assessed across 38 fetal samples, using a Pearson’s correlation coefficient threshold of 0.8.
Supplementary Table 5: ASD/CNV Loci: Each gene investigated at an ASD and/or SCZ associated locus and its “fetal effect”/regression coefficient. Genes with a fetal effect greater than 0.5 are highlighted in red and genes with a fetal effect greater than 1 are shaded.