Evaluation and rational design of guide RNAs for efficient CRISPR/Cas9-mediated mutagenesis in Ciona (original) (raw)
. Author manuscript; available in PMC: 2018 May 1.
Abstract
The CRISPR/Cas9 system has emerged as an important tool for various genome engineering applications. A current obstacle to high throughput applications of CRISPR/Cas9 is the imprecise prediction of highly active single guide RNAs (sgRNAs). We previously implemented the CRISPR/Cas9 system to induce tissue-specific mutations in the tunicate Ciona. In the present study, we designed and tested 83 single guide RNA (sgRNA) vectors targeting 23 genes expressed in the cardiopharyngeal progenitors and surrounding tissues of Ciona embryo. Using high-throughput sequencing of mutagenized alleles, we identified guide sequences that correlate with sgRNA mutagenesis activity and used this information for the rational design of all possible sgRNAs targeting the Ciona transcriptome. We also describe a one-step cloning-free protocol for the assembly of sgRNA expression cassettes. These cassettes can be directly electroporated as unpurified PCR products into Ciona embryos for sgRNA expression in vivo, resulting in high frequency of CRISPR/Cas9-mediated mutagenesis in somatic cells of electroporated embryos. We found a strong correlation between the frequency of an Ebf loss-of-function phenotype and the mutagenesis efficacies of individual _Ebf_-targeting sgRNAs tested using this method. We anticipate that our approach can be scaled up to systematically design and deliver highly efficient sgRNAs for the tissue-specific investigation of gene functions in Ciona.
Keywords: sgRNA, cardiopharyngeal mesoderm, tunicate
Introduction
A platform for targeted mutagenesis has been recently developed based on the prokaryotic immune response system known as CRISPR/Cas (Clustered Regularly Interspaced Short Palindromic Repeats/CRISPR-Associated) (Barrangou et al. 2007). In its most common derivation for genome engineering applications, the system makes use of a short RNA sequence, known as a single guide RNA (sgRNA) to direct the Cas9 nuclease of Streptococcus pyogenes to a specific target DNA sequence. (Jinek et al. 2012; Cong et al. 2013; Jinek et al. 2013; Mali et al. 2013). Although initial Cas9 binding requires a Protospacer Adjacent Motif (PAM) sequence, most commonly “NGG”, the high specificity of this system is accounted for by Watson-Crick base pairing between the 5′ end of the sgRNA and a 17–20bp “protospacer” sequence immediately adjacent to the PAM (Fu et al. 2014). Upon sgRNA-guided binding to the intended target, Cas9 generates a double stranded break (DSB) within the protospacer sequence. Imperfect repair of these DSBs by non-homologous end joining (NHEJ) often results in short insertions or deletions (indels) that may disrupt the function of the targeted sequence. Numerous reports have confirmed the high efficiency of CRISPR/Cas9 for genome editing purposes (Dickinson et al. 2013; Hwang et al. 2013; Wang et al. 2013a; Koike-Yusa et al. 2014; Paix et al. 2014; Shalem et al. 2014; Wang et al. 2014; Gantz and Bier 2015; Sanjana et al. 2016).
The tunicate Ciona is a model organism for the study of chordate-specific developmental processes (Satoh 2013). The CRISPR/Cas9 system was adapted to induce site-specific DSBs in the Ciona genome (Sasaki et al. 2014; Stolfi et al. 2014). Using electroporation to transiently transfect Ciona embryos with plasmids encoding CRISPR/Cas9 components, we were able to generate clonal populations of somatic cells carrying loss-of-function mutations of Ebf, a transcription-factor-coding gene required for muscle and neuron development, in F0-generation embryos (Stolfi et al. 2014). By using developmentally regulated _cis_-regulatory elements to drive Cas9 expression in specific cell lineages or tissue types, we were thus able to control the disruption of Ebf function with spatiotemporal precision. Following this proof-of-principle, tissue-specific CRISPR/Cas9 has rapidly propagated as a simple yet powerful tool to elucidate gene function in the Ciona embryo (Abdul-Wajid et al. 2015; Cota and Davidson 2015; Segade et al. 2016; Tolkin and Christiaen 2016).
We sought to expand the strategy to target more genes, with the ultimate goal of building a genome-wide library of sgRNAs for systematic genetic loss-of-function assays in Ciona embryos. However, not all sgRNAs drive robust CRISPR/Cas9-induced mutagenesis, and few guidelines exist for the rational design of highly active sgRNAs, which are critical for rapid gene disruption in F0. This variability and unpredictable efficacy demands experimental validation of each sgRNA tested. Individual studies have revealed certain nucleotide sequence features that correlate with high sgRNA expression and/or activity in CRISPR/Cas9-mediated DNA cleavage (Doench et al. 2014; Gagnon et al. 2014; Ren et al. 2014; Wang et al. 2014; Chari et al. 2015; Fusi et al. 2015; Housden et al. 2015; Moreno-Mateos et al. 2015; Wong et al. 2015; Xu et al. 2015; Doench et al. 2016). These studies have been performed in different organisms using a variety of sgRNA and Cas9 delivery methods and show varying ability to predict sgRNA activities across platforms (Haeussler et al. 2016).
Given the uncertainty regarding how sgRNA design principles gleaned from experiments in other species might be applicable to Ciona, we tested a collection of sgRNAs using our own modified tools for tissue-specific CRISPR/Cas9-mediated mutagenesis in Ciona embryos. We describe here the construction and validation of this collection using high-throughput sequencing of PCR-amplified target sequences. This dataset allowed us to develop a practical pipeline for optimal design and efficient assembly of sgRNA expression constructs for use in Ciona.
Results
High-Throughput sequencing to estimate sgRNA-specific mutagenesis rates
Previous studies using CRIsPR/Cas9-based mutagenesis in Ciona revealed that different sgRNAs have varying ability to induce mutations (Sasaki et al. 2014; Stolfi et al. 2014). In order to test a larger number of sgRNAs and identify parameters that may influence mutagenesis efficacy, we constructed a library of 83 sgRNA expression plasmids targeting a set of 23 genes (Table 1). The majority of these genes are transcription factors and signaling molecules of potential interest in the study of cardiopharyngeal mesoderm development. The cardiopharyngeal mesoderm of Ciona, also known as the Trunk Ventral Cells (TVCs), are multipotent cells that invariantly give rise to the heart and pharyngeal muscles of the adult (Hirano and Nishida 1997; Stolfi et al. 2010; Razy-Krajka et al. 2014), thus sharing a common ontogenetic motif with the cardiopharyngeal mesoderm of vertebrates (Wang et al. 2013b; Diogo et al. 2015; Kaplan et al. 2015).
Table 1. Genes targeted for CRISPR/Cas9-mediated mutagenesis.
The 23 genes targeted in the initial screen, each identified here by official gene symbol, aliases, and KyotoHoya identifier.
| # | Gene Symbol Aliases | 2012 KyotoHoya ID | |
|---|---|---|---|
| 1 | Bmp2/4 | Bone morphogenetic protein 2/4 | KH.C4.125 |
| 2 | Ddr | Discoidin Domain Receptor Tyrosine Kinase 1/2 | KH.C9.371 |
| 3 | Ebf | Collier/Olf/EBF; COE | KH.L24.10 |
| 4 | Eph.a | Ephrin type-A receptor.a; Eph1 | KH.C1.404 |
| 5 | Ets.b | Ets/Pointed2 | KH.C11.10 |
| 6 | Fgf4/6 | Fibroblast growth factor 4/6; FGF, unassigned 1 | KH.C1.697 |
| 7 | Fgf8/17/18 | Fibroblast growth factor 8/17/18 | KH.C5.5 |
| 8 | Fgfr | Fibroblast growth factor receptor | KH.S742.2 |
| 9 | Foxf | FoxF | KH.C3.170 |
| 10 | Foxg-r | Foxg-related; Orphan Fox-4; Ci-ZF248 | KH.C5.74 |
| 11 | Fzd5/8 | Frizzled5/8 | KH.C9.260 |
| 12 | Gata4/5/6 | GATA-a | KH.L20.1 |
| 13 | Hand | Heart And Neural Crest Derivatives Expressed 1/2 | KH.C14.604 |
| 14 | Hand-r | Hand-related; Hand-like; NoTrlc | KH.C1.1116 |
| 15 | Htr7-r | 5-Hydroxytryptamine Receptor 7-related | KH.S555.1 |
| 16 | Isl | Islet1/2 | KH.L152.2 |
| 17 | Lef1 | Lef/TCF | KH.C6.71 |
| 18 | Mrf | Muscle regulatory factor; MyoD | KH.C14.307 |
| 19 | Neurog | Neurogenin; Ngn | KH.C6.129 |
| 20 | Nk4 | Nkx2-5; Tinman | KH.C8.482 |
| 21 | Rhod/f | RhoD/F; Rif | KH.C1.129 |
| 22 | Tle.b | Groucho2 | KH.L96.50 |
| 23 | Tll | Tolloid-like; Tolloid | KH.C12.156 |
We followed a high-throughput-sequencing-based approach to quantify the efficacy of each sgRNA, i.e. its ability to cause CRISPR/Cas9-induced mutations in targeted sequences in the genome (Figure 1a–c). The 83 sgRNA plasmids were co-electroporated with Eef1a1>nls∷Cas9∷nls plasmid. The ubiquitous Eef1a1 promoter is active in all cell lineages of the embryo and has been used to express a variety of site-specific nucleases for targeted somatic knockouts in Ciona (Sasakura et al. 2010; Kawai et al. 2012; Sasaki et al. 2014; Stolfi et al. 2014; Treen et al. 2014). Each individual sgRNA + Cas9 vector combination was electroporated into pooled Ciona zygotes, which were then grown at 18°C for 16 hours post-fertilization (hpf; embryonic stage 25)(Hotta et al. 2007). Targeted sequences were individually PCR-amplified from each pool of embryos. Each target was also amplified from “negative control” embryos grown in parallel and electroporated with Eef1a1>nls∷Cas9∷nls and “U6>Negative Control” sgRNA vector. Agarose gel-selected and purified amplicons (varying from 108 to 350 bp in length) were pooled in a series of barcoded “targeted” and “negative control” Illumina sequencing libraries and sequenced using the Illumina MiSeq platform.
Figure 1. Next-Generation Sequencing approach to validating sgRNAs for use in Ciona embryos.
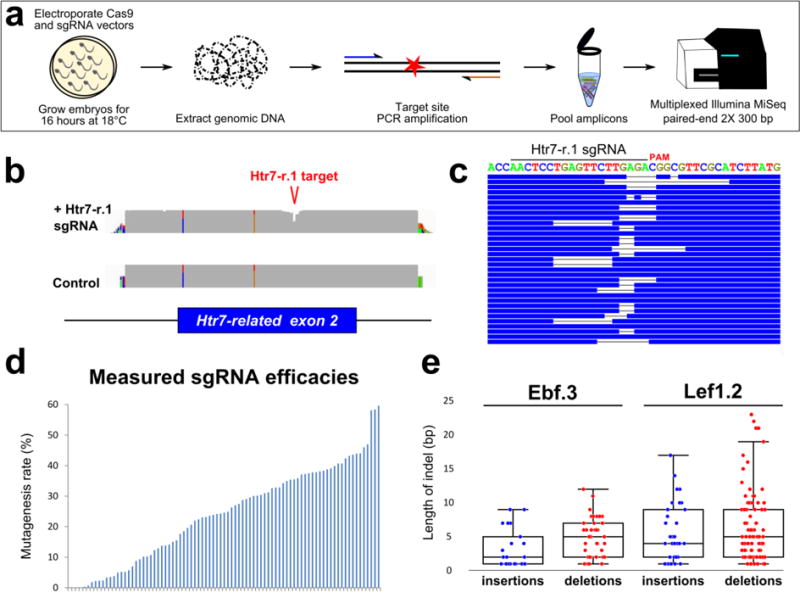
a) Schematic for next-generation sequencing approach to measuring mutagenesis efficacies of sgRNAs expressed in F0 Ciona embryos. See results and materials and methods for details. b) Representative view in IGV browser of coverage (grey areas) of sequencing reads aligned to the reference genome. “Dip” in coverage of reads from embryos co-electroporated with Eef1a1>Cas9 and U6>Htr7-r. 1 sgRNA vector indicates CRISPR/Cas9-induced indels around the sgRNA target site, in the 2nd exon of the Htr7-related (Htr7-r) gene. Colored bars in coverage indicate single-nucleotide polymorphisms/mismatches relative to reference genome. c) Diagram representing a stack of reads bearing indels of various types and sizes, aligned to exact target sequence of Htr7-r. 1 sgRNA. d) Plot of mutagenesis efficacy rates measured for all sgRNAs, ordered from lowest (0%) to highest (59.63%). Each bar represents a single sgRNA. e) Box-and-whisker plots showing the size distribution of insertions and deletions caused by Ebf.3 or Lef1.2 sgRNAs.
Alignment of the resulting reads to the reference genome sequence (Satou et al. 2008) revealed that targeted sites were represented on average by 16,204 reads, with a median of 3,899 reads each (Supplementary Table 1). The ability of each sgRNA to guide Cas9 to induce DSBs at its intended target was detected by the presence of insertions and deletions (indels) within the targeted protospacer + PAM. The ratio of [indels]/[total reads] represents our estimation of the mutagenesis efficacy of the sgRNA (Figure 1b–d, Supplementary Table 1). For each mutation, an unknown number of cell divisions occur between the moment Cas9 induces a DSB and the time of sample collection and genomic DNA extraction. This prevents us from quantifying the true mutagenesis rates. However, we can surmise that this applies comparably to all sgRNAs, such that our values still represent an accurate ranking of mutagenesis efficacy.
For simplicity, we did not count single nucleotide point mutations, even though a fraction of them may result from NHEJ-repair of a DSB event. Our data indicated that all sgRNAs (with the exception of Neurog.2) were able to induce DSBs, with estimated efficacies varying from 0.05% (Ebf.4) to 59.63% (Htr7-r.2). Although each sgRNA was tested only once, we did not observe any evidence of electroporation variability or batch effects that may have confounded our estimates (Supplementary Figure 1).
This conservative approach most likely underestimates the actual mutagenesis rates. First, we excluded point mutations potentially resulting from imperfect DSB repair. Second, but more importantly, amplicons from transfected cells are always diluted by wild-type sequences from untransfected cells in the same sample, due to mosaic incorporation of sgRNA and Cas9 plasmids. Indeed, we previously observed an enrichment of mutated sequences amplified from reporter transgene-expressing cells isolated by magnetic-activated cell sorting (representing the transfected population of cells) relative to unsorted cells (representing mixed transfected and untransfected cells) (Stolfi et al. 2014). In that particular example, the estimated mutagenesis efficacy induced by the Ebf.3 sgRNA was 66% in sorted sample versus 45% in mixed sample. This suggests the actual efficacies of some sgRNAs may be up to 1.5-fold higher than their estimated rates.
Analysis of unique indels generated by the activity of two efficient sgRNAs, Ebf.3 and Lef1.2, indicated a bias towards deletions rather than insertions, at a ratio of roughly 2:1 deletions:insertions (Figure 1e). However, these two sgRNAs generated different distributions of indel lengths, indicating indel position and size may depend on locus-specific repair dynamics as previously shown (Bae et al. 2014).
Numerous studies have reported the potential off-target effects of CRISPR/Cas9 in different model systems (Fu et al. 2013; Hsu et al. 2013; Pattanayak et al. 2013; Cho et al. 2014). For this study, we were able to mostly select highly specific sgRNAs, owing to the low frequency of predicted off-target sequences in the small, A/T-rich Ciona genome (see Discussion for details). To test the assumption that off-target DSBs are unlikely at partial sgRNA seed-sequence matches, we analyzed the mutagenesis rates at two potential off-target sites that matched the protospacer at the 10 and 8 most PAM-proximal positions of the Ebf.3 and Fgf4/6.1 sgRNAs, respectively. We did not detect any mutations in 5,570 and 6,690 reads mapped to the two loci, respectively, suggesting high specificity of the sgRNA:Cas9 complex to induce DSBs only at sites of more extensive sequence match.
Identifying sequence features correlated with sgRNA efficacy
We analyzed our dataset for potential correlations between target sequence composition and sgRNA-specific mutagenesis rate (excluding the Bmp2/4.1 sgRNA because only two reads mapped to its target sequence). We hypothesized that, if mutagenesis efficacy can be predicted by nucleotide composition at defined positions in the protospacer and flanking sequences, then comparing the target sequences of the most or least active sgRNAs in our dataset should reveal features that affect CRISPR/Cas9 efficacy in Ciona. To that effect, we performed nucleotide enrichment analyses for the top and bottom 25% sgRNAs ranked by measured mutagenesis efficacy (Figure 2)(Schneider and Stephens 1990; Crooks et al. 2004). For the top 25% sgRNAs, guanine was overrepresented in the PAM-proximal region, while the ambiguous nucleotide of the PAM (‘N’ in ‘NGG’) was enriched for cytosine. We also observed an overall depletion of thymine in the protospacer sequence for the top 25% sgRNAs, likely due to premature termination of PolIII-driven transcription as previously demonstrated (Wu et al. 2014). Among the bottom 25% sgRNAs, we observed a higher representation of cytosine at nucleotide 20 of the protospacer (Figure 2). All these observations are consistent with the inferences drawn from previous studies, suggesting that certain sgRNA and target sequence features that influence Cas9:sgRNA-mediated mutagenesis rates are consistent across different experimental systems (Gagnon et al. 2014; Ren et al. 2014; Wu et al. 2014; Chari et al. 2015; Moreno-Mateos et al. 2015; Haeussler et al. 2016).
Figure 2. Correlations between sgRNA sequence composition and mutagenesis efficacy.
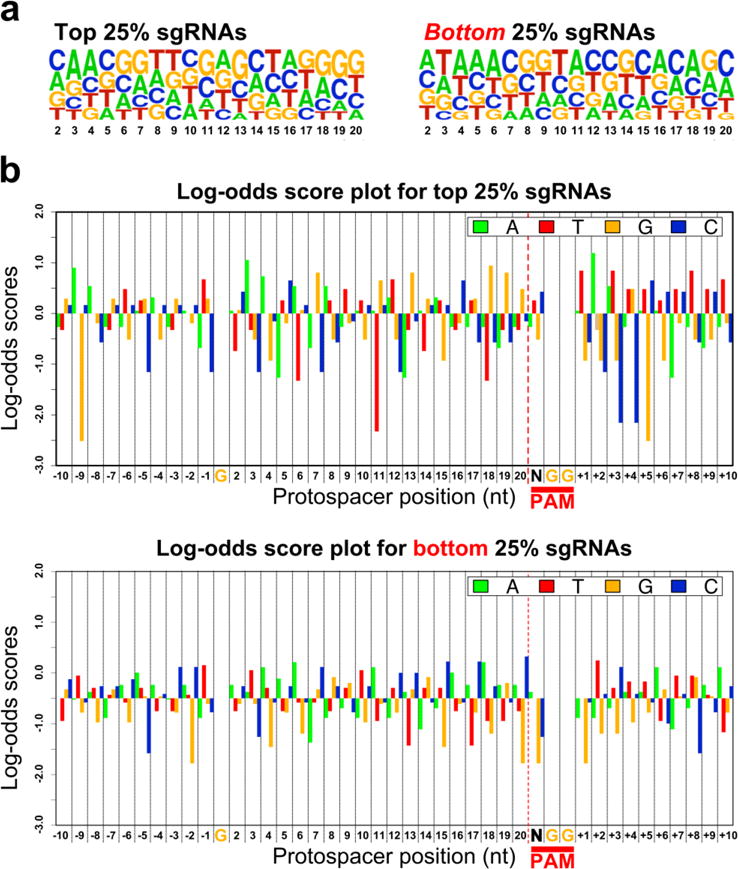
a) WebLogos representing the nucleotide composition at each variable position of the protospacer (nt 2–20, X axis), in top 25% and bottom 25% performing sgRNAs. b) Log-odds scores depicting the frequency of occurrence for nucleotides in the top 25% and bottom 25% sgRNAs, at all positions of the protospacer, PAM, and flanking regions. Position “1” of the protospacer has been omitted from the analysis, due to this always being “G” for PolIII-dependent transcription of U6-promoter-based vectors. Likewise, the “GG” of the PAM has also been omitted, as this sequence is invariant in all targeted sites. Positive and negative log-odds scores reflect abundance and depletion, respectively, of a specific nucleotide at a given position relative to its random occurrence in our sample space. See materials and methods for details.
Several studies in different model organisms have similarly examined the nucleotide preferences amongst sgRNAs inducing high or low rates of mutagenesis, and put forth predictive heuristics and/or algorithms for the rational design of highly active sgRNAs (Doench et al. 2014; Gagnon et al. 2014; REN et al. 2014; WANG et al. 2014; CHARI et al. 2015; FUSI et al. 2015; HOUSDEN et al. 2015; Moreno-Mateos et al. 2015; Wong et al. 2015; Xu et al. 2015; Doench et al. 2016). These various algorithms have been evaluated, summarized, and aggregated by the CRISPR sgRNA design web-based platform CRISPOR (Haeussler et al. 2016). According to this metaanalysis, the “Fusi/Doench” algorithm (“Rule Set 2”)(FUSI et al. 2015; DOENCH et al. 2016) is the best at predicting the activities of sgRNA transcribed in vivo from a U6 small RNA promoter transcribed by RNA Polymerase III (PolIII), while CRISPRscan is recommended for sgRNAs transcribed in vitro from a T7 promoter (Moreno-Mateos et al. 2015).
Ciona rearing conditions differ from most other model systems, being a marine invertebrate that develops optimally at 16–24°C (Bellas et al. 2003). Moreover, most CRISPR/Cas9-based experiments in Ciona rely on in vivo transcription of sgRNAs built with a modified “F+E” backbone (Chen et al. 2013) by a Ciona-specific U6 promoter (Nishiyama and Fujiwara 2008). We used CRISPOR to calculate predictive scores for all sgRNAs in our data set and compare these scores to our mutagenesis efficacy measurements for each (Figure 3a, Supplementary Table 1). We found that indeed the Fusi/Doench score best correlated with our measured sgRNA efficacies, with a Spearman’s rank correlation coefficient (rho) of 0.435 (p=3.884e-05**)(**Figure 3a). CRISPRscan, the algorithm based on _in vitro_-, T7-transcribed sgRNAs injected into zebrafish, was less predictive (rho = 0.344, p=0.001435)(Supplementary Table 1), supporting the conclusion that sgRNA expression method (e.g. U6 vs. T7) accounts for an important parameter when choosing an sgRNA design algorithm. Scores computed by other published algorithms available on the CRISPOR platform did not yield good correlations with our measurements (Supplementary Table 1), indicating these are perhaps not suited for predicting sgRNA activity in Ciona.
Figure 3. Using Fusi/Doench scores to predict mutagenesis efficacies of sgRNAs in Ciona.
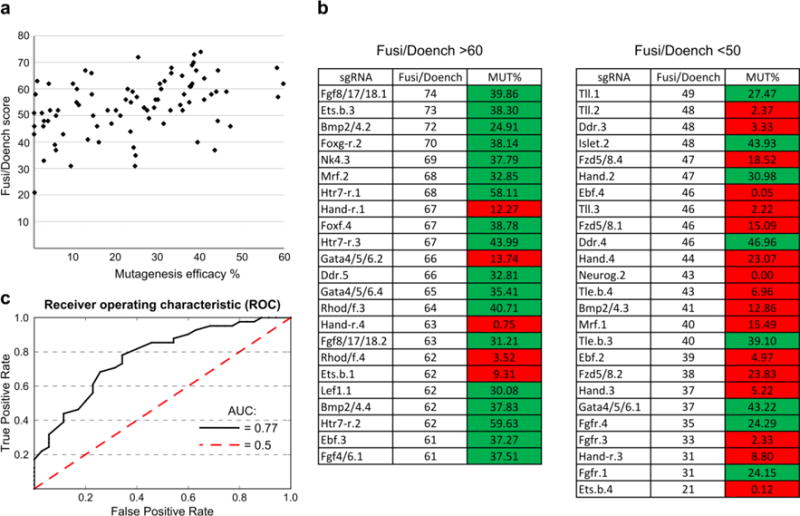
a) Mutagenesis efficacy rate of each sgRNA plotted against the same sgRNA’s Fusi/Doench algorithm score, obtained from CRISPOR. The Spearman’s rank correlation coefficient (rho) is 0.435 (p = 3.884e-05). b) sgRNAs grouped by sorted Fusi/Doench predicted scores (left: >60; right: <50). 18 of 23 sgRNAs of Fusi/Doench score over 60 showed a measured mutagenesis efficacy (MUT%) over 24%, classified as “good” (shaded green). In contrast, only 4 from the same set had a MUT% under 24%, classified as “bad”. “Good” and “bad” classifications were based on phenotype frequency in F0 (see text for details). Out of 25 sgRNAs with Fusi/Doench score under 50, 17 were “bad”, while only 8 were “good”. **c)** A Receiver Operating Characteristic (ROC) curve assesses the credibility of using Fusi/Doench score cutoff (from 0 to 100) to classify sgRNAs as either “good” (>24.5% efficacy) or “bad” (≤24.5% efficacy). Using Fusi/Doench cutoffs as such a classifier returns an AUC of 0.77 (black line), while an AUC of 0.5 (dashed red line) represents the performance of a classifier solely based on random chance. The optimal Fusi/Doench cutoff (above which a score is likely to indicate “good” sgRNAs) was found to be between 50 and 55. See materials and methods and Supplementary Table 2 for details.
In a previous study, highly penetrant, tissue-specific loss-of-function phenotypes in F0 embryos were elicited using the Ebf.3 sgRNA (Stolfi et al. 2014), which in our current study had a measured mutagenesis efficacy of 37%. Further comparison of measured mutagenesis efficacy and mutant phenotype frequency for a series of _Ebf_-targeting sgRNAs revealed that an estimated sgRNA efficacy at least 25% correlated with over 70% reduction in the frequency of embryos expressing an Islet reporter construct (see below and Figure 6). We thus reasoned that a mutagenesis efficacy of ~25% would be the minimum threshold of acceptable sgRNA activity for loss-of-function assays in F0. Within our dataset, among the sgRNAs that had a Fusi/Doench score >60, 18 of 23 (78%) had a mutagenesis efficacy rate over 24% (Figure 3b). In contrast, only 8 of 25 (32%) of sgRNAs with a Fusi/Doench score <50 had an efficacy over 24% (Figure 3b). Indeed, a receiver operating characteristic (RoC) analysis showed an area under the curve (AUC) of 0.77 when using Fusi/Doench score as a classifier of “good” (>24.5% efficacy) vs. “bad” (≤24.5%) sgRNAs (Figure 3c). The most accurate Fusi/Doench score cutoffs appeared to be between 50 and 55, when taking both specificity and sensitivity into account (Supplementary Table 2, Supplementary Figure 2). However, if the number of candidate sgRNAs is not limiting, it may be more desirable to use a Fusi/Doench score cutoff of 60 in order to avoid false positives (i.e., sgRNAs that are predicted as “good” when in reality they are “bad”). Thus, for Ciona, we recommend using CRISPOR to select sgRNAs with Fusi/Doench scores >60 and avoid those with Fusi/Doench <50. We believe this approach will significantly streamline the search for suitable U6 promoter-driven sgRNAs targeting one’s gene of interest.
Figure 6. Linear relationship between sgRNA efficacy and mutant phenotype frequency in F0.
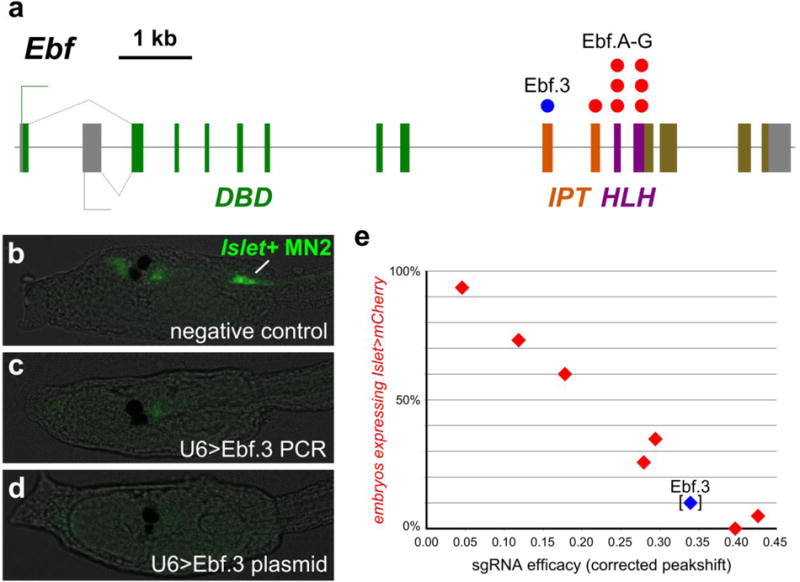
a) Diagram of Ebf locus, showing exons coding for DNA-binding (DBD), IPT, and helix-loop-helix (HLH) domains. Colored dots indicate exons targeted by the _Ebf_-targeting sgRNAs used to validate the OSO-PCR method for genetic loss-of-function. b) Larvae co-electroporated with Sox1/2/3>nls∷Cas9∷nls, Islet>eGFP, and 25 μl (~2.5 μg) unpurified U6>NegativeControl PCR or c) 25 μl (~2.5 μg) unpurified U6>Ebf.3 PCR, or d) 25 μg U6>Ebf.3 plasmid. Islet>eGFP reporter plasmid is normally expressed in MN2 motor neurons (“Islet+ MN2”, green), which is dependent on Ebf function. Islet>eGFP was expressed in MN2s in 75 of 100 negative control embryos. In embryos electroporated with unpurified U6>Ebf.3 PCR products or U6>Ebf.3 plasmid, only 16 of 100 and 17 of 100 embryos, respectively, had Islet>eGFP expression in MN2s. This indicates similar loss of Ebf function in vivo by either unpurified PCR or purified plasmid sgRNA delivery method. c) Plot comparing mutagenesis efficacies of the OSO-PCR-generated sgRNAs indicated in panel (a) (measured by Sanger sequencing, see text for details) and the ability to cause the Ebf loss-of-function phenotype (loss of Islet>mCherry reporter expression in MN2s in Sox1/2/3>H2B∷eGFP+ embryos). The nearly perfect inverse correlation between sgRNA mutagenesis efficacy and Islet>mCherry expression indicates a linear relationship between sgRNA activity and mutant phenotype frequency in electroporated embryos. Ebf.3 sgRNA data point is bracketed, because its mutagenesis efficacy was not measured by Sanger sequencing but comes from the NGS data collected in this study.
Multiplexed targeting with CRISPR/Cas9 generates large deletions in the Ciona genome
Large deletions of up to 23 kb of intervening DNA resulting from NHEJ between two CRISPR/Cas9-induced DSBs have been reported in Ciona (Abdul-Wajid et al. 2015). For functional analyses of protein-coding genes, such deletions would more likely produce null mutations than small deletions resulting from the action of lone sgRNAs. To test whether we could cause tissue-specific large deletions in F0 embryos, we targeted the forkhead/winged helix transcription-factor-encoding gene Foxf (Figure 4a), which contributes to cardiopharyngeal development in Ciona (Beh et al. 2007). We co-electroporated Eef1a1>nls∷Cas9∷nls with sgRNA vectors Foxf.4 and Foxf.2 (with induced mutagenesis rates of 39% and 18%, respectively). We extracted genomic DNA from electroporated embryos and PCR-amplified the sequence spanning both target sites. We obtained a specific ~300 bp PCR product corresponding to the amplified region missing the ~2.1 kbp of intervening sequence between the two target sites (Figure 4b). Cloning the deletion band and sequencing individual clones confirmed that the short PCR product corresponds to a deletion of most of the Foxf first exon and 5′ _cis_-regulatory sequences (Beh et al. 2007). We did not detect this deletion using genomic DNA extracted from embryos electroporated with either sgRNA alone. Similar deletion PCR products were observed, cloned, and sequenced for other genes including Nk4, Fgfr, Mrf, Htr7-related, Bmp2/4, and Hand, using pairs of highly mutagenic sgRNAs (Supplementary Figure 3). The largest deletion recorded was ~3.6 kbp, with sgRNAs Nk4.2 (46% efficacy) and Nk4.3 (38% efficacy), entirely removing the sole intron of Nk4 and small portions of the flanking exons. The sgRNAs targeting Mrf were shown to inhibit its function and subsequent siphon muscle development (Tolkin and Christiaen 2016).
Figure 4. Combinatorial targeting of Foxf results in large deletions.
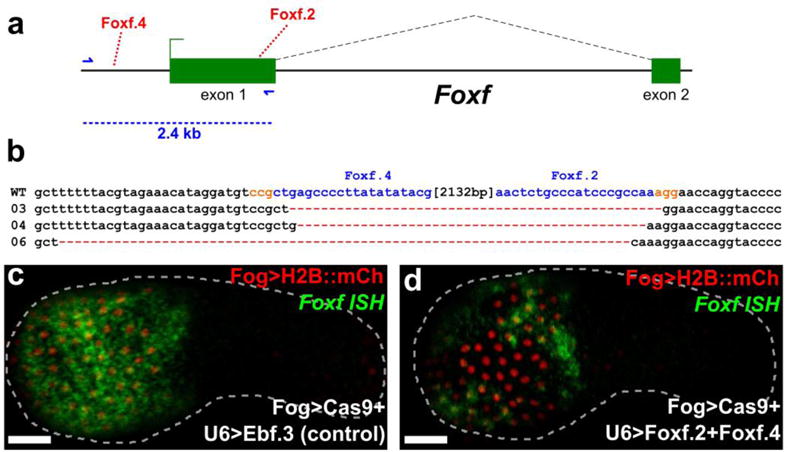
a) Diagram of Foxf locus, showing positions targeted by Foxf.4 and Foxf.2 sgRNAs. Foxf.4 targets a non-coding, _cis_-regulatory sequence 881 base pairs (bp) upstream of the transcription start site of Foxf. Foxf.2 targets a coding sequence in exon 1 of Foxf. The distance between the target sites is 2132 bp, and encompasses most of exon 1, the core promoter, and _cis_-regulatory modules that drive Foxf expression in the head epidermis and trunk ventral cells (TVCs) (BEH et al. 2007). Blue arrows indicate primers used to amplify the region between the target sites. In wild-type embryos, the resulting PCR product is ~2.4 kilobase pairs (kbp). b) Alignment of cloned PCR products amplified using the primers indicated in (a), from wild-type (wt) embryos, and from embryos electroporated with 25 μg Eef1a1>nls∷Cas9∷nls and 50 μg each of U6>Foxf.2 and U6>Foxf.4. Colonies 03, 04, and 06 shown containing large deletions between the approximate sites targeted by the two sgRNAs, indicating non-homologous end-joining (NHEJ) repair from two separate double stranded break events as a result of combinatorial action of Foxf.2 and Foxf.4 sgRNAs. c) In situ hybridization for Foxf (green) showing strong expression throughout the head epidermis in embryos electroporated with 10 μg Fog>H2B∷mCherry (red), 50 μg Fog>nls∷Cas9∷nls and 45 μg of U6>Ebf.3. Foxf expression is essentially wild-type, as Ebf function is not required for activation of Foxf in the epidermis. d) In situ hybridization for Foxf (green) showing patchy expression in the head epidermis of embryos electroporated with 10 μg Fog>H2B∷mCherry (red), 50 μg Fog>nls∷Cas9∷nls and 45 μg each of U6>Foxf.2 and U6>Foxf.4. Loss of in situ signal in some transfected head epidermis cells indicates loss of Foxf activation, presumably through deletion of all or part of the upstream _cis_-regulatory sequences by CRISPR/Cas9. Scale bars = 25 μm.
Foxf is expressed in TVCs and head epidermis (Figure 4c), the latter of which is derived exclusively from the animal pole (Nishida 1987; Imai et al. 2004; Pasini et al. 2006; Beh et al. 2007). Because the ~2.1 kbp deletion introduced in the Foxf locus excised the epidermal enhancer and basal promoter (Beh et al. 2007), we sought to examine the effects of these large deletions on Foxf transcription. We used the cis-regulatory sequences from Zfpm (also known as Friend of GATA, or Fog, and referred to as such from here onwards) to drive Cas9 expression in early animal pole blastomeres (Rothbächer et al. 2007). We electroporated Fog>nls∷Cas9∷nls together with Foxf.2 and Foxf.4 sgRNA vectors and Fog>H2B∷mCherry, and raised embryos at 18°C for 9.5 hpf (early tailbud, embryonic stage 20). We performed whole mount mRNA in situ hybridization to monitor Foxf expression, expecting it to be silenced in some epidermal cells by tissue-specific CRISPR/Cas9-induced deletions of the _Foxf cis_-regulatory sequences on both homologous chromosomes in each cell. Indeed, we observed patches of transfected head epidermal cells (marked by H2B∷mCherry) in which Foxf expression was reduced or eliminated (Figure 4d). This was in contrast to the uniform, high levels of Foxf expression observed in “control” embryos electroporated with Ebf.3 sgRNA (Ebf is unlikely to be involved in Foxf regulation in the epidermis where it is not expressed, Figure 4c). Taken together, these results indicate that, by co-electroporating two or more highly active sgRNAs targeting neighboring sequences, one can frequently generate large deletions in the Ciona genome in a tissue-specific manner.
Rapid generation of sgRNA expression cassettes ready for embryo transfection
CRISPR/Cas9 is an efficient and attractive system for targeted mutagenesis in Ciona, but cloning individual sgRNA vectors is a labor-intensive, rate-limiting step. To further expedite CRISPR/Cas9 experiments, we adapted a one-step overlap PCR (OSO-PCR) protocol to generate U6 promoter>sgRNA expression “cassettes” for direct electroporation without purification (Figure 5, Supplementary Figure 4, see Materials and Methods and Supplementary Protocol for details). We tested the efficacy of sgRNAs expressed from these unpurified PCR products, by generating such expression cassettes for the validated Ebf.3 sgRNA. We electroporated Eef1a1>nls∷Cas9∷nls and 25 μl (corresponding to ~2.5 μg, see Materials and Methods and Supplementary Figure 5) of unpurified, U6>Ebf.3 sgRNA OSO-PCR or U6>Ebf.3 sgRNA traditional PCR products (total electroporation volume: 700 μl). Next-generation sequencing of the targeted Ebf.3 site revealed mutagenesis rates similar to those obtained with 75 μg of U6>Ebf.3 sgRNA plasmid (Supplementary Table 1). This was surprising given the much lower total amount of DNA electroporated from the PCR reaction relative to the plasmid prep (2.5 μg vs. 75 μg). This discrepancy could indicate a higher efficiency of transcription of linear vs. circular transfected DNA, though more thorough analyses are warranted to investigate the behavior of linear DNA in Ciona embryos.
Figure 5. One-step Overlap Polymerase Chain Reaction (OSO-PCR) for the high-throughput construction of sgRNA expression cassette libraries.
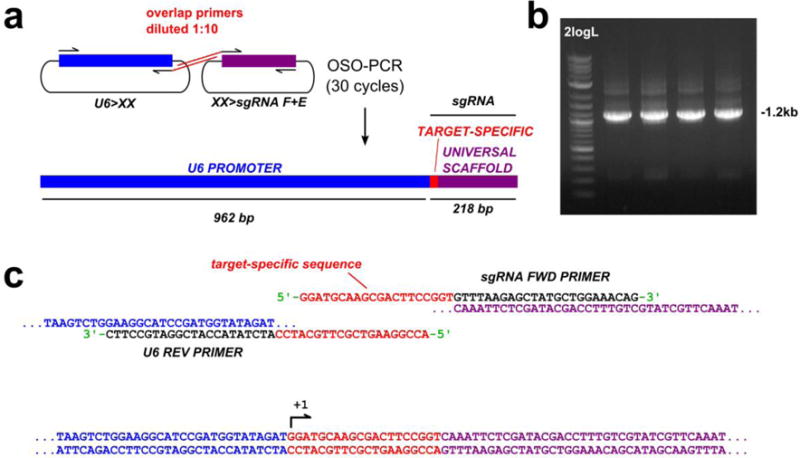
a) Diagram of OSO-PCR for amplification of U6>sgRNA expression cassettes in which the target-specific sequence of each (red) is encoded in complementary overhangs attached to universal primers. 1:10 dilution of these primers ensures that the overlap product, the entire U6>sgRNA cassette, is preferentially amplified (see methods for details). b) Agarose gel electrophoresis showing products of four different U6>sgRNA OSO-PCRs. The desired product is ~1.2 kilobase pairs (kbp) long. 2logL = NEB 2-Log DNA ladder. c) Detailed diagram of how the overlap primers form a target-specific bridge that fuses universal U6 promoter and sgRNA scaffold sequences.
To assess whether unpurified sgRNA PCR cassettes could be used in CRISPR/Cas9-mediated loss-of-function experiments in F0 embryos, we assayed the expression of an Islet reporter transgene in MN2 motor neurons (RYAN et al. 2016), which depends upon Ebf function (STOLFI et al. 2014). Indeed, Islet>GFP expression was downregulated in embryos electroporated with Sox1/2/3>nls∷Cas9∷nls and 25 μl of unpurified U6>Ebf.3 traditional PCR or 25μg U6>Ebf.3 plasmid, but not with 25 μl (~2.5 μg) of unpurified U6>Negative Control sgRNA PCR cassette (Figure 6a–d). Taken together, these results indicate that unpurified PCR products can be used in lieu of plasmids to express sgRNAs for tissue-specific CRISPR/Cas9-mediated mutagenesis in Ciona embryos.
Correlation between sgRNA efficacy and mutant phenotype penetrance
Since we measured a wide range of mutagenesis efficacies across our library of 83 sgRNAs, we wanted to assess how this variability correlates with mutant phenotype penetrance. One possibility is that sgRNA efficacies and frequencies of mutant phenotypes in F0 are linearly correlated. Alternatively, mutant phenotypes might only be observed at distinct thresholds of sgRNA activity.
To test this, we designed 7 additional sgRNAs (Ebf.A through Ebf.G) targeting the IPT and HLH domain-coding exons of Ebf (Figure 6a,e, Supplementary Table 3). We generated these sgRNA expression cassettes by OSO-PCR, and co-electroporated 25 μl of each reaction with either 25 μg Eef1a1>nls∷Cas9∷nls (for mutagenesis efficacy sequencing) or 40 μg Sox1/2/3>nls∷Cas9∷nls + 15 μg Sox1/2/3>H2B∷eGFP + 40 μg Islet>mCherry (for phenotype assay). sgRNA efficacies were measured by direct Sanger sequencing of the target region PCR-amplified from larvae electroporated with the former combination (see Materials and methods for details), and Islet>mCherry expression in H2B∷eGFP+ motor neurons was scored in larvae electroporated with the latter mix.
Quantification of indel-shifted electrophoresis chromatogram peaks (“Peakshift” assay) revealed sgRNA mutagenesis efficacies ranging from 5% to 43% (Figure 6e, Supplementary Table 3). Of note, the sgRNA with the lowest efficacy (Ebf.E) was clearly hampered by a naturally occurring SNP that eliminates the PAM (NGG to NGA) in a majority of haplotypes. In parallel, the proportion of transfected embryos Islet>mCherry expression was observed to vary between 0% and 94%. When this was plotted against the measured mutagenesis efficacies, we observed a nearly perfect linear correlation between the mutant phenotype (loss of Islet>mCherry expression) and Ebf mutagenesis (Figure 6e, Supplementary Table 3). Taken together, these results suggest that highly efficient sgRNAs can be generated from OSO-PCR cassettes and validated for loss-of-function studies by Sanger sequencing. The Sanger sequencing-based peakshift assay is highly reproducible and approximates the efficacy rates estimated by NGS (Supplementary Table 6). As such, we recommend the peakshift assay as a cheap, fast alternative for testing sgRNA activity in Ciona embryos.
Genome-wide design and scoring of sgRNAs for Ciona
While Ciona researchers will find the Fusi/Doench scoring system and the OSO-PCR method useful for sgRNA expression cassette design and assembly, we hoped to further empower the community by pre-emptively designing all possible sgRNAs with a unique target site within 200 bp of all Ciona exonic sequences. We computationally identified 3,596,551 such sgRNAs. We have compiled all sgRNA sequences and their corresponding specificity and efficiency scores (including Fusi/Doench). They are available as a UCSC Genome Browser track for the Ci2 genome assembly (http://genome.ucsc.edu/)[FOR PEER REVIEW ONLY: http://genome-test.soe.ucsc.edu], with links to CRISPOR for off-target prediction and automated OSO-PCR primer design. This track is freely available for download to use on other browsers, like those of specific interest to the tunicate community such as ANISEED (Brozovic et al. 2015) or GHOST (Satou et al. 2005).
Discussion
We have built a library of 83 plasmid vectors for the in vivo expression of sgRNAs targeting 23 genes expressed in the cardiopharyngeal mesoderm and surrounding tissues, mostly hypothesized to be involved in regulating the specification of heart and/or pharyngeal muscles in Ciona, even though many have complex expression patterns and probably pleiotropic functions. We have also established reliable protocols for the validation of sgRNA efficacy in electroporated Ciona embryos by either next-generation sequencing or Sanger sequencing. This has allowed us to estimate the activity of all these sgRNAs, which are ready to be used for ongoing and future functional studies.
By analyzing correlations between target sequence nucleotide composition and sgRNA mutagenesis efficacy, we identified sgRNA sequence features that may contribute to Cas9:sgRNA activity. Some of these sequence features have been identified in previous CRISPR/Cas9-mediated mutagenesis screens performed in other metazoan model organisms, suggesting that these are determined by the intrinsic properties of sgRNAs and/or Cas9 (Doench et al. 2014; Gagnon et al. 2014; Ren et al. 2014; Chari et al. 2015; Moreno-Mateos et al. 2015). For instance, sgRNA efficacy is correlated with increased guanine content in the PAM-proximal nucleotides of the sgRNA, postulated to be due to increased sgRNA stability by G-quadruplex formation (Moreno-Mateos et al. 2015). This would explain the specific enrichment for guanine but not cytosine, even if both could in theory augment sgRNA folding or binding to target DNA. We also encountered a depletion of thymine and cytosine in the PAM-proximal nucleotides of the protospacers for highly active sgRNAs. The strong negative correlation between sgRNA efficacy and thymine content of the protospacer is easily attributed to our use of the PolIII-dependent U6 promoter to express our sgRNAs. It has been shown that termination of transcription by PolIII can be promoted by degenerate poly-dT tracts (NIELSEN et al. 2013). A high number of non-consecutive thymines clustered in the protospacer could thus result in lower sgRNA expression level due to premature termination of sgRNA transcription (STOLFI et al. 2014; Wu et al. 2014). Similarly, adenines are thought to contribute to the instability of sgRNAs (Moreno-Mateos et al. 2015), suggesting that CRISPR/Cas9 mutagenesis efficacies might be primarily determined by sgRNA transcription and degradation rates, which will vary depending on the species studied and the mode of sgRNA delivery (e.g. in vitro vs. in vivo synthesis).
Despite the lack of biological replicates for the NGS-based measurements, we have presented different data suggesting that sgRNA mutagenesis efficacies are reproducible between experiments, and not greatly affected by electroporation variability. First and foremost, we found a high correlation (Spearman’s rank correlation coefficient of 0.435, p=3.884e-05) between our NGS data and scores from the predictive Fusi/Doench algorithm (Figure 3). One would expect little correlation between our NGS data and predicted scores (by any algorithm) if the variation observed in our data were caused by technical variability and not innate sgRNA efficacy. Second, all three Ebf.3 sgRNA vector formats (plasmid, traditional PCR cassette, OSO-PCR cassette) resulted in very similar mutagenesis efficacies by NGS (30.2%–37.3%), Supplementary Table 1). Third, there was a high correlation between mutagenesis efficacies of _Ebf_-targeting sgRNAs and Ebf loss-of-function phenotypes, which were assayed in two separate sets of experiments (Figure 6e). Lastly, there was little variability in efficacy between biological replicates of a subset of sgRNAs as measured by peakshift (Supplementary Table 6).
Although more replicates and better statistical support would be required to develop a _Ciona_-specific sgRNA prediction algorithm de novo, we believe our data are accurate enough to support using the Fusi/Doench algorithm as the gold-standard in sgRNA design for Ciona (Figure 3). Among the various published sgRNA prediction algorithms, Fusi/Doench (FUSI et al. 2015; DOENCH et al. 2016) functions well as a classifier for “good” (>24.5% mutagenesis efficacy) and “bad” (<24.5%) sgRNAs. Despite these general trends, several sgRNAs defied this algorithm-based prediction. This suggests that there are multiple, possibly additive or synergistic factors that determine the mutagenesis efficacy, only one of which is primary sequence composition of the sgRNA or target. Other factors that can influence Cas9 binding include chromatin accessibility and nucleosome occupancy (Wu et al. 2014; HINZ et al. 2015; HORLBECK et al. 2016; ISAAC et al. 2016). What other additional factors contribute to variability of in vivo sgRNA mutagenesis efficacies will be an important topic of study as CRISPR/Cas9-based approaches are expanded to address additional questions in basic research as well as for therapeutic purposes.
While an optimized predictive algorithm for _Ciona_-specific sgRNA design remains a desirable goal, our current approach should help other researchers to identify, with greater confidence, which sgRNAs are likely to confer enough mutagenic activity for functional studies in F0. We have shown, using a series of _Ebf_-targeting sgRNAs and an Ebf loss-of-function readout assay (Islet reporter expression) that a linear correlation exists between sgRNA mutagenesis efficacy and the probability of somatic gene knockout in F0. In this case, we measured the frequency of a binary loss-of-function assay (Islet ON or OFF) in a large population of embryos. Therefore it is expected that the probability a homozygous Ebf knockout (resulting in Islet OFF phenotype) should be correlated to the observed frequency of Ebf mutations in somatic cell populations. While Ebf function can be disrupted by small changes to its crucial IPT/HLH domains, other genes may prove harder to disrupt with the short indels generated by CRISPR/Cas9. However, we show that the combinatorial action of two or more sgRNAs can result in high frequency of large deletions spanning many kbp, which should help generate loss-of-function alleles for such recalcitrant genes.
Despite legitimate concerns about potential off-target effects for functional studies, we were not able to detect CRISPR/Cas9-mediated mutagenesis at two potential off-target sites for the sgRNAs Ebf.3 and Fgf4/6.1. For the remainder of the sgRNAs, we purposefully selected those with no strongly predicted off-targets. This was possible in Ciona due to two factors. First, the Ciona genome is significantly smaller than the human genome and most metazoans, resulting in a lower number of similar protospacer sequences. Second, the GC content of the Ciona genome is only 35% as compared to 65% in humans, which should result in a lower overall frequency of canonical PAMs (NGG). Based on these considerations, we predict off-target effects to be less pervasive in Ciona than in other model organisms with more complex, GC-rich genomes.
Even with improved prediction of sgRNA efficacy and specificity, there is still a need to test several sgRNAs to identify the optimal one targeting a gene of interest. To this end, we have developed a cloning-free OSO-PCR method for the rapid assembly of sgRNA expression cassettes. We have shown that these unpurified PCR cassettes can be directly electroporated into Ciona embryos and screened by either Sanger sequencing of target sequences or mutant phenotype frequency in F0. The automated design of primers for Ciona-specific sgRNA cassette OSO-PCR has been implemented in the latest version (v4.0) of CRISPOR (http://crispor.tefor.net/).
Finally, we have pre-emptively designed all possible sgRNAs targeting exonic sequences in the compact Ciona genome and calculated their specificity and efficiency by various predictive algorithms. This track is available online on the UCSC genome browser, but is also freely available for download and use with other genome browsers. This allows researchers to locally browse for sgRNAs with predicted high activity targeting their loci of interest. Integration with the CRISPOR website further allows SNP and off-target prediction, and pre-designed OSO-PCR oligonucleotide primers for rapid, efficient synthesis and transfection. We expect these resources to facilitate the scaling of CRISPR/Cas9-mediated targeted mutagenesis and enable genome-wide screens for gene function in Ciona.
Materials and Methods
Target sequence selection and sgRNA design
23 genes from Ciona robusta (formerly Ciona intestinalis type A)(HOSHINO AND TOKIOKA 1967; BRUNETTI et al. 2015) hypothesized to be important for cardiopharyngeal mesoderm development were shortlisted (Table 1) and one to four sgRNAs targeting non-overlapping sequences per gene were designed, for a total of 83 sgRNA vectors (Supplementary Table 3). Two sgRNAs were designed to target the neurogenic bHLH factor Neurogenin, a gene that is not expressed in the cardiopharyngeal mesoderm and is not thought to be involved in cardiopharyngeal development. Target sequences were selected by searching for N19+NGG (protospacer + PAM) motifs and screened for polymorphisms and off-target matches using the GHOST genome browser and BLAST portal (Satou et al. 2005; Satou et al. 2008). Potential off-targets were also identified using the CRISPRdirect platform (Naito et al. 2015). sgRNA expression plasmids were designed for each of these protospacers and constructed using the U6>sgRNA(F+E) vector as previously described (Stolfi et al. 2014), as well as a “Negative Control” protospacer that does not match any sequence in the C. robusta genome (5′-GCTTTGCTACGATCTACATT-3′). Stretches of more than four thymine bases (T) were avoided due to potential premature transcription termination. Candidate sgRNAs with a partial PAM-proximal match of 13 bp or more to multiple loci were also discarded due to off-target concerns. All sgRNAs were designed to target protein-coding, splice-donor, or splice-acceptor sites, unless specifically noted. We preferred more 5′ target sites, as this provides a greater probability of generating loss-of-function alleles.
Electroporation of Ciona embryos
DNA electroporation was performed on pooled, dechorionated zygotes (1-cell stage embryos) from C. robusta adults collected from San Diego, CA (M-REP) as previously described (Christiaen et al. 2009). All sgRNA plasmid maxipreps were individually electroporated at a final concentration of 107 ng/μl (75 μg in 700 μl) concentration together with Eef1a1>nls∷Cas9∷nls plasmid (Stolfi et al. 2014) at 35.7 ng/μl (25 μg in 700 μl) concentration. For testing U6>Ebf.3 PCR or OSO-PCR, 25 μl was used instead of sgRNA plasmid. Embryos were then rinsed once in artificial sea water, to remove excess DNA and electroporation buffer, and grown at 18°C for 16 hours post-fertilization.
Embryo lysis
After 16 hpf, each pool of embryos targeted with a single sgRNA + Cas9 combination was washed in one sea water exchange before lysis, to remove excess plasmid DNA, and transferred to a 1.7 ml microcentrifuge tube. Excess sea water was then removed and embryos were lysed in 50 μl of lysis mixture prepared by mixing 500 μL of DirectPCR Cell Lysis Reagent (Viagen Biotech Inc., Los Angeles, CA, Cat # 301-C) with 1 μl of Proteinase K (20 mg/ml, Life Technologies, Carlsbad, CA). The embryos were thoroughly mixed in lysis mixture and incubated at 68°C for 15 minutes, followed by 95°C for 10 minutes.
PCR amplification of targeted sequences
Targeted sequences were individually PCR-amplified directly from lysate from embryos targeted with the respective sgRNA, and from “negative control” lysate (from embryos electroporated with Eef1a1>nls∷Cas9∷nls and U6>Negative Control sgRNA vector). Primers (Supplementary Table 4) were designed to flank target sites as to obtain PCR products in the size range of 108–290bp with an exception of the sequence targeted by Ebf.3 (“Ebf.774” in Stolfi et al. 2014) and Ebf.4 sgRNAs, for which the designed primers resulted in a product size of 350 bp. Potential off-target sites predicted for sgRNAs Ebf.3 (CTCGCAACGGGGACAACAGGGGG, genome position KhC8:2,068,844-2,068,866) and Fgf4/6.1 (TATTTTAATTCTGTACCTGTGGG, genome position KhC9:6,318,421-6,318,443) were amplified to test for off-target CRISPR/Cas9 activity with the primers: 5′-CCAGCACTTCAGAGCAATCA-3′ and 5′-TGACGTCACACTCACCGTTT-3′ (Ebf.3), and 5′-AACGATTGTCCATACGAGGA-3′ and 5′-ACTTCCCAACAGCAAACTGG-3′ (Fgf/6.1).
For each targeted sequence, 12.5 μL PCR reactions were set up with final concentrations of 600 nM each primer, 300 μM dNTPs, 1 mM MgSO4, 2X buffer, and 0.05 U/μl Platinum Pfx DNA polymerase (Life Technologies), and subjected to the following PCR program: an initial cycle of 10 minutes at 95°C, followed by 30 cycles of 30 seconds at 94°C, 30s at 60°C and 30s at 68°C, and a final cycle of 3 minutes at 68°C. PCR reactions were quickly checked on an agarose gel for the presence/absence of amplicon. Those that resulted in a single band were not initially purified. For those reactions with more than one band, the correct amplicon (selected based on expected size) was gel purified using a Nucleospin Gel Clean-up Kit (Macherey-Nagel, Duren, Germany). Purified and unpurified PCR products were then pooled for subsequent processing. The majority of PCR products amplified from larvae treated with Cas9 + gene-targeting sgRNA were pooled in Pool 1. All products from larvae treated with Cas9 + “negative control” sgRNA were pooled in Pool 2. For those sequences targeted by distinct sgRNAs but amplified using the same set of flanking primers, their PCR products were split into separate pools, as to allow for separate efficacy estimates.
Sequencing library preparation
The PCR product pools were electrophoresed on ethidium bromide-stained, 1% agarose gel in 0.5X Tris-Acetate-EDTA (TAE) buffer and a band of ~150–300 bp was excised (Nucleospin gel and PCR cleanup kit, Macherey-Nagel). 102–235 ng of each pool was used as a starting material to prepare sequencing libraries (protocol adapted from http://wasp.einstein.yu.edu/index.php/Protocol:directional_WholeTranscript_seq). Ends were repaired using T4 DNA polymerase (New England Biolabs, Ipswich, MA) and T4 Polynucleotide Kinase (New England Biolabs), and then A-tailed using Klenow fragment (3′→5′ exo-) (New England Biolabs) and dATP (Sigma-Aldrich, St. Louis, MO). Each pool was then ligated to distinct barcoded adapters. (NEXTflex DNA Barcodes - BioO Scientific Cat# 514101). The six barcodes used in this study were: CGATGT, TGACCA, ACAGTG, GCCAAT, CAGATC and CTTGTA. At this step, the adapter-ligated DNA fragments were purified twice using Ampure XP beads (Beckman Coulter, Brea, CA). The final amplification, using primers included with NEXTflex adapters, was done using the PCR program: 2 minutes at 98°C followed by 8 cycles of 30 seconds at 98°C; 30 seconds at 60°C; 15 seconds of 72°C, followed by 10 minutes at 72°C. Ampure XP bead-based selection was performed twice, and the libraries were quantified using qPCR. The libraries were then mixed in equimolar ratio to get a final DNA sequencing library concentration of 4 nM. The multiplexed library was sequenced by Illumina MiSeq V2 platform (Illumina, San Diego, CA) using 2×250 paired end configuration.
Next generation sequencing data analysis
FastQ files obtained from sequencing were de-multiplexed and subjected to quality control analysis. FastQ reads were mapped to the 2008 KyotoHoya genome assembly (Satou et al. 2008) by local alignment using Bowtie2.2 (Langmead and Salzberg 2012). Single end reads were also mapped to a reduced genome assembly consisting of only those scaffolds containing the targeted genes. This allowed for a much faster and accurate alignment using Bowtie2.2. The SAM file generated was converted into a BAM file using samtools (Li et al. 2009). The BAM file was sorted and indexed to visualize reads on Integrative Genomics Viewer (IGV) (Robinson et al. 2011). Most mutagenesis rates were obtained by counting indels in IGV. For some targets with partially overlapping aplicon sequences, custom Python scripts were written to parse the BAM file to get estimated rate of mutagenesis. Since a successful CRISPR/Cas9-mediated deletion or insertion should eliminate or disrupt all or part of the protospacer + PAM sequence (jointly termed the “pineapple”), we simply looked for mapped reads in which the pineapple was not fully present. When appropriate, the rate of naturally occurring indels around each target, as detected in reads from “negative control” embryos, was subtracted from the raw efficacy rates. Custom python scripts used are available upon request. Matplotlib (http://matplotlib.org) was used for plotting, Numpy (http://numpy.org) and Pandas (http://pandas.pydata.org) were used for data mining. All predictive algorithm scores were generated using CRISPOR (http://crispor.tefor.net/)(HAEUSSLER et al. 2016).
Nucleotide Enrichment Analysis
We used log-odds score as a measure to estimate how enriched each nucleotide was at a given position in the 43bp region of interest (excluding position 1 of the protospacer, and the ‘GG’ of the PAM). Log-odds score was defined as the base-2 logarithm of the ratio of probability of observing nucleotide ‘N’ at position ‘x,’ and the background probability of observing nucleotide ‘N’ by random chance, given its frequency in our sample space (all sgRNA targets, n=83). A positive or negative log-odds score reflects enrichment or depletion, respectively, of each nucleotide at a given position.
Mathematically,
- px = probability of finding nucleotide ‘N’ at position ‘x’
- pb = background probability of finding nucleotide ‘N’ at position ‘x’ by chance
Receiver Operating Characteristic (ROC) curve
For a binary classifier (“good” vs. “bad” sgRNA), there are four possible outcomes: True Positive (TP), False Positive (FP), True Negative (TN), and False Negative (FN). If the predicted classification of the sgRNA by our model was “good” or “bad”, and it was supported by our experimental data (i.e. the empirical mutagenesis rate was above or below 24.5% respectively), it was marked as a “True Positive” or a “True Negative,” respectively. If the experimental data failed to support it, it was marked as a “False Positive” or a “False Negative,” respectively. The true positive rate (TPR), or “Sensitivity”, was defined as the proportion of empirically good sgRNAs that were correctly predicted as good [TPR = TP/(TP + FN)]. Similarly, the true negative rate (TNR), or “Specificity”, was defined as the proportion of empirically bad gRNAs that were correctly predicted as bad [TNR = TN/(TN + FP)]. The false positive rate (FPR) is 1 - Specificity. In figure 3c, we plotted the true positive rates against the false positive rates, all obtained by applying different Fusi/Doench score thresholds (ranging from 0 to 100) to the predictions generated by our model (see Supplementary Table 2).
Combinatorial sgRNA electroporation to induce large deletions
Embryos were electroporated with 25 μg Eef1a1>nls∷Cas9∷nls and two vectors from the set of validated sgRNA plasmids for each targeted gene (50 μg per sgRNA vector). Embryos were grown for 12 hpf at 18°C, pooled, and genomic DNA extracted from them using QIAamp DNA mini kit (Qiagen). Deletion bands were amplified in PCR reactions using Pfx platinum enzyme as described above (see “PCR amplification of targeted sequences”) and a program in which the extension time was minimized to 15 seconds only, in order to suppress the longer wild-type amplicon and promote the replication of the smaller deletion band. Primers used were immediately flanking the sequences targeted by each pair of sgRNAs (Supplementary Table 4). Products were purified from agarose gels, A-overhung and TOPO-cloned. Colonies were picked, cultured, prepped and sequence.
Synthesis and electroporation of unpurified sgRNA PCR expression cassettes
U6>Eb/.3 and U6>Negative Control sgRNA expression cassettes were amplified from their respective plasmids using the primers U6 forward (5′-TGGCGGGTGTATTAAACCAC-3′) and sgRNA reverse (5′-GGATTTCCTTACGCGAAATACG-3′) in reactions of final concentrations of 600 nM each primer, 300 μM dNTPs, 1 mM MgSO4, 2X buffer, and 0.05 U/μl Platinum Pfx DNA polymerase (Life Technologies), and subjected to the following PCR program: an initial cycle of 3 minutes at 95°C, followed by 30 cycles of 30 seconds at 94°C, 30s at 55°C and 2 minutes at 68°C, and a final cycle of 5 minutes at 68°C. U6>sgRNA(F+E)∷eGFP (STOLFI et al. 2014) was amplified as above but using Seq forward primer (5′-AGGGTTATTGTCTCATGAGCG-3′) instead. For phenotyping Ebf-dependent expression of Islet reporter in MN2 motor neurons (STOLFI et al. 2014), embryos were co-electroporated with 35–40 μg of Sox1/2/3> nls∷Cas9∷nls, 5–15 μg of Sox1/2/3>H2B∷mCherry/eGFP, 30–40 μg of Isl>eGFP/mCherry, and either 25 μg of U6>Ebf.3 plasmid or 25 μl (~2.5 ug) of unpurified PCR product.
sgRNA expression cassette assembly by One-step Overlap PCR (OSO-PCR)
sgRNA PCR cassettes were constructed using an adapted One-step Overlap PCR (OSO-PCR) protocol (Urban et al. 1997). Basically, a desired protospacer sequence is appended 5′ to a forward primer (5′-GTTTAAGAGCTATGCTGGAAACAG-3′) and its reverse complement is appended 5′ to a reverse primer (5′-ATCTATACCATCGGATGCCTTC-3′). These primers are then added to a PCR reaction at limiting amounts, together with u6 forward (5′-TGGCGGGTGTATTAAACCAC-3′) and sgRNA reverse (5′-GGATTTCCTTACGCGAAATACG-3′) primers and separate template plasmids containing the U6 promoter (U6>XX) and the sgRNA scaffold (XX>sgRNA F+E). Plasmids are available from Addgene (https://www.addgene.org/Lionel_Christiaen/). The complementarity between the 5′ ends of the inner primers bridges initially separate U6 and sgRNA scaffold sequences into a single amplicon, and because they are quickly depleted, the entire cassette is preferentially amplified in later cycles by the outer primers (see Figure 5 and Supplementary Protocol for details). Final, unpurified reactions should contain PCR amplicon at ~100 ng/μl, as measured by image analysis after gel electrophoresis (Supplementary Figure 5).
Measuring mutagenesis efficacies of sgRNAs by Sanger sequencing
OSO-PCR cassettes were designed and constructed for the expression of 7 sgRNA targeting exons 10–12 that code for part of the IPT and HLH domains of Ebf (Figure 6a, Supplementary Table 3). Embryos were electroporated with 25 μl of unpurified OSO-PCR product and 25 μg Eef1a1>nls∷Cas9∷nls, and grown to hatching. For the replication experiment (Supplementary Table 6) 75 μg of sgRNA vectors (Gata4/5/6.2, Gata4/5/6.3, Gata4/5/6.4, Neurog.1, Neurog.2) were each co-electroporated with 25 μg Eef1a1>nls∷Cas9∷nls. This was repeated over two separate batches of embryos.
All larvae were allowed to hatch and genomic DNA was extracted using the QiaAmp DNA mini kit (Qiagen). The Ebf target region was PCR-amplified using the following primers: (Forward primer: 5′-CTCCACATGCCTCAACTTTG-3′, Reverse primer: 5′-TGTTCCGCCAAATTGTGAAG-3′). For Gata4/5/6 target sequences, the primers used were the corresponding ones from the NGS experiment, while a novel pair of primers was used to amplify the Neurog locus (Forward primer: 5′-AAGTACGGAGAGCAGAATACC-3′, Reverse primer: 5′-CTTCTAGTGCGTCATTAAGACC-3′). PCR was performed in 35 cycles using Platinum Pfx DNA polymerase. The resulting PCR products were gel- or column-purified, and sequenced using either a flanking PCR primer or an internal sequencing primer (Ebf internal: 5′-AATTGGCTGACAGGTTGGAG-3′, Neurog internal: 5′-GCTCTTGCTACAAAATGTTGG-3′).
The resulting.ab1 sequencing files were then analyzed by ab1 Peak Reporter webtool (ROY and SCHREIBER 2014) (https://apps.thermofisher.com/ab1peakreporter/)(Supplementary Table 5). To quantify the peak “shifts” resulting from CRISPR/Cas9-induced short indels (Supplementary Figure 6), we calculated the sum of “maximum signal 7 scan filtered ratio” (MaxSig7Scan Sum) values of minor peaks at each position in a 30 bp window starting from the third bp in the target sequence from the PAM (the most likely Cas9 cut site). The mean MaxSig7Scan Sum was calculated across all 30 bp of this window, resulting in a “raw peakshift score”. The same was repeated for the 30 bp window immediately 5′ to the cut site in the sequencing read, for a peakshift “baseline” estimate. This baseline was subtracted from the raw peakshift score to give the “corrected peakshift score”, a relative quantification of indel frequency, and therefore of the mutagenesis efficacy of the sgRNA used.
Whole-exome sgRNA predictions in Ciona
We used all transcribed regions in the ENSEMBL 65 transcript models (AKEN et al. 2016), extended them by 200 bp on each side, searched for all possible NGG-20bp sgRNA targets in these sequences and ran them through the command-line version of CRISPOR (HAEUSSLER et al. 2016) which aligns 20mers using BWA (LI AND DURBIN 2009) in iterative mode, ranks off-targets by CFD or MIT scores and calculates the Fusi/Doench 2016 efficiency scores (Fusi et al. 2015; Doench et al. 2016). Efficiency scores were also translated to percentiles for better ease of use, e.g. a raw Fusi/Doench score of 60 translates to the 80th percentile, meaning that 80% of scored guides are lower than 60. All results are then written to a UCSC BigBed file (Raney et al. 2014) for interactive visualization. The BigBed file can be loaded into all popular genome browsers, like Ensembl (Yates et al. 2016), IGV (Robinson et al. 2011) or GBrowse (Stein et al. 2002). The track is available on the ci2 assembly on the UCSC Genome Browser (http://genome.ucsc.edu), in the track group “Genes and Gene Predictions”. The source code is available as part of the UCSC Genome Browser source tree at: https://github.com/ucscGenomeBrowser/kent/tree/master/src/hg/makeDb/crisprTrack
Embryo imaging
Fluorescent in situ hybridization of eGFP or Foxf coupled to immunohistochemsitry was carried out as previously described (Beh et al. 2007; Stolfi et al. 2014). Images were taken on a Leica Microsystems inverted TCS SP8 X confocal microscope or a Leica DM2500 epifluorescence microscope. Mouse monoclonal anti-β-Gal Z3781 (Promega, Madison, WI) was used diluted at 1:500. Goat anti-Mouse IgG (H+L) Secondary Antibody Alexa Fluor 568 conjugate (Life Technologies) was used diluted at 1:500.
Supplementary Material
1. Supplementary Table 1. sgRNAs assayed by next-generation sequencing.
All sgRNAs analyzed by next-generation sequencing in this study, with respective protospacer and PAM sequences, electroporation (EP) date and batch, number of reads sequenced, number of indels detected, mutagenesis efficacy rate (Mut%), and various efficacy prediction scores calculated using the CRISPOR website. Ebf.3 was tested either as a plasmid or unpurified traditional PCR and OSO-PCR cassettes (highlighted in yellow, see text for details).
2
Supplementary Table 2. Performance of sgRNA binary classifier using different Fusi/Doench score cutoffs
3. Supplementary Table 3. Correlation of Ebf mutagenesis efficacy and loss-of-function phenotype using different sgRNAs.
Ebf OSO-PCR casette-expressed sgRNAs assayed by loss-of-function phenotype (Isl>mCherry expression) and peakshift analysis.
4
Supplementary Table 4. List of Primers (5′ -> 3′) used to amplify sgRNA target sequences for next-generation sequencing.
5
Supplementary Table 5. Example of data file returned by ab1 Peak Reporter web application, annotated with peakshift analysis for mutagenesis efficacy estimate.
6
Supplementary Table 6. Mutagenesis efficacy (MUT%) of a subset of five sgRNAs estimated by next-generation sequencing (NGS, from Supplementary Table 2) compared to efficacies calculated from peakshift analysis from two biological replicates (Peakshift 1 and Peakshift 2). Predicted Fusi-Doench score (Fusi) is also shown.
7
Highlights.
- Activity of 83 sgRNAs targeting 23 genes in Ciona embryos was analyzed by next-generation sequencing
- A new method of sgRNA expression vector construction by One-Step Overlap PCR (OSO-PCR) was developed
- sgRNAs can be transcribed in vivo from electroporated unpurified PCR products
- A high correlation was found between varying activity of several Ebf sgRNAs and frequency of Ebf loss-of-function phenotype in F0
Acknowledgments
We are grateful to Farhana Salek, Kristyn Millan, and Aakarsha Pandey for technical assistance; Tara Rock for advice on next-generation sequencing; Rahul Satija for sequencing the libraries and for his invaluable insights into the sgRNA sequence analysis; Justin S. Bois, Shyam Saladi, Elena K. Perry, and the High Performance Computing team at NYU for their help troubleshooting the bioinformatic analysis. This work was funded by an NIH K99 HD084814 award to A.S., NIH R01 GM096032 award to L.C., and an NYU Biology Masters Research Grant to S.G.
Footnotes
Publisher's Disclaimer: This is a PDF file of an unedited manuscript that has been accepted for publication. As a service to our customers we are providing this early version of the manuscript. The manuscript will undergo copyediting, typesetting, and review of the resulting proof before it is published in its final citable form. Please note that during the production process errors may be discovered which could affect the content, and all legal disclaimers that apply to the journal pertain.
References
- Abdul-Wajid S, Morales-Diaz H, Khairallah Stephanie M, Smith William C. T-type Calcium Channel Regulation of Neural Tube Closure and EphrinA/EPHA Expression. Cell Reports. 2015;13:829–839. doi: 10.1016/j.celrep.2015.09.035. [DOI] [PMC free article] [PubMed] [Google Scholar]
- Aken BL, Ayling S, Barrell D, Clarke L, Curwen V, et al. The Ensembl gene annotation system. Database. 2016;2016 doi: 10.1093/database/baw093. [DOI] [PMC free article] [PubMed] [Google Scholar]
- Bae S, Kweon J, Kim HS, Kim J-S. Microhomology-based choice of Cas9 nuclease target sites. Nature methods. 2014;11:705–706. doi: 10.1038/nmeth.3015. [DOI] [PubMed] [Google Scholar]
- Barrangou R, Fremaux C, Deveau H, Richards M, Boyaval P, et al. CRISPR provides acquired resistance against viruses in prokaryotes. Science. 2007;315:1709–1712. doi: 10.1126/science.1138140. [DOI] [PubMed] [Google Scholar]
- Beh J, Shi W, Levine M, Davidson B, Christiaen L. FoxF is essential for FGF-induced migration of heart progenitor cells in the ascidian Ciona intestinalis. Development. 2007;134:3297–3305. doi: 10.1242/dev.010140. [DOI] [PubMed] [Google Scholar]
- Bellas J, Beiras R, Vázquez E. A standardisation of Ciona intestinalis (Chordata, Ascidiacea) embryo-larval bioassay for ecotoxicological studies. Water Research. 2003;37:4613–4622. doi: 10.1016/S0043-1354(03)00396-8. [DOI] [PubMed] [Google Scholar]
- Brozovic M, Martin C, Dantec C, Dauga D, Mendez M, et al. ANISEED 2015: a digital framework for the comparative developmental biology of ascidians. Nucleic acids research: gkv966. 2015 doi: 10.1093/nar/gkv966. [DOI] [PMC free article] [PubMed] [Google Scholar]
- Brunetti R, Gissi C, Pennati R, Caicci F, Gasparini F, et al. Morphological evidence that the molecularly determined Ciona intestinalis type A and type B are different species: Ciona robusta and Ciona intestinalis. Journal of Zoological Systematics and Evolutionary Research. 2015;53:186–193. [Google Scholar]
- Chari R, Mali P, Moosburner M, Church GM. Unraveling CRISPR-Cas9 genome engineering parameters via a library-on-library approach. Nature methods. 2015;12:823–826. doi: 10.1038/nmeth.3473. [DOI] [PMC free article] [PubMed] [Google Scholar]
- Chen B, Gilbert LA, Cimini BA, Schnitzbauer J, Zhang W, et al. Dynamic imaging of genomic loci in living human cells by an optimized CRISPR/Cas system. Cell. 2013;155:1479–1491. doi: 10.1016/j.cell.2013.12.001. [DOI] [PMC free article] [PubMed] [Google Scholar]
- Cho SW, Kim S, Kim Y, Kweon J, Kim HS, et al. Analysis of off-target effects of CRISPR/Cas-derived RNA-guided endonucleases and nickases. Genome research. 2014;24:132–141. doi: 10.1101/gr.162339.113. [DOI] [PMC free article] [PubMed] [Google Scholar]
- Christiaen L, Wagner E, Shi W, Levine M. The sea squirt Ciona intestinalis. Cold Spring Harbor protocols. 2009;2009 doi: 10.1101/pdb.emo138. pdb. emo138. [DOI] [PubMed] [Google Scholar]
- Cong L, Ran FA, Cox D, Lin S, Barretto R, et al. Multiplex genome engineering using CRISPR/Cas systems. Science. 2013;339:819–823. doi: 10.1126/science.1231143. [DOI] [PMC free article] [PubMed] [Google Scholar]
- Cota CD, Davidson B. Mitotic Membrane Turnover Coordinates Differential Induction of the Heart Progenitor Lineage. Developmental cell. 2015;34:505–519. doi: 10.1016/j.devcel.2015.07.001. [DOI] [PubMed] [Google Scholar]
- Crooks GE, Hon G, Chandonia J-M, Brenner SE. WebLogo: a sequence logo generator. Genome research. 2004;14:1188–1190. doi: 10.1101/gr.849004. [DOI] [PMC free article] [PubMed] [Google Scholar]
- Dickinson DJ, Ward JD, Reiner DJ, Goldstein B. Engineering the Caenorhabditis elegans genome using Cas9-triggered homologous recombination. Nature methods. 2013;10:1028–1034. doi: 10.1038/nmeth.2641. [DOI] [PMC free article] [PubMed] [Google Scholar]
- Diogo R, Kelly RG, Christiaen L, Levine M, Ziermann JM, et al. A new heart for a new head in vertebrate cardiopharyngeal evolution. Nature. 2015;520:466–473. doi: 10.1038/nature14435. [DOI] [PMC free article] [PubMed] [Google Scholar]
- Doench JG, Fusi N, Sullender M, Hegde M, Vaimberg EW, et al. Optimized sgRNA design to maximize activity and minimize off-target effects of CRISPR-Cas9. Nature biotechnology. 2016 doi: 10.1038/nbt.3437. [DOI] [PMC free article] [PubMed] [Google Scholar]
- Doench JG, Hartenian E, Graham DB, Tothova Z, Hegde M, et al. Rational design of highly active sgRNAs for CRISPR-Cas9-mediated gene inactivation. Nature biotechnology. 2014 doi: 10.1038/nbt.3026. [DOI] [PMC free article] [PubMed] [Google Scholar]
- Fu Y, Foden JA, Khayter C, Maeder ML, Reyon D, et al. High-frequency off-target mutagenesis induced by CRISPR-Cas nucleases in human cells. Nature biotechnology. 2013;31:822–826. doi: 10.1038/nbt.2623. [DOI] [PMC free article] [PubMed] [Google Scholar]
- Fu Y, Sander JD, Reyon D, Cascio VM, Joung JK. Improving CRISPR-Cas nuclease specificity using truncated guide RNAs. Nature biotechnology. 2014;32:279–284. doi: 10.1038/nbt.2808. [DOI] [PMC free article] [PubMed] [Google Scholar]
- Fusi N, Smith I, Doench J, Listgarten J. In Silico Predictive Modeling of CRISPR/Cas9 guide efficiency. bioRxiv. 2015 021568. [Google Scholar]
- Gagnon JA, Valen E, Thyme SB, Huang P, Ahkmetova L, et al. Efficient mutagenesis by Cas9 protein-mediated oligonucleotide insertion and large-scale assessment of single-guide RNAs. 2014 doi: 10.1371/journal.pone.0098186. [DOI] [PMC free article] [PubMed] [Google Scholar]
- Gantz VM, Bier E. The mutagenic chain reaction: A method for converting heterozygous to homozygous mutations. Science. 2015;348:442–444. doi: 10.1126/science.aaa5945. [DOI] [PMC free article] [PubMed] [Google Scholar]
- Haeussler M, Schönig K, Eckert H, Eschstruth A, Mianné J, et al. Evaluation of off-target and on-target scoring algorithms and integration into the guide RNA selection tool CRISPOR. Genome Biology. 2016;17:148. doi: 10.1186/s13059-016-1012-2. [DOI] [PMC free article] [PubMed] [Google Scholar]
- Hinz JM, Laughery MF, Wyrick JJ. Nucleosomes Inhibit Cas9 Endonuclease Activity in Vitro. Biochemistry. 2015;54:7063–7066. doi: 10.1021/acs.biochem.5b01108. [DOI] [PubMed] [Google Scholar]
- Hirano T, Nishida H. Developmental Fates of Larval Tissues after Metamorphosis in Ascidian Halocynthia roretzi. Developmental biology. 1997;192:199–210. doi: 10.1006/dbio.1997.8772. [DOI] [PubMed] [Google Scholar]
- Horlbeck MA, Witkowsky LB, Guglielmi B, Replogle JM, Gilbert LA, et al. Nucleosomes impede Cas9 access to DNA in vivo and in vitro. Elife. 2016;5:e12677. doi: 10.7554/eLife.12677. [DOI] [PMC free article] [PubMed] [Google Scholar]
- Hoshino Zi, Tokioka T. An unusually robust Ciona from the northeastern coast of Honsyu Island, Japan 1967 [Google Scholar]
- Hotta K, Mitsuhara K, Takahashi H, Inaba K, Oka K, et al. A web-based interactive developmental table for the ascidian Ciona intestinalis, including 3D real-image embryo reconstructions: I. From fertilized egg to hatching larva. Developmental Dynamics. 2007;236:1790–1805. doi: 10.1002/dvdy.21188. [DOI] [PubMed] [Google Scholar]
- Housden BE, Valvezan AJ, Kelley C, Sopko R, Hu Y, et al. Identification of potential drug targets for tuberous sclerosis complex by synthetic screens combining CRISPR-based knockouts with RNAi. Science signaling. 2015;8:rs9. doi: 10.1126/scisignal.aab3729. [DOI] [PMC free article] [PubMed] [Google Scholar]
- Hsu PD, Scott DA, Weinstein JA, Ran FA, Konermann S, et al. DNA targeting specificity of RNA-guided Cas9 nucleases. Nature biotechnology. 2013;31:827–832. doi: 10.1038/nbt.2647. [DOI] [PMC free article] [PubMed] [Google Scholar]
- Hwang WY, Fu Y, Reyon D, Maeder ML, Tsai SQ, et al. Efficient genome editing in zebrafish using a CRISPR-Cas system. Nature biotechnology. 2013;31:227–229. doi: 10.1038/nbt.2501. [DOI] [PMC free article] [PubMed] [Google Scholar]
- Imai KS, Hino K, Yagi K, Satoh N, Satou Y. Gene expression profiles of transcription factors and signaling molecules in the ascidian embryo: towards a comprehensive understanding of gene networks. Development. 2004;131:4047–4058. doi: 10.1242/dev.01270. [DOI] [PubMed] [Google Scholar]
- Isaac RS, Jiang F, Doudna JA, Lim WA, Narlikar GJ, et al. Nucleosome breathing and remodeling constrain CRISPR-Cas9 function. eLife. 2016;5:e13450. doi: 10.7554/eLife.13450. [DOI] [PMC free article] [PubMed] [Google Scholar]
- Jinek M, Chylinski K, Fonfara I, Hauer M, Doudna JA, et al. A programmable dual-RNA-guided DNA endonuclease in adaptive bacterial immunity. Science. 2012;337:816–821. doi: 10.1126/science.1225829. [DOI] [PMC free article] [PubMed] [Google Scholar]
- Jinek M, East A, Cheng A, Lin S, Ma E, et al. RNA-programmed genome editing in human cells. eLife. 2013:2. doi: 10.7554/eLife.00471. [DOI] [PMC free article] [PubMed] [Google Scholar]
- Kaplan N, Razy-Krajka F, Christiaen L. Regulation and evolution of cardiopharyngeal cell identity and behavior: insights from simple chordates. Current opinion in genetics & development. 2015;32:119–128. doi: 10.1016/j.gde.2015.02.008. [DOI] [PMC free article] [PubMed] [Google Scholar]
- Kawai N, Ochiai H, Sakuma T, Yamada L, Sawada H, et al. Efficient targeted mutagenesis of the chordate Ciona intestinalis genome with zinc - finger nucleases. Development, growth & differentiation. 2012;54:535–545. doi: 10.1111/j.1440-169X.2012.01355.x. [DOI] [PubMed] [Google Scholar]
- Koike-Yusa H, Li Y, Tan E-P, Velasco-Herrera MDC, Yusa K. Genome-wide recessive genetic screening in mammalian cells with a lentiviral CRISPR-guide RNA library. Nature biotechnology. 2014;32:267–273. doi: 10.1038/nbt.2800. [DOI] [PubMed] [Google Scholar]
- Langmead B, Salzberg SL. Fast gapped-read alignment with Bowtie 2. Nature methods. 2012;9:357–359. doi: 10.1038/nmeth.1923. [DOI] [PMC free article] [PubMed] [Google Scholar]
- Li H, Durbin R. Fast and accurate short read alignment with Burrows-Wheeler transform. Bioinformatics. 2009;25:1754–1760. doi: 10.1093/bioinformatics/btp324. [DOI] [PMC free article] [PubMed] [Google Scholar]
- Li H, Handsaker B, Wysoker A, Fennell T, Ruan J, et al. The sequence alignment/map format and SAMtools. Bioinformatics. 2009;25:2078–2079. doi: 10.1093/bioinformatics/btp352. [DOI] [PMC free article] [PubMed] [Google Scholar]
- Mali P, Yang L, Esvelt KM, Aach J, Guell M, et al. RNA-guided human genome engineering via Cas9. Science. 2013;339:823–826. doi: 10.1126/science.1232033. [DOI] [PMC free article] [PubMed] [Google Scholar]
- Moreno-Mateos MA, Vejnar CE, Beaudoin J-D, Fernandez JP, Mis EK, et al. CRISPRscan: designing highly efficient sgRNAs for CRISPR-Cas9 targeting in vivo. Nat Meth. 2015;12:982–988. doi: 10.1038/nmeth.3543. [DOI] [PMC free article] [PubMed] [Google Scholar]
- Naito Y, Hino K, Bono H, Ui-Tei K. CRISPRdirect: software for designing CRISPR/Cas guide RNA with reduced off-target sites. Bioinformatics. 2015;31:1120–1123. doi: 10.1093/bioinformatics/btu743. [DOI] [PMC free article] [PubMed] [Google Scholar]
- Nielsen S, Yuzenkova Y, Zenkin N. Mechanism of Eukaryotic RNA Polymerase III Transcription Termination. Science. 2013;340:1577–1580. doi: 10.1126/science.1237934. [DOI] [PMC free article] [PubMed] [Google Scholar]
- Nishida H. Cell lineage analysis in ascidian embryos by intracellular injection of a tracer enzyme: III. Up to the tissue restricted stage. Developmental biology. 1987;121:526–541. doi: 10.1016/0012-1606(87)90188-6. [DOI] [PubMed] [Google Scholar]
- Nishiyama A, Fujiwara S. RNA interference by expressing short hairpin RNA in the Ciona intestinalis embryo. Development, growth & differentiation. 2008;50:521–529. doi: 10.1111/j.1440-169X.2008.01039.x. [DOI] [PubMed] [Google Scholar]
- Paix A, Wang Y, Smith HE, Lee C-YS, Calidas D, et al. Scalable and versatile genome editing using linear DNAs with microhomology to Cas9 Sites in Caenorhabditis elegans. Genetics. 2014;198:1347–1356. doi: 10.1534/genetics.114.170423. [DOI] [PMC free article] [PubMed] [Google Scholar]
- Pasini A, Amiel A, Rothbächer U, Roure A, Lemaire P, et al. Formation of the ascidian epidermal sensory neurons: insights into the origin of the chordate peripheral nervous system. PLoS Biology. 2006;4:e225. doi: 10.1371/journal.pbio.0040225. [DOI] [PMC free article] [PubMed] [Google Scholar]
- Pattanayak V, Lin S, Guilinger JP, Ma E, Doudna JA, et al. High-throughput profiling of off-target DNA cleavage reveals RNA-programmed Cas9 nuclease specificity. Nature biotechnology. 2013;31:839–843. doi: 10.1038/nbt.2673. [DOI] [PMC free article] [PubMed] [Google Scholar]
- Raney BJ, Dreszer TR, Barber GP, Clawson H, Fujita PA, et al. Track data hubs enable visualization of user-defined genome-wide annotations on the UCSC Genome Browser. Bioinformatics. 2014;30:1003–1005. doi: 10.1093/bioinformatics/btt637. [DOI] [PMC free article] [PubMed] [Google Scholar]
- Razy-Krajka F, Lam K, Wang W, Stolfi A, Joly M, et al. Collier/OLF/EBF-Dependent Transcriptional Dynamics Control Pharyngeal Muscle Specification from Primed Cardiopharyngeal Progenitors. Developmental cell. 2014;29:263–276. doi: 10.1016/j.devcel.2014.04.001. [DOI] [PMC free article] [PubMed] [Google Scholar]
- Ren X, Yang Z, Xu J, Sun J, Mao D, et al. Enhanced specificity and efficiency of the CRISPR/Cas9 system with optimized sgRNA parameters in Drosophila. Cell reports. 2014;9:1151–1162. doi: 10.1016/j.celrep.2014.09.044. [DOI] [PMC free article] [PubMed] [Google Scholar]
- Robinson JT, Thorvaldsdóttir H, Winckler W, Guttman M, Lander ES, et al. Integrative genomics viewer. Nature biotechnology. 2011;29:24–26. doi: 10.1038/nbt.1754. [DOI] [PMC free article] [PubMed] [Google Scholar]
- Rothbächer U, Bertrand V, Lamy C, Lemaire P. A combinatorial code of maternal GATA, Ets and β-catenin-TCF transcription factors specifies and patterns the early ascidian ectoderm. Development. 2007;134:4023–4032. doi: 10.1242/dev.010850. [DOI] [PubMed] [Google Scholar]
- Roy S, Schreiber E. Detecting and quantifying low level gene variants in Sanger sequencing traces using the ab1 Peak Reporter tool. Journal of biomolecular techniques: JBT. 2014;25:S13. [Google Scholar]
- Ryan K, Lu Z, Meinertzhagen IA. The CNS connectome of a tadpole larva of Ciona intestinalis (L.) highlights sidedness in the brain of a chordate sibling. eLife. 2016;5:e16962. doi: 10.7554/eLife.16962. [DOI] [PMC free article] [PubMed] [Google Scholar]
- Sanjana NE, Wright J, Zheng K, Shalem O, Fontanillas P, et al. High-resolution interrogation of functional elements in the noncoding genome. bioRxiv. 2016 doi: 10.1126/science.aaf7613. 049130. [DOI] [PMC free article] [PubMed] [Google Scholar]
- Sasaki H, Yoshida K, Hozumi A, Sasakura Y. CRISPR/Cas9 - mediated gene knockout in the ascidian Ciona intestinalis. Development, growth & differentiation. 2014;56:499–510. doi: 10.1111/dgd.12149. [DOI] [PMC free article] [PubMed] [Google Scholar]
- Sasakura Y, Suzuki MM, Hozumi A, Inaba K, Satoh N. Maternal factor-mediated epigenetic gene silencing in the ascidian Ciona intestinalis. Molecular Genetics and Genomics. 2010;283:99–110. doi: 10.1007/s00438-009-0500-4. [DOI] [PubMed] [Google Scholar]
- Satoh N. Developmental genomics of ascidians. John Wiley & Sons; 2013. [Google Scholar]
- Satou Y, Kawashima T, Shoguchi E, Nakayama A, Satoh N. An integrated database of the ascidian, Ciona intestinalis: towards functional genomics. Zoological science. 2005;22:837–843. doi: 10.2108/zsj.22.837. [DOI] [PubMed] [Google Scholar]
- Satou Y, Mineta K, Ogasawara M, Sasakura Y, Shoguchi E, et al. Improved genome assembly and evidence-based global gene model set for the chordate Ciona intestinalis: new insight into intron and operon populations. Genome Biology. 2008;9:R152. doi: 10.1186/gb-2008-9-10-r152. [DOI] [PMC free article] [PubMed] [Google Scholar]
- Schneider TD, Stephens RM. Sequence logos: a new way to display consensus sequences. Nucleic acids research. 1990;18:6097–6100. doi: 10.1093/nar/18.20.6097. [DOI] [PMC free article] [PubMed] [Google Scholar]
- Segade F, Cota C, Famiglietti A, Cha A, Davidson B. Fibronectin contributes to notochord intercalation in the invertebrate chordate, Ciona intestinalis. EvoDevo. 2016;7:21. doi: 10.1186/s13227-016-0056-4. [DOI] [PMC free article] [PubMed] [Google Scholar]
- Shalem O, Sanjana NE, Hartenian E, Shi X, Scott DA, et al. Genome-scale CRISPR-Cas9 knockout screening in human cells. Science. 2014;343:84–87. doi: 10.1126/science.1247005. [DOI] [PMC free article] [PubMed] [Google Scholar]
- Stein LD, Mungall C, Shu S, Caudy M, Mangone M, et al. The Generic Genome Browser: A Building Block for a Model Organism System Database. Genome Research. 2002;12:1599–1610. doi: 10.1101/gr.403602. [DOI] [PMC free article] [PubMed] [Google Scholar]
- Stolfi A, Gainous TB, Young JJ, Mori A, Levine M, et al. Early chordate origins of the vertebrate second heart field. Science. 2010;329:565. doi: 10.1126/science.1190181. [DOI] [PMC free article] [PubMed] [Google Scholar]
- Stolfi A, Gandhi S, Salek F, Christiaen L. Tissue-specific genome editing in Ciona embryos by CRISPR/Cas9. Development. 2014;141:4115–4120. doi: 10.1242/dev.114488. [DOI] [PMC free article] [PubMed] [Google Scholar]
- Tolkin T, Christiaen L. Rewiring of an ancestral Tbx1/10-Ebf-Mrf network for pharyngeal muscle specification in distinct embryonic lineages. Development. 2016;143:3852–3862. doi: 10.1242/dev.136267. [DOI] [PMC free article] [PubMed] [Google Scholar]
- Treen N, Yoshida K, Sakuma T, Sasaki H, Kawai N, et al. Tissue-specific and ubiquitous gene knockouts by TALEN electroporation provide new approaches to investigating gene function in Ciona. Development. 2014;141:481–487. doi: 10.1242/dev.099572. [DOI] [PubMed] [Google Scholar]
- Urban A, Neukirchen S, Jaeger K-E. A rapid and efficient method for site-directed mutagenesis using one-step overlap extension PCR. Nucleic acids research. 1997;25:2227–2228. doi: 10.1093/nar/25.11.2227. [DOI] [PMC free article] [PubMed] [Google Scholar]
- Wang H, Yang H, Shivalila CS, Dawlaty MM, Cheng AW, et al. One-step generation of mice carrying mutations in multiple genes by CRISPR/Cas-mediated genome engineering. Cell. 2013a;153:910–918. doi: 10.1016/j.cell.2013.04.025. [DOI] [PMC free article] [PubMed] [Google Scholar]
- Wang T, Wei JJ, Sabatini DM, Lander ES. Genetic screens in human cells using the CRISPR-Cas9 system. Science. 2014;343:80–84. doi: 10.1126/science.1246981. [DOI] [PMC free article] [PubMed] [Google Scholar]
- Wang W, Razy-Krajka F, Siu E, Ketcham A, Christiaen L. NK4 antagonizes Tbx1/10 to promote cardiac versus pharyngeal muscle fate in the ascidian second heart field. PLoS Biology. 2013b;11:e1001725. doi: 10.1371/journal.pbio.1001725. [DOI] [PMC free article] [PubMed] [Google Scholar]
- Wong N, Liu W, Wang X. WU-CRISPR: characteristics of functional guide RNAs for the CRISPR/Cas9 system. Genome biology. 2015;16:1. doi: 10.1186/s13059-015-0784-0. [DOI] [PMC free article] [PubMed] [Google Scholar]
- Wu X, Scott DA, Kriz AJ, Chiu AC, Hsu PD, et al. Genome-wide binding of the CRISPR endonuclease Cas9 in mammalian cells. Nature biotechnology. 2014;32:670–676. doi: 10.1038/nbt.2889. [DOI] [PMC free article] [PubMed] [Google Scholar]
- Xu H, Xiao T, Chen C-H, Li W, Meyer CA, et al. Sequence determinants of improved CRISPR sgRNA design. Genome research. 2015;25:1147–1157. doi: 10.1101/gr.191452.115. [DOI] [PMC free article] [PubMed] [Google Scholar]
- Yates A, Akanni W, Amode MR, Barrell D, Billis K, et al. Ensembl 2016. Nucleic Acids Research. 2016;44:D710–D716. doi: 10.1093/nar/gkv1157. [DOI] [PMC free article] [PubMed] [Google Scholar]
Associated Data
This section collects any data citations, data availability statements, or supplementary materials included in this article.
Supplementary Materials
1. Supplementary Table 1. sgRNAs assayed by next-generation sequencing.
All sgRNAs analyzed by next-generation sequencing in this study, with respective protospacer and PAM sequences, electroporation (EP) date and batch, number of reads sequenced, number of indels detected, mutagenesis efficacy rate (Mut%), and various efficacy prediction scores calculated using the CRISPOR website. Ebf.3 was tested either as a plasmid or unpurified traditional PCR and OSO-PCR cassettes (highlighted in yellow, see text for details).
2
Supplementary Table 2. Performance of sgRNA binary classifier using different Fusi/Doench score cutoffs
3. Supplementary Table 3. Correlation of Ebf mutagenesis efficacy and loss-of-function phenotype using different sgRNAs.
Ebf OSO-PCR casette-expressed sgRNAs assayed by loss-of-function phenotype (Isl>mCherry expression) and peakshift analysis.
4
Supplementary Table 4. List of Primers (5′ -> 3′) used to amplify sgRNA target sequences for next-generation sequencing.
5
Supplementary Table 5. Example of data file returned by ab1 Peak Reporter web application, annotated with peakshift analysis for mutagenesis efficacy estimate.
6
Supplementary Table 6. Mutagenesis efficacy (MUT%) of a subset of five sgRNAs estimated by next-generation sequencing (NGS, from Supplementary Table 2) compared to efficacies calculated from peakshift analysis from two biological replicates (Peakshift 1 and Peakshift 2). Predicted Fusi-Doench score (Fusi) is also shown.
7