RB constrains lineage fidelity and multiple stages of tumour progression and metastasis (original) (raw)
. Author manuscript; available in PMC: 2019 Nov 1.
Published in final edited form as: Nature. 2019 May 1;569(7756):423–427. doi: 10.1038/s41586-019-1172-9
Abstract
Mutations in the Retinoblastoma (RB) tumour suppressor pathway are a hallmark of cancer and a prevalent feature of lung adenocarcinoma1,2,3. Despite being the first tumour suppressor to be identified, the molecular and cellular basis underlying selection for persistent RB loss in cancer remains unclear4–6. Methods that reactivate the RB pathway using inhibitors of cyclin-dependent kinases CDK4 and CDK6 are effective in some cancer types and currently under evaluation in lung adenocarcinoma7–9. Whether RB pathway reactivation will have therapeutic effects and if targeting CDK4/6 is sufficient to reactivate RB pathway activity in lung cancer is unknown. Here, we model RB loss during lung adenocarcinoma progression and pathway reactivation in established oncogenic KRAS-driven tumours in the mouse. We show that RB loss enables cancer cells to bypass two distinct barriers during tumour progression. First, RB loss abrogates the requirement for MAPK signal amplification during malignant progression. We identify CDK2-dependent phosphorylation of RB as an effector of MAPK signalling and critical mediator of resistance to CDK4/6 inhibition. Second, RB inactivation deregulates expression of cell state-determining factors, facilitates lineage infidelity, and accelerates the acquisition of metastatic competency. In contrast, reactivation of RB reprograms advanced tumours toward a less metastatic cell state, but is nevertheless unable to halt cancer cell proliferation and tumour growth due to adaptive rewiring of MAPK pathway signalling, which restores a CDK-dependent suppression of RB. Our study demonstrates the power of reversible gene perturbation approaches to identify molecular mechanisms of tumour progression, causal relationships between genes and the tumour suppressive programs they control, and critical determinants of successful therapy.
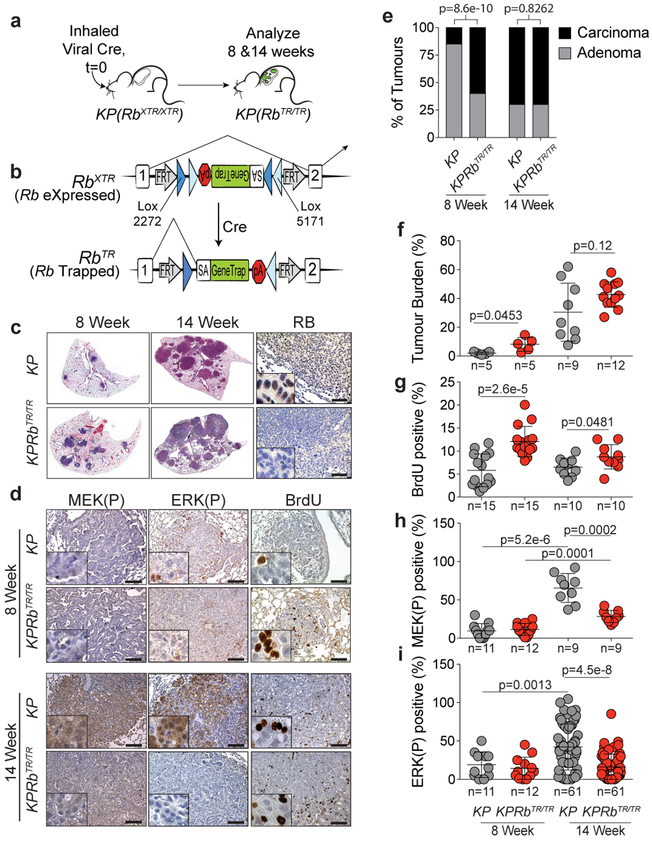
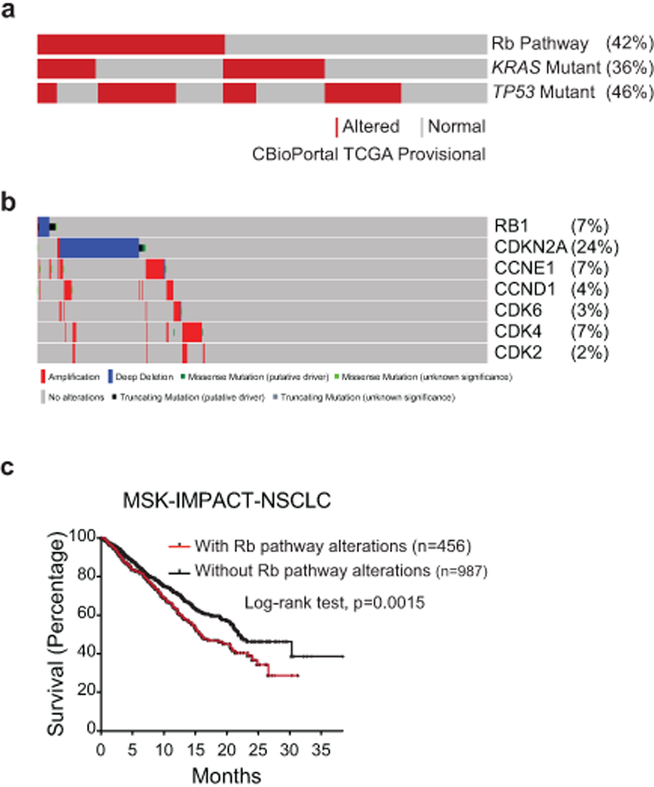
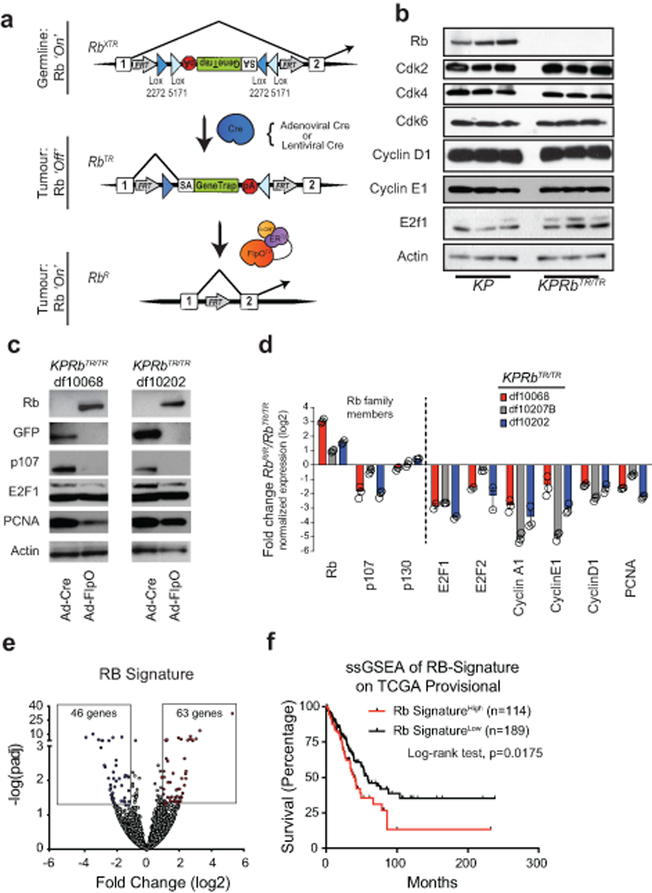
Inactivation of the RB pathway is prevalent in lung adenocarcinoma and decreases overall survival of patients (Extended Data Fig. 1)2,3. Despite the selective pressure to inactivate the RB pathway in lung adenocarcinoma the consequences remain unclear4–6. To model RB loss and therapeutic restoration of the RB pathway in lung tumours in vivo, we developed an Rb1 XTR allele that allows Cre-dependent inactivation of Rb1 and temporally controlled, FlpO-dependent restoration of the endogenous locus (Extended Data Fig. 2)10. We crossed the Rb1 XTR allele into the Kras LSL-G12D/+ ;Trp53 flox/flox (hereafter KP) model of lung adenocarcinoma11. Endotracheal transduction of KP and Kras LSL-G12D/+ ;Trp53 flox/flox ; Rb1 XTR/XTR (hereafter KPRb XTR) mice with a Cre-expressing virus induces expression of oncogenic Kras G12D, deletes Trp53, and converts Rb1 XTR into its trapped Rb1 TR state in lung epithelial cells (Fig. 1a,b). KP tumours robustly expressed RB while KPRb TR tumours lacked RB (Fig. 1c, Extended Data Fig. 2b). Eight weeks post tumour initiation, most KP lesions are slowly proliferating adenomas with a subset (~15%) having early signs of carcinomatous progression that is marked by higher MAPK signalling and proliferation (Fig. 1d,e)11–14. Strikingly, at this time >60% of KPRb TR tumours were already carcinomas, had more proliferating cells and were larger than corresponding KP tumours (Fig. 1e,f,g, Extended Data Fig. 3a–c). However, unexpectedly, the frequent KPRb TR carcinomas did not have high MAPK signalling, marked by phosphorylated-MEK1/2 (MEK(P)) and phosphorylated-ERK1/2 (ERK(P)) (Fig. 1d,h,i, Extended Data Fig. 3a). Fourteen weeks after tumour initiation, the fraction of KP and KPRb TR tumours that were carcinomas was similar. However, despite a high rate of proliferation in both, KP carcinomas had high MEK(P) and ERK(P) while KPRb TR tumours did not (Fig. 1d,e,g–i, Extended Data Fig. 3d). Thus, while RB loss starkly accelerates the transition to carcinoma, it largely abrogates the requirement for MAPK signal amplification to promote malignant progression.
Figure 1: Inactivation of RB abrogates the requirement for MAPK signal amplification during carcinoma progression.
(a) Experimental scheme. (b) XTR cassette at the Rb1 locus. (c) Lungs from KP and KPRb XTR/XTR mice 8 and 14 weeks after tumour initiation. Immunohistochemistry for RB. (d) Immunohistochemistry for MEK(P), ERK(P) and BrdU in KP and KPRb TR/TR tumours 8 and 14 weeks after tumour initiation. (e) Grades for individual tumours. _KP_-8 Week: (n=73 tumours/5 mice), KPRb _TR/TR_-8 Week: (n=112 tumours/5 mice), _KP_-14 Week: (n=380 tumours/9 mice), KPRb _TR/TR_-14 Week: (n=824 tumours/12 mice). Significance by chi-square test (two-sided) for 8 (p=8.6e-10) and 14 week (p=0.8262) time points. (f,g,h,i) Tumor burden and positivity for (g) BrdU, (h) MEK(P), and (i) ERK(P) at 8 and 14 weeks. Symbols represent individual tumours, bar is mean±SD. Significance by unpaired t-test with Welch’s correction (two-tailed). Number of mice analysed as (e). Number of tumours and p values shown. Scale bars=100μM, insets magnified 5x.
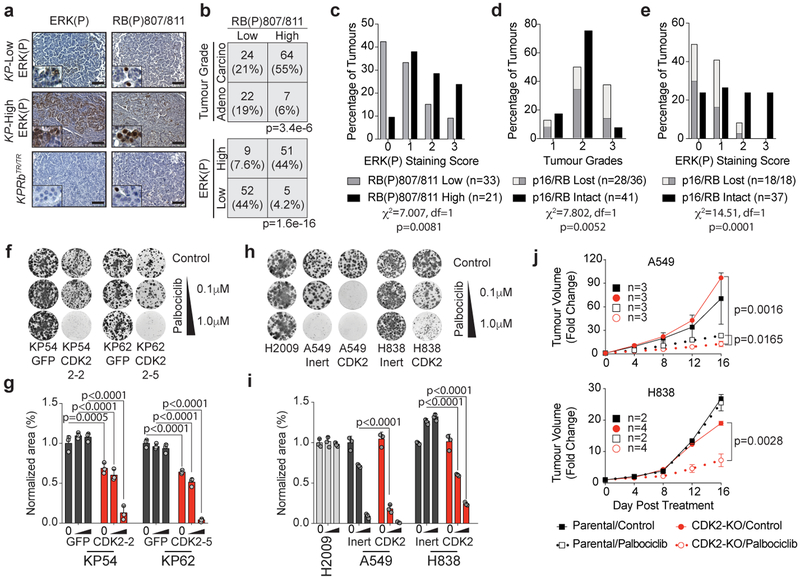
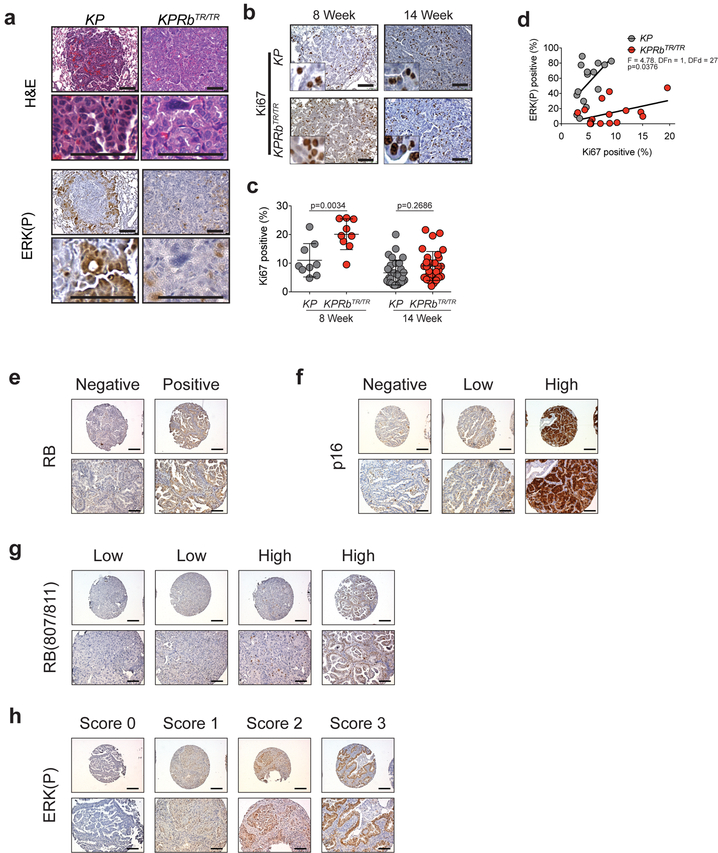
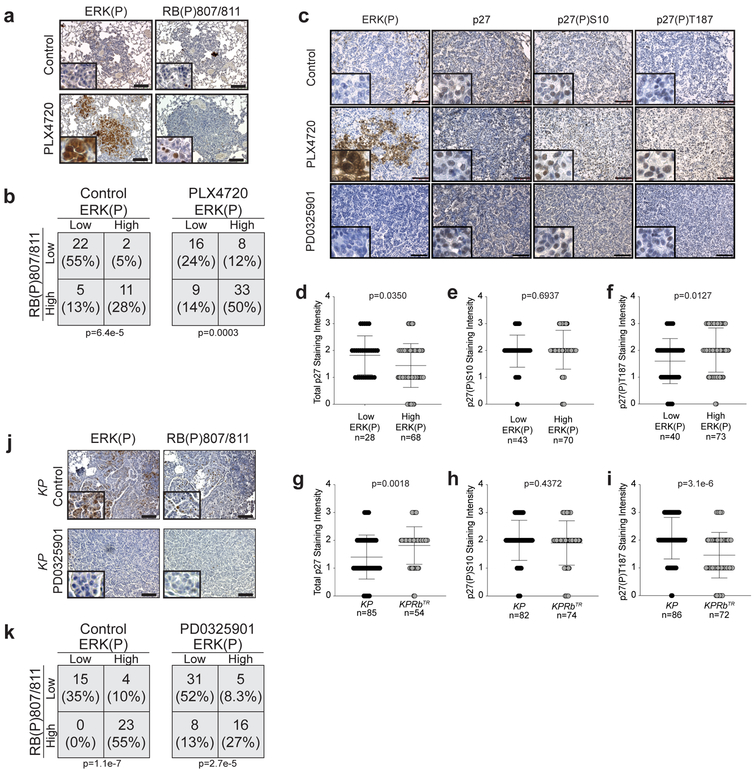
RAS-dependent signalling induces expression of D-type cyclins that bind to CDK4/6 which phosphorylates RB to drive cells out of quiescence and promote G1 progression. CyclinA/E-CDK2 subsequently hyper-phosphorylates RB which allows progression through the G1/S restriction point15. Thus, we determined the phosphorylation status of RB and ERK1/2 in mouse and human lung adenocarcinoma tissues. Tumours with predominantly ERK(P) positive cells also had high RB phosphorylation (RB(P)) which correlated with progression to higher grades (Fig. 2a–d, Extended Data Fig. 3e–h). Human tumours with undetectable expression of RB or p16INK4A had lower ERK(P), similar to that observed in RB deficient mouse tumours (Fig. 2e, Extended Data Fig. 3e–h). KP tumours that either naturally evolved high levels of MAPK signalling, or were pharmacologically induced to amplify MAPK signalling, concurrently had high levels of ERK(P) and RB(P)807/811 (Extended Data Fig. 4a–c). Additionally, these tumours had low p27, a negative regulator of CDK2, and high p27(P)187, a CDK2-dependent activity that promotes p27 degradation (Extended Data Fig. 4d–f)14–20. Conversely, untreated KPRb TR tumours and KP tumours treated with MEK1/2 inhibitor had low ERK(P), RB(P)807/811, and p27(P)187 and higher total p27 (Extended Data Fig. 4c,g–k). These data suggest that amplification of MAPK signalling drives tumour progression by promoting CDK2-dependent suppression of RB.
Figure 2: CDK2 inactivation overcomes intrinsic resistance to CDK4/6 inhibition.
(a) ERK(P) and RB(P)807/811 immunohistochemistry on KP and KPRb TR/TR tumors. (b) Contingency for RB(P)807/811 and tumour grade (top), and RB(P)807/811 and ERK(P) (bottom). Significance by Chi-square test (two-sided), tumour number and p values shown. n=3 mice. (c-e) IHC on human TMAs. (c) ERK(P) in RB-expressing tumours with low or high RB(P)807/811, tumour grade (d) and ERK(P) (e) where RB pathway is lost or intact. Significance by Chi-square test for trend. Number of samples and p values shown. (f) Clonogenic growth of KP54 and KP62 cells with (sgRNA-GFP) or without (sgRNA-CDK2) CDK2 +/− palbociclib. (g) Area covered from (f). Bars indicate mean±SD. Significance determined by ANOVA, Sidak’s multiple comparisons (n=2 biological replicates, n=3 technical replicates), p values (shown) calculated from technical replicates. (h) Clonogenic growth of human cell lines with (sgRNA-Inert) or without (sgRNA-CDK2) CDK2 +/− palbociclib. (i) Area covered from (h). Bars indicate mean±SD. Significance determined by ANOVA, Sidak’s multiple comparisons (n=3 technical replicates), significant p values shown. (j) Xenograft growth of A549 (top) and H838 (bottom) expressing inert or CDK2-targeting sgRNAs. Formation of palpable masses set to day 0 and treatments initiated (t=0). Points indicate mean±SD. Tumour volume significance determined by unpaired t-test (two-tailed) at d16. Mouse number and p values shown. Combination of CDK2-KO and palbociclib treatment is synergistic (A549: CI=0.274 and H838: CI=0.000002237).
Though current strategies to reactivate the RB pathway rely on inhibition of CDK4/6 in tumours where RB is itself intact, we found that palbociclib, a potent inhibitor of CDK4/6, had minimal effects on cell proliferation or colony formation of KP tumour-derived cells (Fig. 2f,g, Extended Data Fig. 5a). In contrast, CDK2 inactivation alone significantly reduced proliferation and colony formation of KP cells expressing wildtype RB and sensitized these cells to palbociclib (Fig. 2f,g, Extended Data Fig. 5a–h). CDK2 inactivation reduced RB(P)807/811 in KP cells, but also led to increased CDK6 and RB(P)780 (Extended Data Fig. 5i). Thus in KP cells, RB is primarily inactivated via CDK2-dependent phosphorylation marked by RB(P)807/811, but in the absence of CDK2, the persistent requirement for RB suppression leads to a compensatory increase of CDK4/6-dependent RB suppression and a de novo vulnerability to CDK4/6 inhibition.
Many human lung adenocarcinoma cell lines are refractory to CDK4/6 inhibition despite expressing wildtype RB (Extended Data Fig. 5j)21. To determine whether loss of CDK2 activity sensitizes human lung adenocarcinoma cells to CDK4/6 inhibition, we inactivated CDK2 using CRISPR in four RB wildtype lines (Extended Data Fig. 5k). In CDK4/6 inhibitor sensitive A549 and EKVX cells, loss of CDK2 further decreased growth upon palbociclib treatment (Fig. 2h,i,j Extended Data Fig. 5l,m). Similar to KP cells, H838 and H1993 cells that are relatively resistant to palbociclib, CDK2 loss created de novo sensitivity to CDK4/6 inhibition (Fig. 2h–j Extended Data Fig. 5l,m). These data suggest that CDK2-specific inhibitors may be a powerful ancillary therapeutic that would synergize with existing CDK4/6-targeted therapies to more potently reactivate the RB pathway and suppress tumour growth.
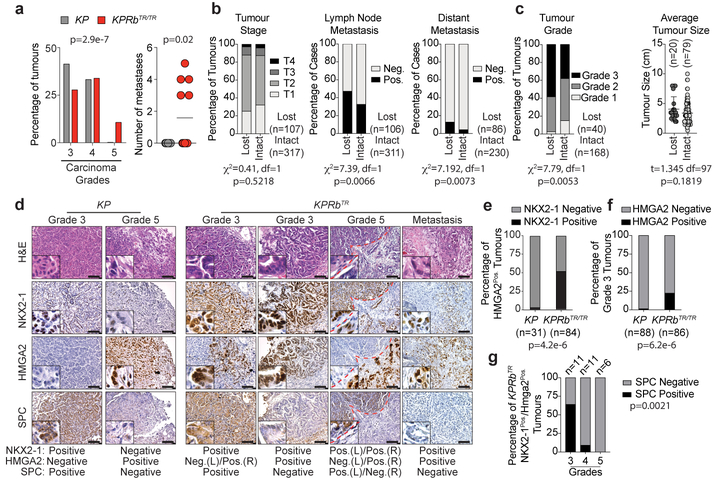
Lung adenocarcinoma progression is marked by a worsening of nuclear pleomorphism (Grades 3 and 4) and the presence of desmoplasia and transition to a poorly differentiated phenotype (Grade 5)11,12. Fourteen weeks after tumour initiation when more advanced tumours are likely to occur, KP carcinomas were primarily Grade 3 and 4, whereas a significant fraction of KPRb TR carcinomas were already Grade 5 lesions (Fig. 3a). Strikingly, ~40% of KPRb TR mice also had widespread metastases to local lymph nodes and/or the pleural cavity. No metastases were observed in KP mice at this time point (Fig. 3a, Extended Data Fig. 6a). Within human lung adenocarcinoma datasets1,22, RB pathway deficiency did not affect tumour stage; generally a measure of size (Fig. 3b). However, patients whose tumours had RB pathway alterations were significantly more likely to have metastases and higher grade tumours indicating a preponderance of poorly differentiated disease (Fig. 3b,c). Prior to gaining metastatic ability, KP tumours silence the lineage-specifying transcription factors NKX2–1 and FOXA2, and derepress HMGA2, a metastasis-associated, chromatin-regulating factor whose expression is normally restricted to embryonic cell types (Fig. 3d,e, Extended Data Fig. 6b)23,24. However, KPRb TR tumours and metastases frequently co-expressed HMGA2, NKX2–1, and FOXA2 (Fig. 3d,e, Extended Data Fig. 6b–d). Moreover, derepression of HMGA2 was frequent in Grade 3 KPRb TR carcinomas that expressed NKX2–1 (Fig. 3d,f). Though no KPRb TR tumours expressed club cell or neuroendocrine markers, a subset lost the surfactant protein C (SPC) lineage mark despite maintaining NKX2–1 and a well-differentiated morphology; a pattern not observed in KP tumours (Fig. 3d,g). Therefore, RB deficiency subverts lineage fidelity and promotes alternative pathways to gain metastatic ability.
Figure 3: RB inactivation accelerates onset of metastasis and enables alternative pathways to gaining metastatic competency.
(a) (Left) Grades for carcinomas 14 weeks after tumour initiation. KP:n=258 tumours/9 mice, KPRb TR/TR:n=580 tumours/12 mice. Significance by Chi-square test for trend (p=2.9e-7). Bars indicate mean±SD. (Right) Metastases per mouse KP:n=9 mice, KPRb TR/TR:n=12 mice. Significance by two-tailed unpaired t-test with Welch’s correction (p=0.0201). Line indicates mean. (b) Tumour stage, lymph node, and distant metastasis in lung adenocarcinoma patients where RB pathway is lost or intact. Significance by Chi-square test for trend (tumour stage) and Chi-square test (two-sided) (lymph node and distant metastasis). Patient number and p values shown. Data from TCGA22. (c) Tumour grade and tumour size of human lung adenocarcinomas where RB pathway is lost or intact. Centre value indicates mean, error bars indicate SD. Significance of tumour grade by Chi-square test for trend, and significance for tumour size by two-tailed unpaired t-test. p values and number of samples shown. Data from Weir et al. (Ref 1) (d) NKX2–1, HMGA2, and SPC immunohistochemistry from KP and KPRb TR/TR tumours. Results summary indicated at bottom. Red dashes separate lower and higher grade regions. (e) Percentage of HMGA2Pos. tumours co-staining for NKX2–1; KP (n=22 tumours/4 mice) and KPRb TR/TR (n=84 tumours/4 mice). Significance by two-sided Chi-square test (p=4.2e-6). (f) Percentage of Grade 3 tumours positive for HMGA2; KP (n=88 tumours/4 mice) and KPRb TR/TR (n=86 tumours/4 mice). Significance by Fisher’s exact test (two-sided, p=6.2e-6). (g) Percentage of SPCPos./SPCNeg. areas by grade in NKX2–1Pos./HMGA2Pos. tumours from individual KPRb TR/TR mice (n=28 tumours/3 mice). Significance by Chi-square test for trend (p=0.0021).
Based on the expression of NKX2–1 and HMGA2, KP cell lines can be classified into those that are derived from tumours that lacked metastatic ability (TnonMet: NKX2–1Pos./HMGA2Neg.) and those that had metastatic potential (TMet: NKX2–1Neg./HMGA2Pos.)23. Because Rb deficiency in KPRb TR tumours promotes metastasis, we determined whether the RB pathway is deregulated spontaneously in metastatic KP tumours. We found that _KP_-TnonMet cell lines strongly express p16INK4A, but that _KP_-TMet cell lines did not (Extended Data Fig. 7a,b). Primary metastatic tumours and extra-pulmonary metastases sorted directly from KP lesions also had significantly fewer p16INK4A-specific transcripts than non-metastatic tumors (Extended Data Fig. 7c,d)25. KPRb TR tumour-derived cell lines also co-expressed NKX2–1 and HMGA2 and therefore did not clearly fit into TMet or TnonMet groups (Extended Data Fig. 7e). When injected subcutaneously in syngeneic mice, multiple KP and KPRb TR lines grew at similar rates at the injection site, but KPRb TR tumours seeded ~4-fold more metastases in the lung as well as frequent metastases to the liver, diaphragm, and pleura. KPRb TR tumours also formed >3-fold more liver metastases than _KP_-TMet cell lines after intrasplenic injection (Extended Data Fig. 7f,g,h,i). Thus, the RB pathway plays a critical role constraining acquisition of metastatic competency.
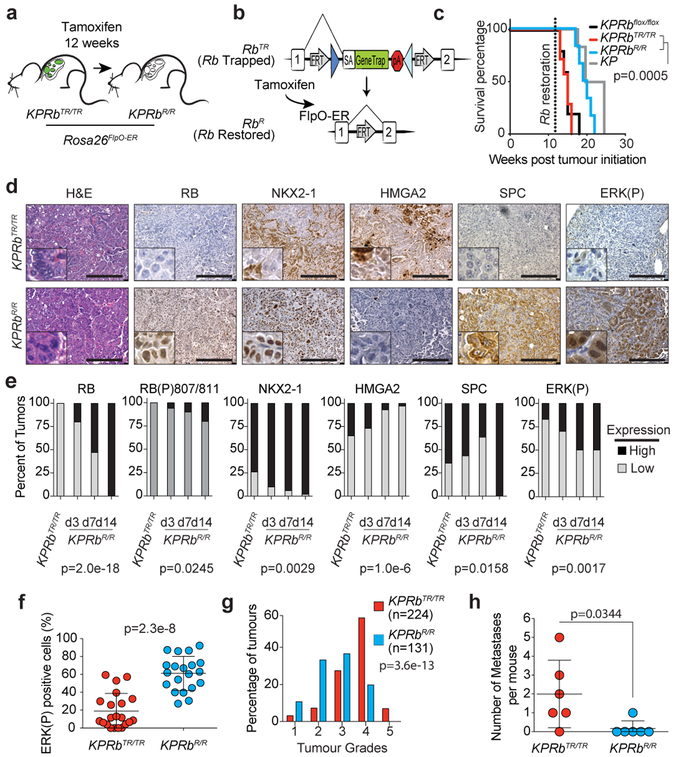
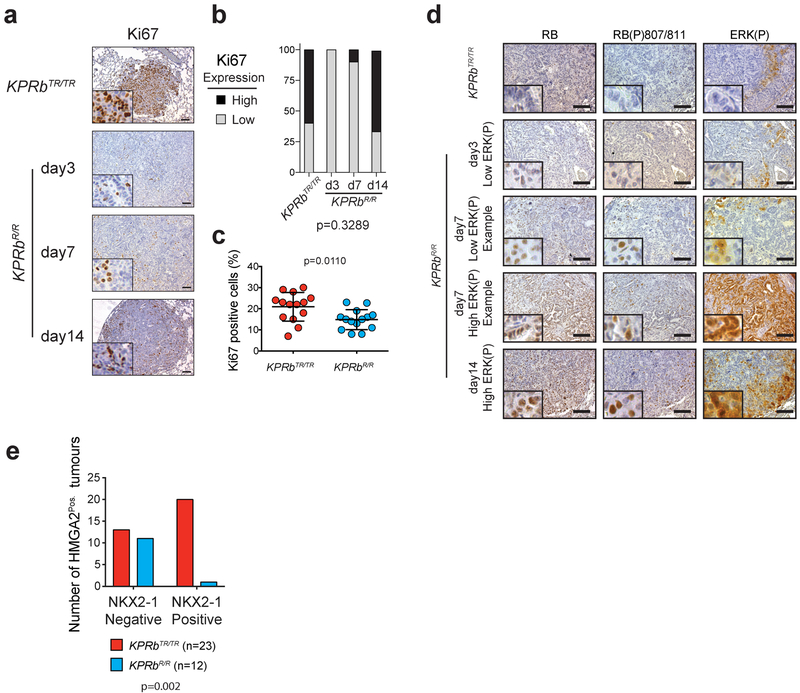
The Rb1 XTR allele allowed us to model therapeutic reactivation of the RB pathway in lung tumours growing within their autochthonous environment by crossing a Rosa26 FlpO-ER allele onto the KPRb XTR mouse line26. Twelve weeks after tumour initiation, we administered tamoxifen to activate FlpO-ER and restore RB expression (Rb R) (Fig. 4a,b). Although we observed only a small decrease in the average rate of tumour growth, RB reactivation significantly extended overall survival by >4 weeks and was indistinguishable from mice bearing KP tumours which expressed RB throughout the course of their development (Fig. 4c, Extended Data Fig. 8a–d). Thus the tumour suppressive effects of RB reactivation, although therapeutic, can be blunted, possibly by similar mechanisms active in KP tumours. We also performed IHC and determined the grades of KPRb TR, and KPRb R tumours 3, 7, and 14 days after RB reactivation. Though RB expression was heterogeneous early after RB reactivation, by 14 days RB expression was homogeneous in KPRb R tumours (Fig. 4d,e, Extended Data Fig. 8d). KPRb R tumours had significantly less Ki67 staining than KPRb TR tumours 3 days after RB reactivation, but equilibrated to a level that was only modestly less than KPRb TR tumours (Extended Data Fig. 9a–c). Surprisingly, the number of tumours with predominant ERK(P) and RB(P)807/811 staining progressively increased after RB reactivation (Fig. 4d–f, Extended Data Fig. 9d). In contrast to the transient effect on proliferation, RB reactivation had a progressive effect on the histological state of KPRb R tumours. HMGA2 expression became increasingly less frequent and less likely to be co-expressed with NKX2–1, and NKX2–1 and SPC expression became more frequent (Fig. 4d,e, Extended Data Fig. 9e). Whereas, KPRb TR tumours were predominately Grade 4 and some Grade 5 lesions, KPRb R tumours reverted toward lower grades with most tumours being either Grade 2 or 3, and dramatically reduced metastases present 14 days after RB reactivation (Fig. 4g,h). Thus, reinstating RB pathway activity in advanced tumours only transiently represses cell proliferation due to an adaptive rewiring of MAPK signalling. However, importantly RB progressively reprograms tumours toward less aggressive cell states that are unlikely to metastasize.
Figure 4: RB reactivation reprograms tumours toward a less advanced state.
(a) Experimental scheme. (b) Conversion of Rb TR (Trapped) allele to Rb R (Restored). (c) Kaplan–Meier survival analysis; KP, KPRb TR/TR, KPRbR/R (n=6 mice each), and KPRb flox/flox (n=5 mice). Significance by two-sided Log-rank test (p=0.0005). (d) RB, Ki67, NKX2–1, HMGA2, SPC, and ERK(P) IHC in KPRb TR/TR and KPRb R/R tumours two weeks post RB restoration. Quantification in Extended Data Fig. 9e. (e) Expression patterns for RB, RB(P)807/811, NKX2–1, HMGA2, SPC, and ERK(P) in KPRb TR/TR from Fig.4d (n=35 tumours/3 mice) and KPRb R/R tumours on day(d) d3 (n=30 tumours/4 mice), d7 (n=30 tumours/4 mice) and d14 (n=34 tumours/3 mice) post RB restoration. RB(P)807/811 analysis from n=20 tumours/2 mice for 0, 7 and 14 day time points, and n=18 tumours/2 mice for 3 day time point. Significance determined by chi-square test for trend, p values shown. (f) Percentage of ERK(P) positive cells two weeks post RB restoration (n=21 KPRb TR/TR, n=20 KPRb R/R tumours, 1 mouse each). Significance by unpaired t-test with Welch’s correction (two-tailed, p=2.3e-8). Bar indicates mean±SD. (g) KPRb TR/TR (n=224 tumours/4 mice) and KPRb R/R (n=131 tumours/4 mice) tumour grades. Significance by chi-square test for trend (p=3.6e-13). (h) Metastases in KPRb TR/TR and KPRb R/R mice (n=6 each) two weeks post RB restoration. Significance by two-sided unpaired t-test (p=0.0344). Bar indicates mean±SD. Scale bars=100μM, insets magnified 5x.
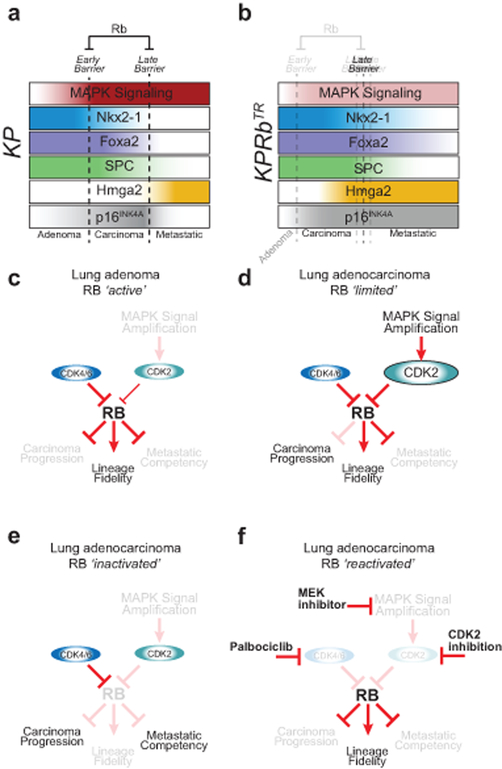
RB is a pleiotropic tumour suppressor with canonical roles that respond to mitogenic cues and regulate cell cycle progression, as well as multiple less well-understood non-canonical roles that regulate plasticity of cellular states5,6. Our study uncovered RB suppression as a major effect of oncogenic MAPK signal transduction during early carcinoma progression, and highlighted RB’s role of maintaining lineage commitment as a critical barrier to the development of metastatic disease (Extended Data Fig. 10a,b). We identified CDK2 as an effector of MAPK signalling and determinant of the success of cancer therapies aimed at reactivating the RB pathway, reinforcing the need for potent and selective CDK2 inhibitors (Extended Data Fig. 10c–f)27. Finally, our data reveal that therapies that aim to reactivate the RB pathway may have tumour suppressive effects, not by suppressing cell proliferation, but instead by reverting cell state changes associated with advanced tumour progression.
Methods
Animal studies and treatment:
Animal studies were performed under strict compliance with Institutional Animal Care and Use Committee at University of Pennsylvania (#804774). Kras LSL-G12D (Jax Stock #008179), p53 flox/flox (Jax Stock #008462), Rb XTR (Ref.10), and Rosa26 FlpO-ER22 mice have previously been described. Mice are mixed strain B6J/129S4vJae. Mice were transduced with either 2.5×10⁷ plaque-forming units (PFUs) Ad:CMV-Cre (Ad5CMVCre) obtained from University of Iowa Viral Vector Core, or Cre-expressing lentivirus (PGK-Cre) at 6×10⁴ or 1×10⁴ PFUs/mouse for survival or micro-computed tomography (uCT) respectively11. Micro-CT acquisition was performed on u-CT (MI Labs) with Acquisition 7.45 software. Image reconstruction and visualization used performed with MI Labs REC-7.09. Analysis of individual tumour volumes were determined by constructing 3-dimensional tomograms within MicroView v2.5 (Parallax Innovations Inc.). Lentivirus production and titering was performed as described previously29. Rodent Lab Diet (AIN-76A) was formulated with PLX4720 at 417 mg/kg or PD0325901 7 mg/kg by Research Diets. For Rb restoration, mice were treated with tamoxifen on 2 consecutive days with 200 μl of a 20 mg/ml solution dissolved in 90% sterile corn oil and 10% ethanol by oral gavage. BrdU incorporation was performed by injecting mice at 30 mg/kg (Sigma B5002) into the peritoneal cavity (i.p.) 16–24 hours prior to necropsy. Mice in survival studies were monitored for lethargy, labored breathing, and weight loss, at which time animals were euthanized. No statistical methods were used to predetermine sample sizes. The size of each animal cohort was determined by estimating biologically relevant effect sizes between control and treated groups and then using the minimum number of animals that could reveal statistical significance using the indicated tests of significance. All animal studies were randomized in ‘Control’ or ‘Treated’ groups. However, all animals housed within the same cage were generally placed within the same treatment group. For analysis of tumour grades sample identity and group identity were blinded from histopathological assessment. Animal sex was randomized at the time of treatment group assignment.
CRISPR design and production:
sgRNAs to target the second exon of CDK2 were designed using the optimized CRISPR design tool (crispr.mit.edu). sgRNA duplexes were Golden Gate cloned into BsmBI sites of the LentiCRISPRv2Puro vector to produce GFP-, Inert-, and _CDK2_-targeting lentivirus30,31. The sgRNAs used for targeting Cas9 are: GFP(GGGCGAGGAGCTGTTCACCG)31, Inert (GCTTGAGCACATACGCGAAT)32, and CDK2(GATCTCTCGGATGGCAGTAC) which targets both mouse and human CDK2.
Xenograft studies:
A549 and H838 (Control and _CDK2_-KO) cells were injected into the right flank of male NCRNude (Taconic) or NOD Rag1 −/− ;Il2rg −/− (Jackson) mice respectively, at a density of 5×10⁵ and 5×10⁶ cells/mouse with Matrigel (Corning) respectively. Tumour volume was determined using calipers at the indicated time points. Once tumours reached ~25mm3, the mice were divided into control (vehicle) and treatment (Palbociclib Isethionate (LC Laboratories)) groups and treated with 150 mg/kg daily for 16 days by oral gavage. During the experimental time course subcutaneous tumours never grew above 1.0 cm3.
Immunohistochemistry and Immunofluorescence:
Lung and tumour tissues were dissected into 10% Neutral buffered formalin overnight at room temperature before dehydration in a graded alcohol series. Paraffin-embedded and hematoxylin/eosin (H&E) stained histological sections were produced at the Abramson Family Cancer Research Institute Histopathology Core. Human lung tissue microarrays were assembled and provided by C. D., and purchased from US Biomax Inc. (LC706a). Immunostaining for both murine tissue and human tissue microarrays was performed after citrate-based antigen retrieval with antibodies targeting GFP [Cell Signaling; 2956], phosphorylated MEK 1/2 [Cell Signaling; cs2338], phosphorylated ERK 1/2 [Cell Signaling; cs4370], BrdU [BD Transduction Laboratories; 347580], Ki67 [Vector Laboratories; VP-RM04], NKX2–1 [Abcam; ab76013], HMGA2 [Biocheck; 59170AP], FOXA2 [Cell Signaling; 8186], SPC [Millipore; AB3786], CC10 [Santa Cruz; sc-9772], phospho-RB Ser807/811 [Cell Signaling; cs8516], p27 [BD Biosciences; 610241], phospho-p27 S10 [Abcam; ab62364], phospho-p27 T187 [Abcam; ab75908]. RB [Abcam; ab181616] immunostaining was performed after EDTA (pH 8.0)-based antigen retrieval. Immunostaining for p16 was performed by the Pathology Clinical Service Center at the Hospital of the University of Pennsylvania. ABC reagent (Vector Laboratories, PK-4001) and ImmPACT DAB (Vector Laboratories SK-4105) were prepared and used according to the product instructions. Immunofluorescence was performed on the paraffin-embedded sections following the same antigen retrieval protocol. Sections were incubated in primary antibody for 16–20 hours at 4°C and then exposed to fluorescent secondary detection (Invitrogen; Anti-rabbit-Alexa594 [A21207] & Anti-mouse-Alexa647 [A31571]) for 1 hour at room temperature in the dark. Photomicrographs were captured on a Leica DMI6000B inverted light and fluorescent microscope.
Histological quantification:
ImageJ software was used to determine the percent of lung area occupied by tumour on H&E-stained slides, and the frequency of cells staining positive for specified antigens as a fraction of total tumour cells. Data points represent individual mice for tumour burden graphs and individual tumours for BrdU, Ki67, MEK(P), ERK(P), and RB(P)807/811 by IHC. Histological quantification of mouse tumours was performed by quantifying the frequency of cells staining positive and then scoring High and low as follows: For Ki67 and RB(P)807/811: <10% positive cells/tumour = low, ≥10% positive cells/tumour = high. For ERK(P), NKX2–1, HMGA2, SPC, and RB: <30% positive cells/tumour = low and ≥30% positive cells/tumour = high. For p27, p27(P)S10 and p27(P)T187, staining score for each tumour was determined based on staining intensity scored from 0 (no staining) to 3 (very dark staining). For comparisons of ERK(P) and p27, p27(P)S10 and p27(P)T187, ERK(P) low tumours were defined as <30% positive cells/tumour, and ERK(P) high tumours were defined as ≥70% positive cells/tumour. PennVet Comparative Pathology Core determined individual mouse tumour grades by using established tumour-grading schemes in experiments12,33. Histological quantification of human tissue microarrays was performed by quantifying the frequency of cells staining positive and the staining intensity for RB, p16, ERK(P), and RB(P)807/811. RB positive and p16 positive tumours were both defined as those with greater than 20% of cells having medium or strong staining intensity, and the RB pathway was designated as intact if the tumour was positive for both RB and p16. RB(P)807/811 high tumours were defined as those containing greater than 10% positive cells. ERK(P) staining was scored on a 4 point scale with score 0 indicating no staining, score 1 indicating either low staining or less than 20% of cells with medium/high staining, score 2 indicating medium staining in greater than 20% of cells, and score 3 indicating high staining in greater than 20% of cells.
In Vivo Metastasis Models:
KP and KPRb TR/TR cells were subcutaneously implanted in the lower right flank of B6129PF1/J mice (Jax #100492) at 5×10⁴ cells per inoculum. Mice were aged for 6 weeks post inoculation and then sacrificed. Primary tumour, lung, liver, and kidney tissues were collected and processed for histology. Mice were visually examined for macroscopic metastatic tumours and lung metastases were quantified from H&E stained sections. For the intrasplenic injection model of metastasis, B6129PF1/J mice were anesthetized with isoflurane. The left subcostal area was shaved, then prepped with 70% ethanol and iodine. A small incision was made in line with the left ear through the peritoneum. Through the excision, the exposed spleen was divided by placing a microvascular clip down the center. Tumour cells were injected at a concentration of 1×10⁵ in a 50μl volume of PBS. After 10 minutes a microvascular clip was placed on the downstream vasculature at the injection site, and then the spleen was removed. Mice were allowed to age for 4 weeks at which time they were euthanized, and macroscopic liver metastases were counted. During the experimental time course subcutaneous tumours never grew above 1.0 cm3 and mice with liver tumours were never under duress (Body condition less that 2) during the experiment.
Laser Capture Microdissection:
Laser capture microdissection was performed from 4μm paraffin-embedded histological sections, mounted on membrane slides (Molecular Machines & Industries #50102). Tumour cells were captured using a Nikon Eclipse TE2000-S onto isolation caps (Molecular Machines & Industries #50202). DNA was isolated from samples according to the guidelines in the PicoPure DNA Extraction Kit (Thermo Fisher Scientific KIT0103). DNA was used as template in quantitative PCR to measure the conversion of Rb TR to Rb R by amplifying the GFP portion of the Rb TR allele. The reaction was normalized to Gapdh and compared to standardized DNA ratios of Rb TR and Rb R alleles. Primers used for GFP (FW: 5’-GACGTAAACGGCCACAAGTT-3’ and RV: 5’-GAACTTCAGGGTCAGCTTGC-3’) and Gapdh (FW 5’-TGTCCGTCGTGGATCTGAC-3’ and RV 5’-CCTGCTTCACCACCTTCTTG-3’).
Cell lines:
Murine cell lines were generated from primary mouse tumors and propagated using standard techniques. Human lung adenocarcinoma cell lines were obtained from ATCC or NIH Cell line repository. HEK293FT cells used for lentivirus production were obtained from Invitrogen. GreenGo cells used for titering lentivirus were obtained from Tyler Jack’s Laboratory and are a derivative of NIH3T3 cells. Mouse cell lines were authenticated for genotype. Human and mouse lung cancer cell lines were tested for the expected, genotype-associated protein expression patterns by western blot. HEK293FT cells used for lentivirus production were validated by verifying high titter virus production was possible. NIH3T3-GreenGo cells were validated by measuring Cre-induced GFP expression. All human cell lines tested negative for mycoplasma as performed by the cell line repository or manufacturer. Mouse cell lines were not tested. Human lung adenocarcinoma cell lines H2009 and A549 were grown in F12K media and H838, EKVX, and H1993 were grown in RPMI. Mouse cell lines were derived from individual lung tumours from Kras LSL-G12D ; Trp53 flox/flox (KP) and Kras LSL-G12D/+ ; Trp53 flox/flox ; Rb XTR/XTR (KPRb XTR/XTR) mice. In brief, tumours were excised from the lungs of mice, dissociated with trypsin for 60 min, and then quenched with fetal bovine serum. Digested tumours were passed through a 40μm cell strainer and cultured in high glucose-containing DMEM supplemented with 10% fetal bovine serum, GlutaMAX, and antibiotics at 37 °C and 5% CO2 until cell line establishment. Proliferation of cell lines was determined by plating the indicated cell number and analysed by manual cell counts using a hemocytometer at time points indicated. Cell cycle analysis was performed according to manufacturer’s instruction in the APC BrdU Flow Kit (BD Pharmingen). Clonogenic survival assays were performed by plating 500 cells per well in a 6 well plate. After ~16 hours cells were treated with DMSO or palbociclib (Selleck Chemicals) at the indicated doses every 3 days for 1.5 or 3.5 weeks. Cells were then fixed by incubating in ice-cold methanol for 10 minutes and then stained with crystal violet dye for 15 minutes. Plates were imaged and the relative area covered by cell colonies was determined with ImageJ software.
Immunoblot analysis:
KP and KPRb TR/TR cells were lysed in RIPA buffer, resolved on NuPage 4–12% Bis-Tris protein gels (Thermo Fisher), and transferred to polyvinylidene fluoride (PVDF) membranes. Blocking, primary, and secondary antibody incubation were performed in Tris-buffered saline [TBS] with 0.1% Tween20. Total ERK 1/2 [Cell Signaling; cs4696], CDK2 [Abcam; ab32147], CDK4 [Abcam; ab199728], CDK6 [Abcam; ab151247], Beta-Actin [Sigma Aldrich; A2066], Hsp90 [BD Transduction Laboratories; 610418], pRb(S790) [cell signalling; 9307], p16 [Abcam; ab211542], and Cyclin D1 [Abcam; ab16663] were assessed by western blotting. Actin and Hsp90 were used to control for loading. All other antibodies are the same as indicated for immunohistochemistry.
RNA-sequencing and human dataset analysis:
For RNA-sequencing, RNA was isolated from 4 KP and 4 KPRbTR lung tumour-derived cell lines using the RNeasy Mini Kit (Qiagen) per manufacturer’s instructions. RNA concentration was measured using the Qubit RNA HS Assay Kit (Invitrogen) and sample quality was determined using the RNA 6000 Nano Kit on a 2100 BioAnalzyer (Agilent). Sequencing libraries were prepared using the TruSeq Stranded mRNA Library Prep Ki (Illumina) per manufacturer’s instructions and subjected to 75 bp paired end sequencing on the Illumina NextSeq 500 platform. Fastq files for each sample were aligned against the mouse genome, build GRCm38.p4, using the STAR aligner (v2.5.2b)34. FeatureCounts (v1.5.0-p1) was used to quantify alignments against the mouse genomic annotations from Gencode (vM11)35. Differentially expressed genes were identified with DESeq2 (v1.14.0)36, and an RB Signature gene signature was defined as genes with a false discovery rate adjusted p-value less than 0.05 and log2 fold change greater than ±0.8 (46 genes down and 63 genes up in KPRb TR cells). Single sample gene set enrichment analysis (ssGSEA) was performed at https://genepattern.broadinstitute.org/gp/ using the ssGSEAProjection module37. Provisional TCGA Lung Adenocarcinoma z-score mRNA expression data extracted from CBioPortal was used as the input expression dataset and the RB Signature gene signature was used as the gene set28. RB SignatureHigh samples were defined as those with an enrichment score greater than 1000, and RB SignatureLow samples were defined as those with an enrichment score less than −1000. Kaplan Meier analysis was performed to examine the differential survival of the RB SignatureHigh samples and RB SignatureLow samples. MSK-IMPACT-NSCLC survival analysis was performed by Kaplan Meier analysis using data from CBioPortal3,28. Rb pathway alterations were defined as mutations or copy number alterations in RB, CDKN2A, CDK2, CDK4, CDK6, CCND1 or CCNE1. For Oncomine-based analyses of tumour stage, lymph node metastasis, distant metastasis, tumour grade and tumour size, loss of the Rb pathway was defined as a loss of 1 or more copy of RB or CDKN2A, or a gain of 1 or more copy of CDK2, CDK4, CDK6, CCND1 or CCNE11,2,38. For analysis of p16:Arf ratios in murine tumours and metastases, RNA-sequencing data was downloaded from GEO (Chuang et al., accession GSE84447) using SRA Toolkit and aligned against the mouse genome, build GRCm38.p6, using the STAR aligner (v2.5.2b). BAM files were indexed using samtools (v.1.9) and read counts at Cdkn2a exon 1α (p16) and exon 1β (Arf) were quantified using Integrative Genomics Viewer (v.2.4.10). Outliers were defined as greater than Q3 + 1.5x interquartile range or less than Q1 – 1.5x interquartile range and excluded. Sashimi plots were generated using Integrative Genomics Viewer (v.2.4.10), as were read counts from the Cdkn2a locus for TMet and TNonmet cell lines.
Statistics and Reproducibility:
All analyses were performed in the Prism (v7.0a) software package. For tumour burden, BrdU, Ki67, ERK(P), MEK(P), p27, p27(P)S10 and p27(P)T187, ratio of p16:Arf reads and human tumour size, unpaired Student’s t-tests were performed. For tumour grade distribution, human tumour stage distribution, and ERK(P) staining in relation to RB pathway status and RB(P)807/811 staining, contingency analyses with chi-square test for trend was used. Other contingency analyses used standard chi-square test. Log rank (Mantel-Cox) test was performed to determine significance in survival studies. Compusyn software (ComboSyn, Inc.) was used to evaluate synergism between CDK4/6 inhibition and CRISPR-mediated knockout of CDK232. For Figures 1c and 1d experiments were repeated 5 times each for 8 week mice and 9 and 12 times for 14 week KP and KPRb TR/TR mice respectively, with similar results. For Figure 2a, the experiment was repeated 3 times on separate mice, with similar results. For Figure 3d, the experiment was repeated 4 times in KP mice and 6 times in KPRb TR/TR mice for HMGA2 and NKX2–1 staining, with similar results. The experiment was repeated 3 times each in KP and KPRb TR/TR mice for SPC staining, with similar results. For Figure 4d, the experiment was repeated 3 or more times for KP and KPRb TR/TR mice, with similar results each time. For Extended Data Figure 2b and 2c the experiments were repeated twice with similar results. For Extended Data Figure 3a the experiment was repeated 5 times each for KP and KPRbTR/TR mice. For Extended Data Figure 3b the experiment was repeated twice for 8-week time points, and 3 times for 14-week time points. For Extended Data Figures 3e–h all stains were repeated twice with similar results. For Extended Data Figure 4a, the experiment was repeated 4 times for control treated mice and 5 times for PLX4720-treated mice. For Extended Data Figure 4j, the experiment was repeated twice for control mice and 3 times for PD035901-treated mice. For Extended Data Figure 5i and 5l the experiments were repeated twice with similar results. For Extended Data Figure 5k the experiment was repeated over 5 times with similar results. For Extended Data Figures 6a–d, the experiment was repeated 5 times on separate mice. For Extended Data Figure 6e the experiment was repeated 3 times on separate mice. For Extended Data Figure 7a and 7e the experiments were repeated 3 times each with similar results. For Extended Data Figure 7h the experiment was repeated 3 or more times for each cell line. For Extended Data Figure 8b and c the experiment was repeated 6 times each for KPRb TR/TR and KPRb R/R mice. For Extended Data Figure 9a the experiment was repeated 3 times for each time point. For Extended Data Figure 9d the experiment was repeated 2 times for each time point.
Supplementary Material
1
2
Extended Data
Extended Data Fig.1: The RB pathway is frequently altered in human lung adenocarcinoma.
(a) Oncoprint from CBioPortal showing frequency and co-occurrence of mutations and copy number alterations in RB pathway components, KRAS, and TP53 in the provisional lung adenocarcinoma TCGA dataset2,28.
(b) RB pathway components and their corresponding mutation frequencies in the provisional lung adenocarcinoma TCGA dataset.
(c) Kaplan-Meier survival analysis of lung adenocarcinoma patients whose tumours do (n=456 patients) or do not (n=987 patients) contain alterations in RB pathway members. Patient data was obtained from the MSK-IMPACT clinical sequencing cohort. Significance was determined by two-sided Log-rank test (p=0.0015). Source data can be found at cBioPortal.
Extended Data Fig. 2: Rb XTR allows Cre-dependent inactivation and FlpO-dependent reactivation of RB.
(a) Top: Rb XTR (eXpressed): XTR gene trap cassette consists of a splice acceptor (SA), GFP complementary DNA “GeneTrap”, and the polyadenylation transcriptional terminator sequence (pA). Stable inversion is achieved by the use of two pairs of mutually-incompatible mutant LoxP sites (Lox2272 and Lox5171) arranged in the ‘double-floxed’ configuration. In the germline and in normal somatic cells RB expression is normal in Rb XTR/XTR mice (Ref. 10). Middle: Rb TR (Trapped): Inhalation of Cre-expressing adenoviral or lentiviral vectors induces the permanent conversion of the Rb XTR allele to Rb TR allele that inactivates RB gene expression. Transcripts are spliced from the upstream exon to the GFP reporter gene and downstream transcription is terminated to functionally inactivate gene function. RB expression is inactivated only in the tumour cells. Bottom: Rb R (Restored): The Rosa26FlpO-ERT2 allele enables tamoxifen-dependent conversion of trapped Rb TR to its restored Rb R allelic state via excision of the gene trap.
(b) Western blot analysis of 3 KP and 3 KPRb TR tumour derived cell lines.
(c) Western blot analysis of 2 KPRb TR tumour derived cell lines treated with Adeno-Cre as a control, or Adeno-FlpO to restore RB expression.
(d) Quantitative RT-PCR analysis of 3 KPRb TR tumour-derived cell lines treated with Adeno-FlpO to restore RB expression. data are normalized to Adeno-Cre treated cells for control. Log2 fold change +/− standard deviation is shown. n=3 technical replicates for each cell line.
(e) Volcano plot of differentially expressed genes from RNA-seq data obtained from KP (n=4) versus KPRb TR/TR (n=4) cell lines. The RB Signature, defined by genes whose expression change is ≥ 2-fold and p-value adjusted for multiple testing ≤ 0.05, is boxed. Statistical significance determined by two-sided Wald’s test using Benjamini-Hochberg correction via DESEQ2.
(f) Kaplan-Meier survival analysis of lung adenocarcinoma patients whose tumours exhibit a high (n=114 patients) or low (n=189 patients) RB Signature. Significance was determined by two-sided Log-rank test (p=0.0175).
Extended Data Fig. 3: RB deficiency is associated with low MAPK pathway signalling in mouse and human lung adenocarcinomas.
(a) H&E images of KP and KPRb TR/TR tumours 8 weeks post tumour initiation. Corresponding IHC for ERK(P) (bottom).
(b) IHC for Ki67 in KP and KPRb TR/TR tumours 8 and 14 weeks post tumour initiation.
(c) Quantification of Ki67 positive cells from (b). Symbols represent individual tumours (_KP_-8 week: n=9 tumours from 2 mice; KPRb _TR/TR_-8 week: n=9 tumours from 2 mice; _KP_-14 week: n=31 tumours from 3 mice; KPRb _TR/TR_-14 week: n=31 tumours from 3 mice). Significance was determined by two-sided unpaired t-test with Welch’s correction for 8 week (p=0.0034) and 14 week analyses (p=0.2686). Line indicates mean±SD.
(d) Plot showing the relationship of ERK(P) positive fraction versus Ki67 positive fraction in KP (n=15 tumours from 2 mice) and KPRb TR/TR (n=16 tumours from 2 mice) tumours at 14 weeks after tumour initiation. Significance was determined by linear regression analysis (p=0.0376).
(e) Immunohistochemistry for RB depicting an RB-negative core (left) and an RB-positive core (right).
(f) Immunohistochemistry for p16 depicting a p16-negative core (left), a core with low staining (middle) and a core with high staining (right).
(g) Immunohistochemistry for RB(P)807/811 depicting two examples of cores with low expression (left), and high expression (right).
(h) Immunohistochemistry for ERK(P) depicting a core with an ERK(P) staining score of 0 (left), a score of 1 (middle-left), a score of 2 (middle-right), and a score of 3 (right).
Scale bars=100μM, inset images are magnified 5x further.
Extended Data Fig. 4: RB and p27 phosphorylation are enhanced by MAPK signal amplification and suppressed by MEK1/2 inhibition.
(a) Representative images of IHC for ERK(P) and RB(P)807/811 in KP tumours treated with vehicle control or Braf inhibitor PLX4720.
(b) Contingency analysis of ERK(P) and RB(P)807/811 from (a) (n=40 tumours from 4 mice treated with vehicle control and n=66 tumours from 5 mice treated with PLX4720). Significance was determined by chi square test (two-sided) for vehicle treated group (p=6.4e-5) and for PLX4720 treated group (p=0.0003).
(c) Representative images of IHC for ERK(P), p27, p27(P)S10 and p27(P)T187 in KP tumours treated with vehicle control, Braf inhibitor PLX4720, or MEK inhibitor PD0325901. Tumour sections were stained with p27(P)Ser10 antibody as a measure of non-CDK2-dependent suppression of p27. Significant changes in phosphorylation at this site were not observed.
(d) Analysis of p27 levels in ERK(P) low (n=28) and ERK(P) high (n=68) tumours as determined by immunohistochemistry in KP and KPRbTR mice. n=2 KP mice and n=2 KPRb TR/TR mice. Centre value is the mean +/− SD. Significance was determined by two-tailed unpaired t-test (p=0.0350).
(e) Analysis of p27(P)S10 levels in ERK(P) low (n=43) and ERK(P) high (n=70) tumours as determined by immunohistochemistry in KP and KPRbTR mice. n=2 KP mice and n=2 KPRb TR/TR mice. Significance was determined by two-tailed unpaired t-test (p=0.6937).
(f) Analysis of p27(P)T187 levels in ERK(P) low (n=40) and ERK(P) high (n=73) tumours as determined by immunohistochemistry in KP and KPRbTR mice. n=2 KP mice and n=2 KPRb TR/TR mice. Significance was determined by two-tailed unpaired t-test (p=0.0127).
(g) Analysis of p27 levels in KP (n=85) and KPRbTR (n=54) tumours as determined by immunohistochemistry. n=2 KP mice and n=2 KPRb TR/TR mice. Significance was determined by two-tailed unpaired t-test (p=0.0018).
(h) Analysis of p27(P)S10 levels in KP (n=82) and KPRbTR (n=74) tumours as determined by immunohistochemistry. n=2 KP mice and n=2 KPRb TR/TR mice. Significance was determined by two-tailed unpaired t-test (p=0.4372).
(i) Analysis of p27(P)T187 levels in KP (n=86) and KPRbTR (n=72) tumours as determined by immunohistochemistry. n=2 KP mice and n=2 KPRb TR/TR mice. Centre value is the mean +/− SD. Significance was determined by two-tailed unpaired t-test (p=3.1e-6).
(j) Representative images of IHC for ERK(P), and RB(P)807/811 in KP tumours treated with vehicle control or MEK1/2 inhibitor PD0325901.
(k) Contingency analysis of ERK(P) and RB(P)807/811 from (c) (n=42 tumours from 2 mice treated with vehicle control and n=60 tumours from 3 mice treated with PD0325901). Significance was determined by chi square test (two-sided) for vehicle treated group (p=1.1e-7) and for PD0325901 treated group (p=2.7e-5).
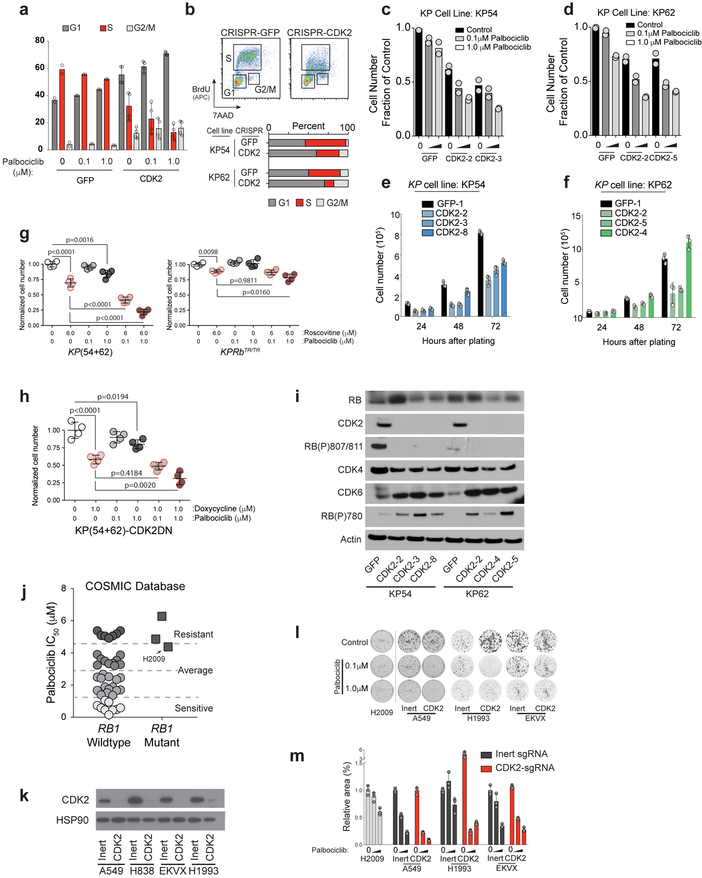
Extended Data Fig. 5: CDK2 blockade enhances the effects of CDK4/6 inhibition in mouse KP and human lung adenocarcinoma cell lines.
(a) BrdU/7AAD double labeling of KP clones expressing GFP (n=1 biological replicate) or CDK2 (n=2 biological replicates) targeting sgRNAs with 0, 0.1, or 1.0 μM palbociclib. Percentage of cells in G1, S or G2/M phase are shown (2 technical replicates for each sample). Bars indicate mean±SD where appropriate.
(b) Cell cycle analysis (BrdU/7AAD double labeling) of KP clones expressing GFP (n=1 clone per cell line) or Cdk2 (n=2 clones per cell line) targeting sgRNAs. Percentage of cells in each stage of the cell cycle are graphically represented (bottom).
(c,d) Cell proliferation assay performed in duplicate showing number of cells 3 days after initial plating treated with 0, 0.1, or 1.0 μM palbociclib for either KP54 (c) or KP62 (d) cells. Two independent Cdk2 KO clones and Control GFP cells are shown. Bars indicate the mean.
(e,f) Cell proliferation assay performed in triplicate showing number of cells 24, 48, and 72 hours after initial plating for KP54 (e) or KP62 (f) cells. Three independent Cdk2 KO clones and one control is shown. Bars indicate mean±SD. Significance was determined by ANOVA, Dunnett’s multiple comparisons test (n=3 for all). (e) 24 hour GFP compared to CDK2–2 (p=0.0013), CDK2–3 (p=0.0029), CDK2–8 (p=0.0302). 48 hour GFP compared to CDK2–2 (p<0.0001), CDK2–3 (p<0.0001), CDK2–8 (p=0.0052). 72 hour GFP compared to CDK2–2 (p<0.0001), CDK2–3 (p<0.0001), CDK2–8 (p<0.0001). (f) 48 hour GFP compared to CDK2–2 (p=0.0415). 72 hour GFP compared to CDK2–2 (p<0.0001), CDK2–5 (p<0.0001).
(g) Proliferation of KP (left) and KPRb TR/TR (right) cells in quadruplicate, 72 hours after addition of roscovitine (red outlines) and/or palbociclib (increasing grey tones) at the indicated concentrations. Cell numbers normalized to the average of the vehicle (DMSO) only controls (white). Bars indicate mean±SD. Significance was determined by ANOVA, Dunnett’s multiple comparisons test (n=4 for all). KP control compared to 6 μM Roscovitine (p<0.0001) or 1 μM Palbociclib (p=0.0016). KP 6 μM Roscovitine compared to 6 μM Roscovitine + 0.1 μM Palbociclib (p<0.0001) or 6 μM Roscovitine + 1 μM Palbociclib (p<0.0001). KPRb TR/TR control compared to 6 μM Roscovitine (p=0.0098). KPRb TR/TR 6 μM Roscovitine compared to 6 μM Roscovitine + 0.1 μM Palbociclib (p=0.9811) or 6 μM Roscovitine + 1 μM Palbociclib (p=0.0160).
(h) Proliferation of KP cells in quadruplicate, stably transduced with a tet-regulated dominant negative CDK2 allele (CDK2DN) 72 hours after addition doxycyclin (red) and/or palbociclib (increasing grey tones). Cell numbers normalized to the average of the vehicle (DMSO) only controls (white). Bars indicate mean±SD. Significance was determined by ANOVA, Dunnett’s multiple comparisons test (n=4 for all). Control compared to 1 μM Doxycycline to induce CDK2DN (p<0.0001) or 1 μM Palbociclib (p=0.0194). 1 μM Doxycycline compared to 1 μM Doxycycline + 0.1 μM Palbociclib (p=0.4184) or 1 μM Doxycycline + 1 μM Palbociclib (p=0.0020).
(i) Analysis of KP clones targeted with GFP-targeting or CDK2-targeting sgRNAs. Western blot for RB pathway component expression: RB, RB(P)807/811, CDK2, CDK4, CDK6, and RB(P)780. Actin controls for loading.
(j) Effects of CDK4/6 inhibition and CDK2 knock out on human lung adenocarcinoma cell lines. data mined from the Sanger Center’s COSMIC database21 showing the relative sensitivity (IC50) of independent human lung adenocarcinoma cells lines to palbociclib.
(k) Western blot showing CDK2 loss following CRISPR-mediated knock out in indicated human lung adenocarcinoma cell lines. Hsp90 controls for loading.
(l) Representative images of clonogenic survival analysis of human lung adenocarcinoma cell lines performed in triplicate, treated every 3 days for 1.5 weeks with 0, 0.1, or 1.0 μM palbociclib. Cell lines were targeted with either an inert sgRNA or one targeting CDK2.
(m) Quantification of culture area covered by cells in (l). Dark grey bars indicate inert sgRNA and red bars indicate Cdk2 sgRNA. Bars indicate mean±SD. Significance was determined by ANOVA, Sidak’s multiple comparisons test (n=3 for all). A549 with inert sgRNA compared to CDK2 sgRNA in combination with either 0 μM palbociclib (p>0.9999), 0.1 μM palbociclib (p=1.0e-6) or 1 μM palbociclib (p=0.0023). H1993 with inert sgRNA compared to CDK2 sgRNA in combination with either 0 μM palbociclib (p=2.7e-7), 0.1 μM palbociclib (p=0.0331) or 1 μM palbociclib (p=0.6557). EKVX with inert sgRNA compared to CDK2 sgRNA in combination with either 0 μM palbociclib (p=0.5412), 0.1 μM palbociclib (p=0.0003) or 1 μM palbociclib (p=0.5929).
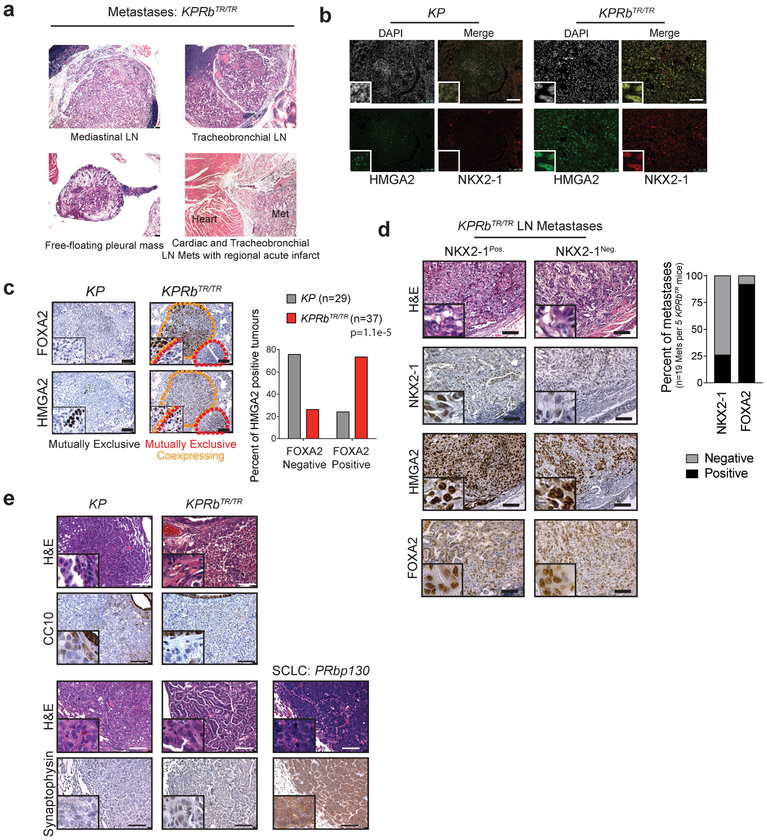
Extended Data Fig. 6: Loss of RB promotes alternative pathways toward gaining metastatic competency.
(a) H&E photomicrographs of metastases that formed from KPRb TR/TR tumours.
(b) Immunofluorescence analysis of KP and KPRb TR/TR tumours for co-expression of HMGA2 and NKX2–1.
(c) IHC staining of serial sections from KP and KPRb TR/TR tumours for HMGA2 and FOXA2. Orange dotted lines outline mutually exclusive staining and red dotted lines outline co-expressing staining patterns. Quantification of staining pattern (right) showing percentage of HMGA2 positive tumours from KP (n=29 tumours from 3 mice) or KPRb TR/TR (n=37 tumours from 3 mice) mice that are positive or negative for FOXA2. Significance was determined by chi-square test (two-sided, p=1.1e-5).
(d) Histological analysis of KPRb TR/TR metastases. H&E and IHC for NKX2–1, HMGA2 and FOXA2 on serial sections from representative metastases that are NKX2–1 positive or negative. Results are tabulated in the adjacent graph.
(e) IHC staining of KP and KPRb TR/TR tumours for club (CC10) and neuroendocrine (synaptophysin) cell markers. For control and comparison, a synaptophysin positive small cell lung cancer from a p_53_ flox/flox; Rb flox/flox; p130 flox/flox mouse model is shown46.
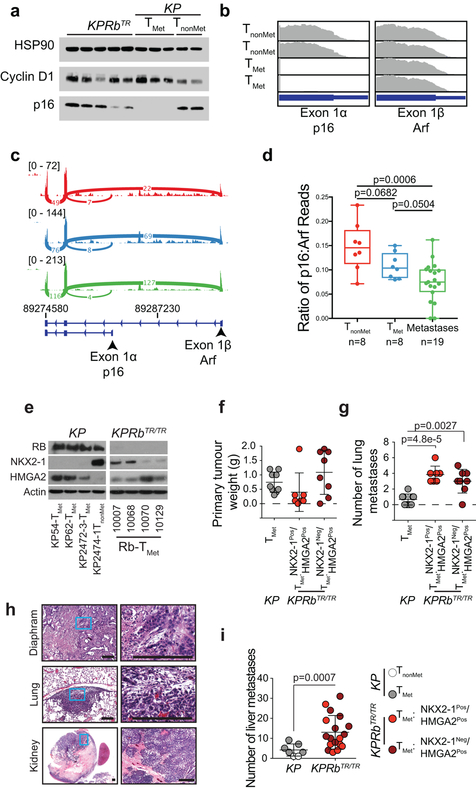
Extended Data Fig. 7: Loss of p16 or RB is associated with increased metastatic proclivity.
(a) Western blot analysis of KPRbTR and KP (TMet and TnonMet) tumour-derived cell lines examining Cyclin D1 and p16 expression. HSP90 controls for loading.
(b) RNA-Sequencing reads at the Cdkn2a locus for KP TNonMet (n=2) and TMet (n=2) cell lines. Reads from Exon 1α coding for p16 (left) and Exon 1β coding for Arf (right) are shown.
(c) Representative Sashimi plots comparing the number of p16 and Arf exon-spanning reads from the Cdkn2a locus. Plots are shown for a representative TNonmet tumour (red), TMet tumour (blue), and metastasis (green). The number reads that span each exon-exon junction is displayed. The range of minimum to maximum read count for the given plot is displayed in the upper left corner.
(d) Quantification of the ratio of p16 to Arf reads from the Cdkn2a locus. RNA-sequencing results examining TnonMet tumours (n=8), TMet tumours (n=8) and extrapulmonary metastases (n=19) were obtained from GEO (Chuang et al., accession GSE84447). Significance for each comparison was determined by two-tailed unpaired t-test (TnonMet vs TMet: p=0.0682; TMet vs metastases: p=0.0504; TnonMet vs metastases: p=0.0006). Data is represented with box and whisker plots with the line indicating the median and whiskers indicating the minimum and maximum values.
(e) Western blot analysis of KP and KPRb TR/TR tumour-derived cell lines for NKX2–1, HMGA2, and RB. Actin controls for protein loading.
(f,g) Analysis of subcutaneous tumour growth (f) and associated lung metastases (g) of KP and KPRb TR/TR tumour-derived cell lines from (e). Symbols represent individual mice injected with either one of 2 KP-TMet cell lines (n=4 and 5 mice per cell line), 2 KPRb TR/TR NKX2–1Pos./HMGA2Pos. cell lines (n=3 and 4 mice per cell line) or 2 KPRb TR/TR NKX2–1Neg./HMGA2Pos. cell lines (n=4 mice per cell line). Significance was determined by unpaired t-test with Welch’s correction (two-tailed). (f) Primary tumour weight: KP vs KPRb TR/TR NKX2–1Pos./HMGA2Pos. (p=0.2508), and KP vs KPRb TR/TR NKX2–1Neg./HMGA2Pos. (p=0.2727). (g) Lung metastases: KP vs KPRb TR/TR NKX2–1Pos./HMGA2Pos. (p=4.8e-5), and KP vs KPRb TR/TR NKX2–1Neg./HMGA2Pos. (p=0.0027). Centre lines indicate the mean +/− SD.
(h) H&E photomicrographs of representative metastases from KPRb TR/TR cell line allografts.
(i) Liver metastases after intrasplenic injection of KP and KPRb TR/TR tumour-derived cell lines (top) from Extended Data Fig. 5i. Symbols represent individual mice injected with either a _KP_-TNonMet cell line (n=2 mice), a _KP_-TMet cell line (n=5 mice), 2 KPRb TR/TR NKX2–1Pos./HMGA2Pos. cell lines (n=4 mice for each cell line) or 2 KPRb TR/TR NKX2–1Neg./HMGA2Pos. cell lines (n=5 mice for each cell line). Significance was determined by two-tailed unpaired t-test with Welch’s correction (p=0.0007). Centre lines indicate the mean +/− SD.
Scale bars=100μM.
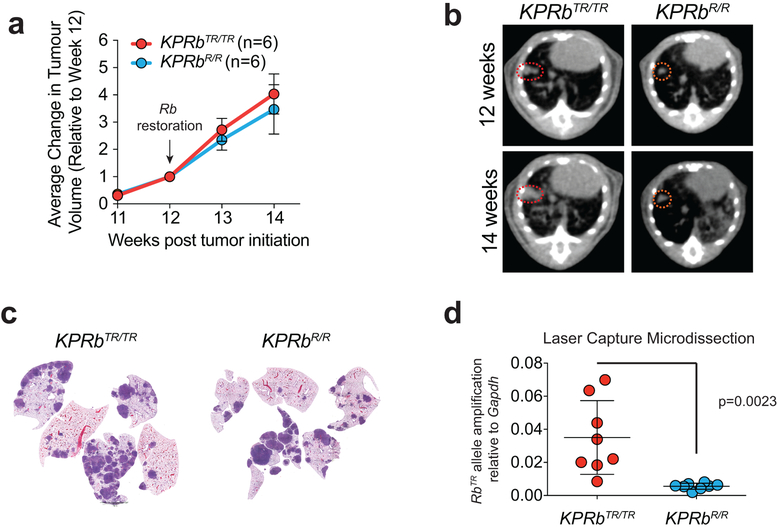
Extended Data Fig. 8: Growth of lung adenocarcinomas after RB reactivation.
(a) Imaging of individual tumour growth by μCT. Images taken weekly starting 11 weeks post tumour initiation. RB reactivation (tamoxifen treatment) initiated at week 12. Average fold change after week 12 is shown. KPRb TR/TR:n=6 mice; KPRb R/R:n=6 mice. data points indicate the mean±SD. Significance at 14 weeks was determined by unpaired t-test (two-tailed, p=0.2617).
(b) Representative μCT images quantified in (a).
(c) Low power scans of sections through tumour lobes showing relative tumour burden 2 weeks after RB reactivation in KPRb TR/TR and KPRb R/R cohorts.
(d) Quantitative PCR detection of the GFP cDNA within the Rb TR allele. DNA templates for PCR were isolated by laser capture microdissection of individual tumours. KPRb TR/TR: n=8 tumours from 2 mice, KPRb R/R: n=8 tumours from 2 mice. Significance was determined by two-tailed unpaired t-test (p=0.0023). Bar indicates the mean±SD.
Extended Data Fig. 9: Impact of RB reactivation of proliferation, MAPK signaling, and RB phosphorylation.
(a) Ki67 IHC of KPRb TR/TR, and KPRb R/R tumours 3, 7, and 14 days after Rb restoration.
(b) Quantification of (a) (n=10 tumours from 3 mice for 0, 3 and 7 day time points, and n=15 tumours from 3 mice for the 14 day time point). Significance was determined by chi-square test for trend (p=0.3289).
(c) Quantification of the percentage of total tumour cells that are Ki67 positive in KPRb TR/TR (n=14 tumours from 1 mouse) and KPRb R/R (n=14 tumours from 1 mouse) tumours 14 days post Rb restoration. Significance was determined by two-tailed unpaired t test with Welch’s correction (p=0.0110). Line indicates the mean±SD.
(d) IHC for RB, RB(P)807/811, and ERK(P) in KPRb TR/TR, and KPRb R/R tumours 3, 7, and 14 days after Rb restoration. Scale bars=100μM, insets are magnified 5x further.
(e) Contingency test for Nkx2–1Pos./Hmga2Pos. KPRb TR/TR (n=23 tumours from 2 mice) and KPRb R/R (n=12 tumours from 2 mice) tumours two weeks post Rb restoration. Significance was determined by chi-square test (two-sided, p=0.0019).
Extended Data Fig. 10: RB controls multiple barriers to tumour progression and is repressed by multiple pathways that will require multiple pharmacological interventions to reverse.
(a) In the KP model, adenomas transit through an ‘Early Barrier’ that limits progression to the carcinoma state by amplifying the MAPK signalling cascade (red). The ‘Late Barrier’ limits the onset of metastatic ability and is characterized by the loss of lineage fidelity marked by lost expression of lineage-specific transcription factors NKX2–1 (blue) and FOXA2 (purple), and the differentiation marker of alveolar type 2 cells, SPC (green). Loss of these lineage commitment factors precedes the derepression of the embryonic restricted chromatin factor HMGA2 that functionally drives metastasis and marks the metastatic cell state (yellow). Down regulation of p16INK4a expression is associated with the metastatic cell state (grey).
(b) The additional deletion of RB in the KPRb TR model alters the molecular trajectory of these tumours by first abrogating the ‘Early Barrier’ through eliminating the requirement for MAPK signal amplification (lack of red), and then by facilitating loss of lineage fidelity to overcome and blur the ‘Late Barrier’. Carcinomatous KPRb TR tumours can rapidly derepress HMGA2 (yellow) and lose lineage identity marker SPC (green) however, loss of lineage fidelity is unlinked from NKX2–1 and FOXA2 that normally enforce lung cell identity in these tumours. Interestingly, metastatic primary tumours and distant metastases can sometimes maintain expression of NKX2–1 (blue) and FOXA2 (purple). Expression of p16INK4a is maintained in RB deficient metastatic cell states (grey).
(c) In lung adenomas that maintain RB, RB tumour suppressor activity blocks progression to carcinomatous stages and the onset of metastatic cell states, and enforces lineage fidelity.
(d) In lung adenocarcinomas that maintain RB expression, MAPK signal amplification activates CDK2-dependent hyper-phosphorylation of RB to promote carcinoma progression.
(e) Inactivation of RB removes early barriers that limit carcinoma progression, removes constraints that reinforce lineage fidelity, and disrupts late barriers that suppress metastatic competency.
(f) Reactivation of RB in tumours that lack RB pathway function highlights a need for a multi-pronged approach to inhibit CDK4/6 as well as CDK2 and/or MAPK pathway signalling (e.g. through MEK inhibition) to fully reactivate RB-mediated tumour suppression. These data emphasize the need for the development of selective CDK2 inhibitors.
Acknowledgements:
We thank J. Wang and A. Bedenbaugh for histology, E. Blankemeyer for computed tomography, Plexxikon for the gift of PLX4720, I. Asangani for help with sequencing, H. Ehly and ULAR staff for animal husbandry, and R. Greenberg, M. Winslow, and members of the Feldser Laboratory for manuscript critique. This work is supported by: NIH grants (R00CA158581, R21CA205340 R01CA193602, and R01CA222503 to D.M.F., T32ES019851 to M.C., and T32CA115299 to K.S.), American Lung Association (LCD400095 to D.M.F.), American Cancer Society, (PF-16–22401TBE to T.Y.), and the Penn Abramson Cancer Center grant NIH P30-CA016520.
Footnotes
Author information: The authors disclose no potential conflicts of interest.
Supplementary Information is available in the online version of the paper.
Data Availability Statement
All data generated or analysed during this study are included in this published article (and its supplementary information files) with the exception of raw RNA-Seq data associated with Extended Data Fig. 2e,f which have been deposited publicly in the Gene Expression Omnibus under accession number GSE128506. Raw data associated with Fig. 1e,f,g,h,i; Fig. 2b,c,d,e,g,i,j; Fig. 3a,b,c,e,f,g; Fig. 4c,e,f,g,h; ED Fig. 2d,e,f; ED Fig. 3c,d; ED Fig. 4b,d,e,f,g,h,i,k; ED Fig. 5a,b,c,d,e,f,g,h,j,m; ED Fig. 6c,d; ED Fig. 7d,f,g,i; ED Fig. 8a,d; and ED Fig. 9b,c,e are available in the Supplementary Information section. Raw images from Western Blots are displayed in Supplementary Figure 1. Gels with multiple bands per lane or in which specific lanes were selected show an indication of how the gels were cropped for the final figure. For ED Fig. 2b, ED Fig. 2c, ED Fig. 5i, ED Fig. 5k and ED Fig. 7e, controls were run in separate gels as sample processing controls; for ED Fig. 7a, loading controls for each gel are provided in the raw data.
REFERENCES
- 1.Weir BA, et al. Characterizing the cancer genome in lung adenocarcinoma. Nature 450, 893–898 (2007). [DOI] [PMC free article] [PubMed] [Google Scholar]
- 2.Comprehensive molecular profiling of lung adenocarcinoma. Nature 511, 543–550 (2014). [DOI] [PMC free article] [PubMed] [Google Scholar]
- 3.Zehir A, et al. Mutational landscape of metastatic cancer revealed from prospective clinical sequencing of 10,000 patients. Nat Med 23, 703–713 (2017). [DOI] [PMC free article] [PubMed] [Google Scholar]
- 4.Ho VM, Schaffer BE, Karnezis AN, Park KS & Sage J The retinoblastoma gene Rb and its family member p130 suppress lung adenocarcinoma induced by oncogenic K-Ras. Oncogene 28, 1393–1399 (2009). [DOI] [PMC free article] [PubMed] [Google Scholar]
- 5.Dyson NJ RB1: a prototype tumor suppressor and an enigma. Genes Dev 30, 1492–1502 (2016). [DOI] [PMC free article] [PubMed] [Google Scholar]
- 6.Dick FA, Goodrich DW, Sage J & Dyson NJ Non-canonical functions of the RB protein in cancer. Nat Rev Cancer 18, 442–451 (2018). [DOI] [PMC free article] [PubMed] [Google Scholar]
- 7.Fry DW, et al. Specific inhibition of cyclin-dependent kinase 4/6 by PD 0332991 and associated antitumor activity in human tumor xenografts. Mol Cancer Ther 3, 1427–1438 (2004). [PubMed] [Google Scholar]
- 8.Patnaik A, et al. Efficacy and Safety of Abemaciclib, an Inhibitor of CDK4 and CDK6, for Patients with Breast Cancer, Non-Small Cell Lung Cancer, and Other Solid Tumors. Cancer Discov 6, 740–753 (2016). [DOI] [PubMed] [Google Scholar]
- 9.Zhou J, et al. Palbociclib, a selective CDK4/6 inhibitor, enhances the effect of selumetinib in RAS-driven non-small cell lung cancer. Cancer Lett 408, 130–137 (2017). [DOI] [PubMed] [Google Scholar]
- 10.Robles-Oteiza C, et al. Recombinase-based conditional and reversible gene regulation via XTR alleles. Nat Commun 6, 8783 (2015). [DOI] [PMC free article] [PubMed] [Google Scholar]
- 11.DuPage M, Dooley AL & Jacks T Conditional mouse lung cancer models using adenoviral or lentiviral delivery of Cre recombinase. Nat Protoc 4, 1064–1072 (2009). [DOI] [PMC free article] [PubMed] [Google Scholar]
- 12.Jackson EL, et al. The differential effects of mutant p53 alleles on advanced murine lung cancer. Cancer Res 65, 10280–10288 (2005). [DOI] [PubMed] [Google Scholar]
- 13.Feldser DM, et al. Stage-specific sensitivity to p53 restoration during lung cancer progression. Nature 468, 572–575 (2010). [DOI] [PMC free article] [PubMed] [Google Scholar]
- 14.Cicchini M, et al. Context-Dependent Effects of Amplified MAPK Signaling during Lung Adenocarcinoma Initiation and Progression. Cell Rep 18, 1958–1969 (2017). [DOI] [PMC free article] [PubMed] [Google Scholar]
- 15.Sherr CJ & McCormick F The RB and p53 pathways in cancer. Cancer Cell 2, 103–112 (2002). [DOI] [PubMed] [Google Scholar]
- 16.Woods D, et al. Raf-induced proliferation or cell cycle arrest is determined by the level of Raf activity with arrest mediated by p21Cip1. Mol Cell Biol 17, 5598–5611 (1997). [DOI] [PMC free article] [PubMed] [Google Scholar]
- 17.Donovan JC, Milic A & Slingerland JM Constitutive MEK/MAPK activation leads to p27(Kip1) deregulation and antiestrogen resistance in human breast cancer cells. J Biol Chem 276, 40888–40895 (2001). [DOI] [PubMed] [Google Scholar]
- 18.Gysin S, Lee SH, Dean NM & McMahon M Pharmacologic inhibition of RAF-->MEK-->ERK signaling elicits pancreatic cancer cell cycle arrest through induced expression of p27Kip1. Cancer Res 65, 4870–4880 (2005). [DOI] [PubMed] [Google Scholar]
- 19.Hatzivassiliou G, et al. RAF inhibitors prime wild-type RAF to activate the MAPK pathway and enhance growth. Nature 464, 431–435 (2010). [DOI] [PubMed] [Google Scholar]
- 20.Poulikakos PI, Zhang C, Bollag G, Shokat KM & Rosen N RAF inhibitors transactivate RAF dimers and ERK signalling in cells with wild-type BRAF. Nature 464, 427–430 (2010). [DOI] [PMC free article] [PubMed] [Google Scholar]
- 21.Tate JG, et al. COSMIC: the Catalogue Of Somatic Mutations In Cancer. Nucleic Acids Res 47, D941–D947 (2019). [DOI] [PMC free article] [PubMed] [Google Scholar]
- 22.Cancer Genome Atlas Research, N. Comprehensive genomic characterization of squamous cell lung cancers. Nature 489, 519–525 (2012). [DOI] [PMC free article] [PubMed] [Google Scholar]
- 23.Winslow MM, et al. Suppression of lung adenocarcinoma progression by Nkx2–1. Nature 473, 101–104 (2011). [DOI] [PMC free article] [PubMed] [Google Scholar]
- 24.Li CM, et al. Foxa2 and Cdx2 cooperate with Nkx2–1 to inhibit lung adenocarcinoma metastasis. Genes Dev 29, 1850–1862 (2015). [DOI] [PMC free article] [PubMed] [Google Scholar]
- 25.Chuang CH, et al. Molecular definition of a metastatic lung cancer state reveals a targetable CD109-Janus kinase-Stat axis. Nat Med 23, 291–300 (2017). [DOI] [PMC free article] [PubMed] [Google Scholar]
- 26.Lao Z, Raju GP, Bai CB & Joyner AL MASTR: a technique for mosaic mutant analysis with spatial and temporal control of recombination using conditional floxed alleles in mice. Cell Rep 2, 386–396 (2012). [DOI] [PMC free article] [PubMed] [Google Scholar]
- 27.Asghar U, Witkiewicz AK, Turner NC & Knudsen ES The history and future of targeting cyclin-dependent kinases in cancer therapy. Nat Rev Drug Discov 14, 130–146 (2015). [DOI] [PMC free article] [PubMed] [Google Scholar]
- 28.Walter DM, et al. Systematic In Vivo Inactivation of Chromatin-Regulating Enzymes Identifies Setd2 as a Potent Tumor Suppressor in Lung Adenocarcinoma. Cancer Res 77, 1719–1729 (2017). [DOI] [PMC free article] [PubMed] [Google Scholar]
- 29.Sanjana NE, Shalem O & Zhang F Improved vectors and genome-wide libraries for CRISPR screening. Nat Methods 11, 783–784 (2014). [DOI] [PMC free article] [PubMed] [Google Scholar]
- 30.Shalem O, et al. Genome-scale CRISPR-Cas9 knockout screening in human cells. Science 343, 84–87 (2014). [DOI] [PMC free article] [PubMed] [Google Scholar]
- 31.Wang T, Wei JJ, Sabatini DM & Lander ES Genetic screens in human cells using the CRISPR-Cas9 system. Science 343, 80–84 (2014). [DOI] [PMC free article] [PubMed] [Google Scholar]
- 32.Nikitin AY, et al. Classification of proliferative pulmonary lesions of the mouse: recommendations of the mouse models of human cancers consortium. Cancer Res 64, 2307–2316 (2004). [DOI] [PubMed] [Google Scholar]
- 33.Chou TC Drug combination studies and their synergy quantification using the Chou-Talalay method. Cancer Res 70, 440–446 (2010). [DOI] [PubMed] [Google Scholar]
- 34.Dobin A, et al. STAR: ultrafast universal RNA-seq aligner. Bioinformatics 29, 15–21 (2013). [DOI] [PMC free article] [PubMed] [Google Scholar]
- 35.Liao Y, Smyth GK & Shi W featureCounts: an efficient general purpose program for assigning sequence reads to genomic features. Bioinformatics 30, 923–930 (2014). [DOI] [PubMed] [Google Scholar]
- 36.Love MI, Huber W & Anders S Moderated estimation of fold change and dispersion for RNA-seq data with DESeq2. Genome Biol 15, 550 (2014). [DOI] [PMC free article] [PubMed] [Google Scholar]
- 37.Barbie DA, et al. Systematic RNA interference reveals that oncogenic KRAS-driven cancers require TBK1. Nature 462, 108–112 (2009). [DOI] [PMC free article] [PubMed] [Google Scholar]
- 38.Cerami E, et al. The cBio cancer genomics portal: an open platform for exploring multidimensional cancer genomics data. Cancer Discov 2, 401–404 (2012). [DOI] [PMC free article] [PubMed] [Google Scholar]
- 39.Rhodes DR, et al. ONCOMINE: a cancer microarray database and integrated data-mining platform. Neoplasia 6, 1–6 (2004). [DOI] [PMC free article] [PubMed] [Google Scholar]
Associated Data
This section collects any data citations, data availability statements, or supplementary materials included in this article.
Supplementary Materials
1
2
