APE1/Ref-1 interacts with NPM1 within nucleoli and plays a role in the rRNA quality control process - PubMed (original) (raw)
. 2009 Apr;29(7):1834-54.
doi: 10.1128/MCB.01337-08. Epub 2009 Feb 2.
Damiano Fantini, Milena Romanello, Laura Cesaratto, Marta Deganuto, Antonio Leonardi, J Pablo Radicella, Mark R Kelley, Chiara D'Ambrosio, Andrea Scaloni, Franco Quadrifoglio, Gianluca Tell
Affiliations
- PMID: 19188445
- PMCID: PMC2655621
- DOI: 10.1128/MCB.01337-08
APE1/Ref-1 interacts with NPM1 within nucleoli and plays a role in the rRNA quality control process
Carlo Vascotto et al. Mol Cell Biol. 2009 Apr.
Abstract
APE1/Ref-1 (hereafter, APE1), a DNA repair enzyme and a transcriptional coactivator, is a vital protein in mammals. Its role in controlling cell growth and the molecular mechanisms that fine-tune its different cellular functions are still not known. By an unbiased proteomic approach, we have identified and characterized several novel APE1 partners which, unexpectedly, include a number of proteins involved in ribosome biogenesis and RNA processing. In particular, a novel interaction between nucleophosmin (NPM1) and APE1 was characterized. We observed that the 33 N-terminal residues of APE1 are required for stable interaction with the NPM1 oligomerization domain. As a consequence of the interaction with NPM1 and RNA, APE1 is localized within the nucleolus and this localization depends on cell cycle and active rRNA transcription. NPM1 stimulates APE1 endonuclease activity on abasic double-stranded DNA (dsDNA) but decreases APE1 endonuclease activity on abasic single-stranded RNA (ssRNA) by masking the N-terminal region of APE1 required for stable RNA binding. In APE1-knocked-down cells, pre-rRNA synthesis and rRNA processing were not affected but inability to remove 8-hydroxyguanine-containing rRNA upon oxidative stress, impaired translation, lower intracellular protein content, and decreased cell growth rate were found. Our data demonstrate that APE1 affects cell growth by directly acting on RNA quality control mechanisms, thus affecting gene expression through posttranscriptional mechanisms.
Figures
FIG. 1.
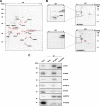
NPM1 physically interacts with the 33 N-terminal amino acids of APE1. (A) 2-DE gel of the APE1-Flag protein complex immunopurified under native conditions from HeLa whole-cell lysate (20 mg from 4 × 10⁷ cells). Results were obtained by silver staining and mass spectrometry identification of the proteins coimmunopurified with APE1-Flag. Highlighted are all of the proteins interacting specifically with APE1-Flag but not with the anti-Flag antibody. Names on the 2-DE map correspond to the proteins listed in Table 1. Vertical and horizontal axes indicate apparent molecular mass (kDa) and pI values, respectively. It has to be noticed that APE1-Flag protein is present in different focalized spots, as the consequence of different posttranslational modifications, including proteolysis of its N-terminal sequence. (B) 2-DE differential proteomic analysis of coimmunoprecipitated material identifies proteins interacting with the N-terminal sequence of APE1. Of particular interest was the identification of NPM1, whose interaction is lost upon removal of the first 33 N-terminal amino acids of APE1. An expanded view of silver-stained gel images of NPM1 shows the loss of interaction with the NΔ33APE1 protein. WT APE1-Flag and NΔ33APE1-Flag are indicated by one and two asterisks, respectively. (C) Western blotting analysis of the coimmunoprecipitated material. Total cell extracts from HeLa cells (Mock) and WT APE1 and NΔ33APE1 clones were coimmunoprecipitated. Coimmunoprecipitated material, after normalization for immunoprecipitated APE1 protein, was separated by 10% SDS-PAGE and analyzed by Western blotting to evaluate the levels of each interacting partner by using specific antibodies (shown as α-APE1, α-NPM1, etc.). In line 1, total cell extract was used as a positive control. Absence of signal in the “Mock” line confirmed the specificity of the interaction. Moreover, loss of NPM1 signal in the NΔ33 clone validates its interaction with the N-terminal region of APE1. Asterisks indicate the positions of Ig heavy (*) and light (**) chains used for the immunoprecipitation (IP) procedure, as demonstrated by separate Western blot analysis performed only with the secondary antibody (data not shown).
FIG. 2.
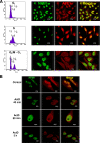
APE1 is localized within nucleoli of HeLa cells and colocalizes and physically interacts with NPM1 and NCL in the granular region of the nucleolus. (A) Endogenous APE1 colocalizes with NPM1 in the granular region of the nucleolus. Confocal microscopy of WT HeLa cells fixed and stained with antibodies against NPM1 (green) and APE1 (red). Overlap of staining (yellow) demonstrated the colocalization of the two proteins. (B) HeLa cells transfected with the Flag-tagged APE1 cDNA-encoding plasmid were fixed and immunostained for NCL (red) and for APE1 (green). Merged images (yellow) show the localization of APE1 within nucleoli and colocalization with NCL. The Flag-tagged APE1 protein was detected with an anti-Flag antibody. (C) The biochemical isolation of nucleoli (37) confirms APE1 localization within these nuclear substructures (see Materials and Methods for details). Western blot (WB) analysis was performed on 10 μg of protein extracts, corresponding to 2 × 10⁷ cell equivalents for the nucleolar fraction and to 2.5 × 10⁵ cell equivalents for the nuclear fraction, respectively. α-Nucleolin, antinucleolin; α-NPM1, anti-NPM1; α-APE1, anti-APE1. (D) The interaction between APE1 and NPM1 is also mediated by RNA. HeLa cells were transfected with Flag-tagged APE1. Coimmunoprecipitation (IP) was performed using anti-Flag (α-Flag) monoclonal antibody-conjugated resin with identical aliquots of cell lysates. Cell lysates were pretreated with 100 U/ml DNase I and 100 μg/ml DNase-free RNase A for 30 min at 30°C before coimmunoprecipitation. Coimmunoprecipitates were separated onto a 12% SDS-PAGE gel and analyzed by Western blotting with the specific anti-NPM1 and anti-Flag antibodies.
FIG. 3.
Interaction between APE1 and NPM1 is associated with cell cycle and requires active rRNA transcription. (A) Dynamic interaction of APE1 and NPM1 during the cell cycle in HeLa cells. HeLa cell cultures were synchronized by double-thymidine treatment. Samples were harvested either immediately (with most of the cells at the G1/S border) or 4 h (most cells are in S phase) and 11 h after the removal of thymidine (with most cells distributed among G2/M and the subsequent G1 phases). (B) NPM1 and APE1 translocation induced by ActD. Shown are results obtained by confocal microscopy of WT HeLa cells fixed and stained with antibodies against NPM1 (green) and APE1 (red). Control cells show a bright nucleolar fluorescence, which indicates that NPM1 and APE1 are localized within nucleoli. After ActD treatment, the NPM1 nucleoplasmic fluorescence increased with time, indicating the NPM1 shifted from the nucleoli to the nucleoplasm. At the same time, the nucleolar staining of APE1 disappeared and the protein appeared to be concentrated in the perinuclear region.
FIG. 4.
Mapping of the APE1-interacting domain in NPM1. Interaction between APE1 and NPM1 requires the homodimerization domain of NPM1. (A) Domain structure of the full-length GST-NPM1 protein and the various deletion mutants used. HeD, heterodimerization domain; HoD, homodimerization domain; NBD, nucleic acid binding domain. (B) GST-pulldown assay on recombinant purified APE1 incubated with equivalent amounts of GST, GST-NPM1, or GST-derivatized deletion mutants. Results were analyzed by SDS-PAGE followed by Western blotting (WB) analysis with the specific anti-APE1 (α-APE1) antibody. α-GST, anti-GST. (C) Colocalization of NPM1 mutants with endogenous APE1 in HeLa cells. Cells were transfected with pcDNA5.1 expression vector containing Flag-tagged WT or mutant NPM1 variants. Ectopic proteins were detected by immunofluorescence with antibodies to the Flag epitope (green). APE1 was detected by the specific monoclonal antibody (red). (D) The NΔ33APE1 deletion mutant does not colocalize with NPM1 within nucleoli. HeLa cells were transfected with pcDNA5.1 expression vector containing the Flag-tagged WT or NΔ33APE1 deletion mutant. Shown are results obtained by confocal microscopy of WT HeLa cells fixed and stained with antibodies against NPM1 (red) and ectopic Flag-tagged APE1 (green). α-Flag, anti-Flag. Overlap of staining (yellow) demonstrates the colocalization of the two proteins.
FIG. 5.
APE1 associates with 47S, 28S, and 18S rRNA, and NPM1 competes with the binding. (A, left) Schematic representation of the 47S gene organization and position of the specific primers used for qRT-PCR analysis to quantitate the amount of each of the 47S, 28S, and 18S rRNA molecules present in the input and in the immunoprecipitated (IP) material of panels B to D. (Right) HeLa cells were transfected with WT APE1-Flag, NΔ33APE1-Flag, NPM1-Flag, or empty Flag vectors. Coimmunoprecipitation was performed, as described above, after normalization for the total amount of total RNA extracted. Aliquots of cell lysates and coimmunoprecipitates were used for Western (WB) blot analysis. α-Flag, anti-Flag. (B, C, and D) RNAs were extracted from immunoprecipitated material (as described for panel A, right), and the amounts of 47S, 28S, and 18S rRNA were evaluated by qRT-PCR analysis in the input and the immunoprecipitated fractions as well. (E) Nuclear localization of APE1 is dependent on the presence of an RNA component. After paraformaldehyde fixation, Triton X-100-permeabilized HeLa cells were treated with RNase A (+RNase) or mock treated (−RNase). Double-labeling immunofluorescence was carried out using anti-APE1 (α-APE1) and anti-AcK18-H3 or anti-NPM1 antibodies. The nuclei, as well as the nucleoli, are not screwed up by RNase treatment as the stainings of the nuclear component, acetylated H3 histone (AcK18-H3), and of the nucleolar component, NPM1, are preserved.
FIG. 6.
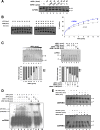
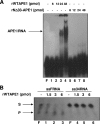
APE1 endonuclease activity on abasic dsDNA and ssRNA is influenced by interaction with NPM1. (A) NPM1 interaction increases APE1 endonuclease activity on double-stranded AP DNA (dsFDNA). Reactions were performed as described in Materials and Methods with homogeneously purified recombinant proteins (rAPE1 and rNPM1) and stopped after 15 min of incubation at 37°C. The conversion of the radiolabeled tetrahydrofuran-containing oligonucleotide substrate (S) to the shorter incised product (P) was evaluated on a denaturing 20% (wt/vol) polyacrylamide gel. In each reaction, 2.5 pmol of dsFDNA was used. A representative image from three independent experiments is shown. F represents the free oligonucleotide probe without addition of enzyme. (B) Endonuclease kinetics of APE1 on dsFDNA is increased by interaction with NPM1. Reactions were performed as described for panel A, and proteins were incubated for the indicated times and separated on a denaturing 20% (wt/vol) polyacrylamide gel at 120 V for 2 h. In each reaction, 2.5 pmol of dsFDNA was used. Representative gels are reported on the left. Average values with standard deviations of three independent experiments are plotted on the right. (C, left) APE1 endonuclease activity on single-stranded abasic RNA (ssFRNA). Reactions were performed with purified recombinant proteins (rAPE1 and rNPM1) and stopped after 15 min of incubation at 37°C. In each reaction, 2.5 pmol of ssFRNA was used. The conversion of the radiolabeled abasic oligonucleotide substrate to the shorter incised product was evaluated on a denaturing 20% (wt/vol) polyacrylamide gel. A representative image from three independent experiments is shown. (Right) NPM1 (and its deletion mutants) inhibits APE1 endonuclease activity on single-stranded abasic ssFRNA. Reactions were performed and analyzed as described for the left panel. In each reaction, 2.5 pmol of ssFRNA was used. A representative image from three independent experiments is shown. (D) Binding of APE1 to ssFRNA is competed by NPM1. Reactions were performed with purified recombinant proteins (rAPE1 and rNPM1). The mixtures were separated on a native (nondenaturing) 8% (wt/vol) polyacrylamide gel at 120 V for 2 h. In each reaction, 2.5 pmol of ssFRNA was used. A representative EMSA gel image from three independent experiments, using the abasic ssFRNA sequence, is shown. An asterisk denotes the location of stable APE1-ssFRNA complexes. Two asterisks denote the location of stable NPM1-ssFRNA complexes. (E) Role of protein-protein interaction with NPM1 on the APE1 endonuclease activity on dsFDNA and ssFRNA. Enzymatic assays on dsFDNA (upper) and ssFRNA (lower) were performed as described for panels B and C. An asterisk on the lower image indicates the presence of higher-order stable complexes between WT APE1 and ssFRNA. A representative image from three independent experiments is shown.
FIG. 7.
APE1 efficiently binds but does not cleave the intact ss34RNA oligonucleotide. (A) Reactions were performed with purified recombinant proteins (rAPE1 and rNΔ33-APE1) and separated as described in the legend to Fig. 6D. ss34RNA is an intact oligonucleotide bearing the same sequence of ssFRNA but devoid of the abasic site. In each reaction, 2.5 pmol of intact ss34RNA was used. A representative EMSA gel image, from three independent experiments, is shown. F represents the free oligonucleotide probe without addition of enzyme. (B) APE1 does not cleave a single-stranded intact RNA (ss34RNA). Reactions were performed and separated as described for Fig. 6C. In each reaction, 2.5 pmol of ss34RNA or ssFRNA was used, as indicated.
FIG. 8.
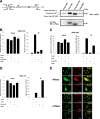
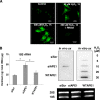
Loss of endogenous APE1 causes increased rRNA oxidation and reduces protein synthesis and cell proliferation. (A) RNA oxidation occurs in H2O2-treated cells. HeLa cells were exposed to the indicated doses of H2O2 for 1 h, followed by a recovery period of 4 h. RNA oxidation was detected by 15A3 immunofluorescence staining. The immunoreactivity was greatly diminished by the RNase treatment. All samples were DNase I treated. (B) Accumulation of oxidatively damaged rRNA in APE1-knocked-down cells. (Left) Quantitative analysis of the amount of rRNA oxidation in 15A3-immunoprecipitated RNAs by qRT-PCR analysis. Control represents HeLa cells stably transfected with a scrambled shRNA sequence (siScr), siAPE1 represents HeLa cells stably transfected with a specific shRNA sequence to inhibit endogenous APE1 expression, WT APE1 represents cells expressing only the ectopic APE1 protein in spite of the endogenous one (see Materials and Methods) (58). Inducible silencing of endogenous APE1 was obtained through doxycycline (1 μg/ml) treatment for 10 days as described in Materials and Methods and reference . HeLa cells (2 × 10⁶) were treated for 1 h with 50 μM H2O2 and released for 4 h. Analysis of 8-OHG-containing RNA is described in Materials and Methods. Levels of oxidation (ox) of 18 S rRNA are higher in APE1-silenced than in APE1-expressing cells, supporting the hypothesis that APE1 plays a role in cleansing of damaged RNA within mammalian cells. Data are means ± standard deviations from three independent experiments. *, P < 0.05. (Right) 15A3 antibody-based dot blot Northwestern detection of 8-OHG was used to analyze the amount of oxidized RNA in the total RNA pool from expressing and nonexpressing HeLa cells, treated as described above. As a loading control, the bands corresponding to 28S and 18S rRNA were visualized by ethidium bromide staining of the gel before transfer. In vitro oxidation of purified RNA with different amounts of H2O2 was used to demonstrate the specificity of the assay used. (C) RNA oxidation impairs APE1-NPM1 interaction. Coimmunoprecipitation (IP) experiments were performed on HeLa cells stably expressing WT APE1-Flag or NΔ33APE1-Flag proteins and treated as described for panel B. Then the presence of NPM1 protein in the immunoprecipitated material was evaluated by Western blotting (WB). α-Flag, anti-Flag; α-NMP1, anti-NMP1. (D, left) After 10 days of doxycycline treatment, HeLa cells (5 × 10⁵) were harvested and analyzed for protein content by a standard colorimetric Bradford assay. HeLa cell clones were as described for panel 8B. (Right) Control (siScr) or nonexpressing (siAPE1) endogenous APE1 HeLa cells were transfected with in vitro-transcribed luciferase mRNA. Normalized luciferase activity as a function of the total protein levels is reported. Experimental details are described in Materials and Methods. The endogenous level of APE1 protein was evaluated by Western blot analysis on the total cell extract. α-APE1, anti-APE1. Data, expressed as the change (fold) with respect to control cultures, are means ± standard deviations from three independent experiments. *, P < 0.05. (E) Silencing (siAPE1) or expression of truncated APE1 (NΔ33APE1) does not affect rRNA synthesis as determined by pulse-chase experiments. HeLa cells as control cells (siScr), nonexpressing cells (siAPE1), or cells expressing only the WT or APE1 deletion mutant (NΔ33APE1) were obtained as described in Materials and Methods and reference and treated with doxycycline (1 μg/ml) for 10 days. Then the cells were pulse-labeled with [3H]uridine for 30 min and chased for the indicated times. An equal amount of RNA was loaded into each lane. The ratios of densitometric signals of 28S to 32S, calculated by a PhosphorImager, are shown. (F) Effect of APE1 silencing on cell proliferation and role of the N-terminal 33-amino-acid sequence. HeLa cell clones were as described for panel E. Cells were treated for different times with doxycycline (1 μg/ml), and then cell growth was measured. (Left) Growth was monitored through direct cell counting by measuring the cell number at various times after doxycycline (Doxy) treatment. Data are means ± standard deviations from three independent experiments. *, P < 0.05. (Right) Cell growth as measured by colony survival assay. Five hundred cells of the control and siRNA clones were seeded in petri dishes and then treated with doxycycline for 10 days. Data, expressed as the percentage of change with respect to control cultures, are means ± standard deviations from three independent experiments. *, P < 0.05. (G) Loss of the 33 N-terminal amino acids within APE1 sequence affects cell death. HeLa cell clones were as described for panel E. Apoptosis was measured through caspase 3/7 activation (left) and annexin V (right) assays. The histograms show the average ± standard deviation of the fluorescence values (relative fluorescence units [RFU]) obtained from three independent experiments. *, P < 0.05.
Similar articles
- Nucleolar accumulation of APE1 depends on charged lysine residues that undergo acetylation upon genotoxic stress and modulate its BER activity in cells.
Lirussi L, Antoniali G, Vascotto C, D'Ambrosio C, Poletto M, Romanello M, Marasco D, Leone M, Quadrifoglio F, Bhakat KK, Scaloni A, Tell G. Lirussi L, et al. Mol Biol Cell. 2012 Oct;23(20):4079-96. doi: 10.1091/mbc.E12-04-0299. Epub 2012 Aug 23. Mol Biol Cell. 2012. PMID: 22918947 Free PMC article. - Nucleophosmin interaction with APE1: Insights into DNA repair regulation.
López DJ, de Blas A, Hurtado M, García-Alija M, Mentxaka J, de la Arada I, Urbaneja MA, Alonso-Mariño M, Bañuelos S. López DJ, et al. DNA Repair (Amst). 2020 Apr;88:102809. doi: 10.1016/j.dnarep.2020.102809. Epub 2020 Jan 30. DNA Repair (Amst). 2020. PMID: 32092641 - Inhibitors of the apurinic/apyrimidinic endonuclease 1 (APE1)/nucleophosmin (NPM1) interaction that display anti-tumor properties.
Poletto M, Malfatti MC, Dorjsuren D, Scognamiglio PL, Marasco D, Vascotto C, Jadhav A, Maloney DJ, Wilson DM 3rd, Simeonov A, Tell G. Poletto M, et al. Mol Carcinog. 2016 May;55(5):688-704. doi: 10.1002/mc.22313. Epub 2015 Apr 11. Mol Carcinog. 2016. PMID: 25865359 Free PMC article. - Intrusion of a DNA repair protein in the RNome world: is this the beginning of a new era?
Tell G, Wilson DM 3rd, Lee CH. Tell G, et al. Mol Cell Biol. 2010 Jan;30(2):366-71. doi: 10.1128/MCB.01174-09. Epub 2009 Nov 9. Mol Cell Biol. 2010. PMID: 19901076 Free PMC article. Review. - Emerging roles of the nucleolus in regulating the DNA damage response: the noncanonical DNA repair enzyme APE1/Ref-1 as a paradigmatical example.
Antoniali G, Lirussi L, Poletto M, Tell G. Antoniali G, et al. Antioxid Redox Signal. 2014 Feb 1;20(4):621-39. doi: 10.1089/ars.2013.5491. Epub 2013 Sep 21. Antioxid Redox Signal. 2014. PMID: 23879289 Free PMC article. Review.
Cited by
- 8-Oxoguanine: from oxidative damage to epigenetic and epitranscriptional modification.
Hahm JY, Park J, Jang ES, Chi SW. Hahm JY, et al. Exp Mol Med. 2022 Oct;54(10):1626-1642. doi: 10.1038/s12276-022-00822-z. Epub 2022 Oct 21. Exp Mol Med. 2022. PMID: 36266447 Free PMC article. Review. - Peroxiredoxin 1 interacts with and blocks the redox factor APE1 from activating interleukin-8 expression.
Nassour H, Wang Z, Saad A, Papaluca A, Brosseau N, Affar el B, Alaoui-Jamali MA, Ramotar D. Nassour H, et al. Sci Rep. 2016 Jul 8;6:29389. doi: 10.1038/srep29389. Sci Rep. 2016. PMID: 27388124 Free PMC article. - Critical lysine residues within the overlooked N-terminal domain of human APE1 regulate its biological functions.
Fantini D, Vascotto C, Marasco D, D'Ambrosio C, Romanello M, Vitagliano L, Pedone C, Poletto M, Cesaratto L, Quadrifoglio F, Scaloni A, Radicella JP, Tell G. Fantini D, et al. Nucleic Acids Res. 2010 Dec;38(22):8239-56. doi: 10.1093/nar/gkq691. Epub 2010 Aug 10. Nucleic Acids Res. 2010. PMID: 20699270 Free PMC article. - Identification of secondary targets of N-containing bisphosphonates in mammalian cells via parallel competition analysis of the barcoded yeast deletion collection.
Bivi N, Romanello M, Harrison R, Clarke I, Hoyle DC, Moro L, Ortolani F, Bonetti A, Quadrifoglio F, Tell G, Delneri D. Bivi N, et al. Genome Biol. 2009;10(9):R93. doi: 10.1186/gb-2009-10-9-r93. Epub 2009 Sep 10. Genome Biol. 2009. PMID: 19744312 Free PMC article. - The Impact of Oxidative Stress on Ribosomes: From Injury to Regulation.
Shcherbik N, Pestov DG. Shcherbik N, et al. Cells. 2019 Nov 2;8(11):1379. doi: 10.3390/cells8111379. Cells. 2019. PMID: 31684095 Free PMC article. Review.
References
- Andersen, J. S., Y. W. Lam, A. K. L. Leung, S. E. Ong, C. E. Lyon, A. I. Lamond, and M. Mann. 2005. Nucleolar proteome dynamics. Nature 43377-83. - PubMed
- Apicelli, A. J., L. B. Maggi, Jr., A. C. Hirbe, A. P. Miceli, M. E. Olanich, C. L. Schulte-Winkeler, A. J. Saporita, M. Kuchenreuther, J. Sanchez, K. Weilbaecher, and J. D. Weber. 2008. A non-tumor suppressor role for basal p19ARF in maintaining nucleolar structure and function. Mol. Cell. Biol. 281068-1080. - PMC - PubMed
- Beernink, P. T., B. W. Segelke, M. Z. Hadi, J. P. Erzberger, D. M. Wilson III, and B. Rupp. 2001. Two divalent metal ions in the active site of a new crystal form of human apurinic/apyrimidinic endonuclease, Ape1: implications for the catalytic mechanism. J. Mol. Biol. 3071023-1034. - PubMed
- Bellacosa, A., and E. G. Moss. 2003. RNA repair: damage control. Curr. Biol. 13R482-R484. - PubMed
Publication types
MeSH terms
Substances
LinkOut - more resources
Full Text Sources
Molecular Biology Databases
Research Materials
Miscellaneous
