The genomic landscape of hypodiploid acute lymphoblastic leukemia - PubMed (original) (raw)
doi: 10.1038/ng.2532. Epub 2013 Jan 20.
Lei Wei, Ernesto Diaz-Flores, Michael Walsh, Jinghui Zhang, Li Ding, Debbie Payne-Turner, Michelle Churchman, Anna Andersson, Shann-Ching Chen, Kelly McCastlain, Jared Becksfort, Jing Ma, Gang Wu, Samir N Patel, Susan L Heatley, Letha A Phillips, Guangchun Song, John Easton, Matthew Parker, Xiang Chen, Michael Rusch, Kristy Boggs, Bhavin Vadodaria, Erin Hedlund, Christina Drenberg, Sharyn Baker, Deqing Pei, Cheng Cheng, Robert Huether, Charles Lu, Robert S Fulton, Lucinda L Fulton, Yashodhan Tabib, David J Dooling, Kerri Ochoa, Mark Minden, Ian D Lewis, L Bik To, Paula Marlton, Andrew W Roberts, Gordana Raca, Wendy Stock, Geoffrey Neale, Hans G Drexler, Ross A Dickins, David W Ellison, Sheila A Shurtleff, Ching-Hon Pui, Raul C Ribeiro, Meenakshi Devidas, Andrew J Carroll, Nyla A Heerema, Brent Wood, Michael J Borowitz, Julie M Gastier-Foster, Susana C Raimondi, Elaine R Mardis, Richard K Wilson, James R Downing, Stephen P Hunger, Mignon L Loh, Charles G Mullighan
Affiliations
- PMID: 23334668
- PMCID: PMC3919793
- DOI: 10.1038/ng.2532
The genomic landscape of hypodiploid acute lymphoblastic leukemia
Linda Holmfeldt et al. Nat Genet. 2013 Mar.
Abstract
The genetic basis of hypodiploid acute lymphoblastic leukemia (ALL), a subtype of ALL characterized by aneuploidy and poor outcome, is unknown. Genomic profiling of 124 hypodiploid ALL cases, including whole-genome and exome sequencing of 40 cases, identified two subtypes that differ in the severity of aneuploidy, transcriptional profiles and submicroscopic genetic alterations. Near-haploid ALL with 24-31 chromosomes harbor alterations targeting receptor tyrosine kinase signaling and Ras signaling (71%) and the lymphoid transcription factor gene IKZF3 (encoding AIOLOS; 13%). In contrast, low-hypodiploid ALL with 32-39 chromosomes are characterized by alterations in TP53 (91.2%) that are commonly present in nontumor cells, IKZF2 (encoding HELIOS; 53%) and RB1 (41%). Both near-haploid and low-hypodiploid leukemic cells show activation of Ras-signaling and phosphoinositide 3-kinase (PI3K)-signaling pathways and are sensitive to PI3K inhibitors, indicating that these drugs should be explored as a new therapeutic strategy for this aggressive form of leukemia.
Figures
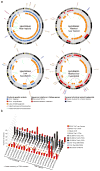
Figure 1. Mutation spectrum of whole genome sequenced hypodiploid ALL
a, Circos plots of representative near haploid (top left), masked near haploid (top right), low hypodiploid (bottom left) and masked low hypodiploid (bottom right) cases. Depicted are structural genetic variants, including DNA copy number alterations, intra- and inter-chromosomal translocations, and sequence alterations. b, Whole genome sequenced cases are depicted from left to right. Colored bars represent number of specific lesions identified in each case as indicated. Masked hypodiploid cases here refer to cases with either a pure doubled hypodiploid clone or cases harboring a doubled clone constituting at least 30%.
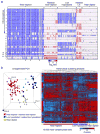
Figure 2. Genome-wide DNA copy number alterations and gene expression profiling of hypodiploid ALL
a, Log2 ratio DNA copy number heatmap showing SNP 6.0 microarray data for the tumor samples from the pediatric hypodiploid ALL cohort. Chromosomes 1–22, X and Y are depicted from top to bottom, and individual samples are shown from left to right. An asterisk (*) indicates tumor samples with less than 70% blasts. LH, low hypodiploid. Blue indicates loss of genetic material and red, gain. Dicentric chromosomes most frequently involved chromosome arms 9p, and either 12p or 20q, and were predominantly observed in near diploid karyotypes. Copy-neutral loss-of-heterozygosity was observed of diploid chromosomes in masked hypodiploid cases (Supplementary Table 10 and Supplementary Fig. 2) consistent with duplication of the hypodiploid clone. b, Left panel: Unsupervised principal component analysis (PCA) of gene expression data from all hypodiploid ALL cases with available high quality RNA (N=94). PCA analysis using 1000 representative probesets selected by k means distinguishes near haploid/masked near haploid, low hypodiploid/masked low hypodiploid and near diploid subgroups. Right panel: Weighted Pair-Group Method with Arithmetic mean hierarchical clustering analysis performed using the 10,000 most variable probesets. Masked hypodiploid cases here refer to cases with a doubled hypodiploid clone constituting at least 30%.
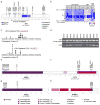
Figure 3. Recurrent alterations of Ras- and RTK signaling in near haploid ALL
a, Protein domain plot of NF1 depicting identified alterations. The recurrent exon 15–35 deletion in NF1 is indicated by a double-headed arrow. b, SNP 6.0 microarray heatmap showing deletions in NF1. Blue indicates DNA loss. Cases with simultaneous NF1 deletion and sequence mutation are indicated by a Y. Masked hypodiploid cases here include all cases harboring a doubled clone constituting at least 30%. mNH, masked near haploid; LH, low hypodiploid; mLH, masked low hypodiploid. c, The genomic breakpoints for the NF1 deletions cluster in two regions. The individual breakpoints are indicated by arrows. The 5′-break (upper panel) is most frequently present in intron 14, and the 3′-break (lower panel) in intron 35. Immediately internal to the 5′- and 3′-breakpoints are putative, partially conserved RAG heptamer recombination signal sequences (RSS) present, and an insertion of a variable number of non-consensus nucleotides in between the two breakpoints were seen for all these cases. d, RT-PCR on cases harboring an NF1 exon 15–35 deletion, using forward and reverse primers complementary to regions in NF1 exons 14 and 36, respectively, rendering a 648 bp fragment. e–h, Protein domain- and alteration plots for other Ras- and RTK signaling related genes recurrently targeted by sequence mutations in hypodiploid ALL, including NRAS, KRAS, FLT3 and PTPN11 (schematic of MAPK1 can be found in Supplementary Fig. 4). Blue line indicates alterations present also in non-tumor cells.
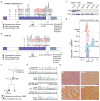
Figure 4. Frequent mutations in TP53 in low hypodiploid ALL
a–b, Protein domain plots of p53 with alterations identified in (a) pediatric hypodiploid ALL and (b) adult ALL. Known LFS alterations are indicated in red. Alterations present in non-tumor cells are indicated by blue lines. Arrows indicate alterations identified in adult low hypodiploid cases in b. c, Pedigree of a family with an inherited TP53 mutation. N, number of siblings. d, Electropherograms showing the inherited TP53 g.13886delG mutation (resulting in p.G302fs) in the proband (child; leukemic bone marrow (top) and normal skin biopsy(middle)) and father (lower panel). Wild-type (Wt) DNA and amino acid (aa) sequences (seq) are depicted at the top of the panel. Δ indicates the deleted nucleotide. e, Histologic examination of tumor from the proband’s father indicated a diagnosis of glioblastoma. Poorly differentiated glial cells are admixed with sparse cells showing an astrocytic phenotype. Many neoplastic cells are GFAP-immunopositive, and all express the mutant TP53 and IDH1 (p.Arg132His) gene products. Scale bar corresponds to 50 microns. HE, hematoxylin and eosin. f, Immunoblot of p53 on primary hypodiploid ALL samples harboring either wild-type TP53 or a TP53 missense mutation as indicated. g, Flow cytometric analysis of spleen samples from xenografted mice and NALM-16 detecting p53 levels. Only cells positive for human CD45 and CD19 were analyzed. Known nonsense and missense alterations in p53 are indicated. BM, bone marrow.
Figure 5. Recurrent deletions of the IKAROS family genes IKZF2 (HELIOS) and IKZF3 (AIOLOS)
a–c, SNP 6.0 microarray heatmaps (left panel) and schematics (right panel) of the alterations identified in the IKAROS family members IKZF1 (IKAROS, a), IKZF2 (HELIOS, b) and IKZF3 (AIOLOS, c). Blue indicates loss of DNA in the heatmaps. One IKZF1 altered case harbors a simultaneous deletion and sequence mutation, indicated by a Y in the left hand panel of a. d, Immunoblot analysis on primary hypodiploid ALL patient samples using the antibodies sc-9866 detecting HELIOS (left), and sc-101982 detecting AIOLOS (right). Deletions in the respective gene are indicated by “+” and lack thereof by “−”.
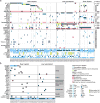
Figure 6. Recurring mutations in hypodiploid ALL
a, Data are shown for the entire hypodiploid ALL cohort split up in the near haploid (including masked near haploid cases), low hypodiploid (and masked low hypodiploid) and near diploid subgroups. b, Data matrix as above, but only including genes involved in histone modification identified in samples sequenced by either whole genome- or exome sequencing. SV, structural variation; Indel, insertion/deletion mutation; SNV, single nucleotide variation; Age, Age at diagnosis; Ind. failure, Induction treatment failure; NGS, next-generation sequencing; WGS, whole genome sequencing; WES, whole exome sequencing; GEP, gene expression profiling.
Figure 7. Activation of Ras signaling
a–b, Flow cytometric analyses of spleen samples from xenografted mice and the near haploid cell line NALM-16 detecting pERK (a) and pS6 (b)levels. Only cells positive for human CD45 were analyzed. *Cases with a known mutation in the Ras signaling pathway. IKZF2 and IKZF3 deletions are indicated by “+” and lack thereof by “−”. c, Immunoblot showing levels of Ras-GTP as assessed by a Raf-Ras binding domain bead pulldown assay in low hypodiploid and near haploid ALL xenograft samples and NALM-16. Presence of Ras pathway (pwy) and IKZF2 alterations are indicated by “+”. d–e, Detection of pERK (d) and pS6 (e) in non-stimulated NALM-16 with and without treatment with the PI3K inhibitor GDC-0941 (0.7uM) and the PI3K/mTOR inhibitor BEZ235 (0.3uM) for 1 hour. The drug concentrations correspond to the respective IC50 value gained from proliferation assays on NALM-16 (Supplementary Table 23). f, ex vivo proliferation assay on near haploid (upper, SJHYPO037-X2) and low hypodiploid (lower, SJHYPO077-X1) xenograft cells harboring the indicated mutations (Supplementary Table 12). BM, bone marrow; NH, near haploid; LH, low hypodiploid.
Similar articles
- TP53 Mutations in Hypodiploid Acute Lymphoblastic Leukemia.
Comeaux EQ, Mullighan CG. Comeaux EQ, et al. Cold Spring Harb Perspect Med. 2017 Mar 1;7(3):a026286. doi: 10.1101/cshperspect.a026286. Cold Spring Harb Perspect Med. 2017. PMID: 28003275 Free PMC article. Review. - Genetic and epigenetic characterization of hypodiploid acute lymphoblastic leukemia.
Safavi S, Olsson L, Biloglav A, Veerla S, Blendberg M, Tayebwa J, Behrendtz M, Castor A, Hansson M, Johansson B, Paulsson K. Safavi S, et al. Oncotarget. 2015 Dec 15;6(40):42793-802. doi: 10.18632/oncotarget.6000. Oncotarget. 2015. PMID: 26544893 Free PMC article. - Adult Low-Hypodiploid Acute B-Lymphoblastic Leukemia With IKZF3 Deletion and TP53 Mutation: Comparison With Pediatric Patients.
Fang M, Becker PS, Linenberger M, Eaton KD, Appelbaum FR, Dreyer Z, Airewele G, Redell M, Lopez-Terrada D, Patel A, Rabin KR, Lu X. Fang M, et al. Am J Clin Pathol. 2015 Aug;144(2):263-70. doi: 10.1309/AJCPW83OXPYKPEEN. Am J Clin Pathol. 2015. PMID: 26185311 - Loss of chromosomes is the primary event in near-haploid and low-hypodiploid acute lymphoblastic leukemia.
Safavi S, Forestier E, Golovleva I, Barbany G, Nord KH, Moorman AV, Harrison CJ, Johansson B, Paulsson K. Safavi S, et al. Leukemia. 2013 Jan;27(1):248-50. doi: 10.1038/leu.2012.227. Epub 2012 Aug 14. Leukemia. 2013. PMID: 22889820 No abstract available. - Near-haploid and low-hypodiploid acute lymphoblastic leukemia: two distinct subtypes with consistently poor prognosis.
Safavi S, Paulsson K. Safavi S, et al. Blood. 2017 Jan 26;129(4):420-423. doi: 10.1182/blood-2016-10-743765. Epub 2016 Nov 30. Blood. 2017. PMID: 27903530 Review.
Cited by
- Hyperdiploidy: the longest known, most prevalent, and most enigmatic form of acute lymphoblastic leukemia in children.
Haas OA, Borkhardt A. Haas OA, et al. Leukemia. 2022 Dec;36(12):2769-2783. doi: 10.1038/s41375-022-01720-z. Epub 2022 Oct 20. Leukemia. 2022. PMID: 36266323 Free PMC article. Review. - Targeting MDM2-mediated suppression of p53 with idasanutlin: a promising therapeutic approach for acute lymphoblastic leukemia.
Gungordu S, Aptullahoglu E. Gungordu S, et al. Invest New Drugs. 2024 Dec;42(6):603-611. doi: 10.1007/s10637-024-01473-9. Epub 2024 Sep 21. Invest New Drugs. 2024. PMID: 39305365 - Comprehensive genomic analysis reveals FLT3 activation and a therapeutic strategy for a patient with relapsed adult B-lymphoblastic leukemia.
Griffith M, Griffith OL, Krysiak K, Skidmore ZL, Christopher MJ, Klco JM, Ramu A, Lamprecht TL, Wagner AH, Campbell KM, Lesurf R, Hundal J, Zhang J, Spies NC, Ainscough BJ, Larson DE, Heath SE, Fronick C, O'Laughlin S, Fulton RS, Magrini V, McGrath S, Smith SM, Miller CA, Maher CA, Payton JE, Walker JR, Eldred JM, Walter MJ, Link DC, Graubert TA, Westervelt P, Kulkarni S, DiPersio JF, Mardis ER, Wilson RK, Ley TJ. Griffith M, et al. Exp Hematol. 2016 Jul;44(7):603-13. doi: 10.1016/j.exphem.2016.04.011. Epub 2016 May 13. Exp Hematol. 2016. PMID: 27181063 Free PMC article. - Single nucleotide polymorphism array-based signature of low hypodiploidy in acute lymphoblastic leukemia.
Creasey T, Enshaei A, Nebral K, Schwab C, Watts K, Cuthbert G, Vora A, Moppett J, Harrison CJ, Fielding AK, Haas OA, Moorman AV. Creasey T, et al. Genes Chromosomes Cancer. 2021 Sep;60(9):604-615. doi: 10.1002/gcc.22956. Epub 2021 May 17. Genes Chromosomes Cancer. 2021. PMID: 33938069 Free PMC article. - Inherited genetic variation in childhood acute lymphoblastic leukemia.
Moriyama T, Relling MV, Yang JJ. Moriyama T, et al. Blood. 2015 Jun 25;125(26):3988-95. doi: 10.1182/blood-2014-12-580001. Epub 2015 May 21. Blood. 2015. PMID: 25999454 Free PMC article. Review.
References
- Kuiper RP, et al. High-resolution genomic profiling of childhood ALL reveals novel recurrent genetic lesions affecting pathways involved in lymphocyte differentiation and cell cycle progression. Leukemia. 2007;21:1258–66. - PubMed
- Mullighan CG, et al. Genome-wide analysis of genetic alterations in acute lymphoblastic leukaemia. Nature. 2007;446:758–64. - PubMed
- Kuiper RP, et al. IKZF1 deletions predict relapse in uniformly treated pediatric precursor B-ALL. Leukemia. 2010;24:1258–64. - PubMed
Publication types
MeSH terms
Substances
Grants and funding
- U24 CA196173/CA/NCI NIH HHS/United States
- U01 GM92666/GM/NIGMS NIH HHS/United States
- CA98543/CA/NCI NIH HHS/United States
- 5R25CA023944/CA/NCI NIH HHS/United States
- R25 CA023944/CA/NCI NIH HHS/United States
- CA114766/CA/NCI NIH HHS/United States
- CA21765/CA/NCI NIH HHS/United States
- RC4 CA156329/CA/NCI NIH HHS/United States
- RC4CA156329/CA/NCI NIH HHS/United States
- P30 CA021765/CA/NCI NIH HHS/United States
- U10 CA098543/CA/NCI NIH HHS/United States
- CA98413/CA/NCI NIH HHS/United States
- U01 GM092666/GM/NIGMS NIH HHS/United States
- U10 CA098413/CA/NCI NIH HHS/United States
- U24 CA114766/CA/NCI NIH HHS/United States
LinkOut - more resources
Full Text Sources
Other Literature Sources
Molecular Biology Databases
Research Materials
Miscellaneous
