Characterization of cell lines derived from breast cancers and normal mammary tissues for the study of the intrinsic molecular subtypes - PubMed (original) (raw)
Characterization of cell lines derived from breast cancers and normal mammary tissues for the study of the intrinsic molecular subtypes
Aleix Prat et al. Breast Cancer Res Treat. 2013 Nov.
Abstract
Five molecular subtypes (luminal A, luminal B, HER2-enriched, basal-like, and claudin-low) with clinical implications exist in breast cancer. Here, we evaluated the molecular and phenotypic relationships of (1) a large in vitro panel of human breast cancer cell lines (BCCLs), human mammary fibroblasts (HMFs), and human mammary epithelial cells (HMECs); (2) in vivo breast tumors; (3) normal breast cell subpopulations; (4) human embryonic stem cells (hESCs); and (5) bone marrow-derived mesenchymal stem cells (hMSC). First, by integrating genomic data of 337 breast tumor samples with 93 cell lines we were able to identify all the intrinsic tumor subtypes in the cell lines, except for luminal A. Secondly, we observed that the cell lines recapitulate the differentiation hierarchy detected in the normal mammary gland, with claudin-low BCCLs and HMFs cells showing a stromal phenotype, HMECs showing a mammary stem cell/bipotent progenitor phenotype, basal-like cells showing a luminal progenitor phenotype, and luminal B cell lines showing a mature luminal phenotype. Thirdly, we identified basal-like and highly migratory claudin-low subpopulations of cells within a subset of triple-negative BCCLs (SUM149PT, HCC1143, and HCC38). Interestingly, both subpopulations within SUM149PT were enriched for tumor-initiating cells, but the basal-like subpopulation grew tumors faster than the claudin-low subpopulation. Finally, claudin-low BCCLs resembled the phenotype of hMSCs, whereas hESCs cells showed an epithelial phenotype without basal or luminal differentiation. The results presented here help to improve our understanding of the wide range of breast cancer cell line models through the appropriate pairing of cell lines with relevant in vivo tumor and normal cell counterparts.
Figures
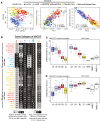
Fig. 1
Combined gene expression data of cell lines, breast tumors and normal breast samples. a Principal component (PC) 1 and 2 loading plots and their correlation with proliferation and differentiation scores, respectively. Samples included here were the entire UNC337 data set and all the UNC breast cancer cell lines (UNC105). b Euclidean distance of selected UNC cell lines to the UNC337 tumor intrinsic subtypes, including the claudin-low tumor type. c Differentiation and d proliferation scores of the tumor (left) and cell lines (right) grouped by their molecular subtype. Cells derived from normal breast tissue are shown in the following categories: HMF, HMECs and immortalized HMECs (I-HMECs). Subtype calls: luminal A (LA) dark blue; luminal B (LB) light blue; HER2-enriched (H2) pink; basal-like (BL) red; claudin-low (CL) yellowish; normal breast-like (NBL) green; cell line gray. Replicate arrays done in the same cell line have been omitted, prioritizing first the UNC samples followed by the Neve et al. samples when appropriate
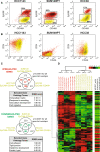
Fig. 2
Characterization of mesenchymal and epithelial subpopulations of the normal breast. a Diagram summarizing the processing and steps taken for FACS of normal breast tissue. b, c Distribution of the lineage-negative cell subpopulations in one representative reduction mammoplasty sample using EpCAM/CD49f and CD24/CD44 surface markers. d Differentiation score of the four-sorted cell subpopulations of at least three reduction mammoplasties samples. p values shown here have been calculated by comparing gene expression means across all subpopulations. e Supervised hierarchical clustering of the sorted subpopulations based on the expression of a panel of markers of basal and luminal differentiation, EMT and CSCs markers. Each colored square of the heatmap represents the relative transcript abundance (in log 2 space) for each cell fraction with highest expression being red, average expression being black, and lowest expression being green. Keratins 5 [KRT5], 14 [KRT14] and 17 [KRT17], 18 [KRT18] and 19 [KRT19]); ER (ESR1); progesterone receptor (PGR); HER2 (ERBB2); vimentin [VIM]; snail-1 [SNAI1]; snail-2 [SNAI2]; Zinc finger E-box homeobox 1 and 2 [ZEB1 and ZEB2]; E-cadherin [CDH1]; Claudins −3 [CLDN3], −4 [CLDN4] and −7 [CLDN7]); prominin 1 [CD133]; epithelial cell-adhesion molecule [EpCAM]; mucin 1 [MUC1]; integrin alpha 6 [CD49f]; integrin beta 1 [CD29]; membrane metallo-endopeptidase [CD10]; aldehyde dehydrogenase family 1, subfamily A1 [ALDH1A1]. f, g Immunofluorescent staining of the four breast cell subpopulations and normal breast ducts using antibodies against vimentin (green), keratin 5 (red) and keratin 8 (green)
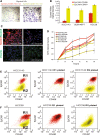
Fig. 3
Cell lines recapitulate the differentiation hierarchy of the normal breast. a Enrichment scores of Lim’s stromal, MaSC/BiP, pL, and mL gene signatures in BCCLs grouped by their molecular subtypes, HMFs, HMECs, and our normal breast FAC-sorted subpopulations. *p value < 0.05, **p value < 0.001. Replicate arrays done in the same cell line have been omitted, prioritizing first the UNC samples followed by the Neve et al. samples when appropriate. Signature enrichment scores for each Lim et al. fraction (stromal, MaSC/BiP, pL and mL) has been obtained by calculating the distance of each cell line to two Lim et al. centroids: “others” versus “each Lim et al. fraction”. In the plot, the ratio of the “others” distance versus “each Lim et al. fraction” distance is shown. b EpCAM/CD49f and CD24/CD44 FACS of claudin-low (Hs578T), HMEC (HMECBL), basal-like cell line (HCC1187) and luminal B (HCC1428) cell lines. c IF staining of Hs578T, HMECBL, HCC1187 and HCC1428 cell lines using antibodies against vimentin (green), keratin 5 (red) and keratin 8 (green). The complete FACS and IF staining data of all cell lines evaluated can be obtained in Supplemental material
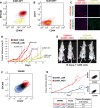
Fig. 4
Genomic analyses of distinct cell subpopulations within basal-like and claudin-low cell lines. a Expression of EpCAM/CD49f in HCC1143 (basal-like), SUM149PT (basal-like) and HCC38 (claudin-low) cell lines. The gates shown in each cell line (gray squares) represent the different sorted subpopulations that were further evaluated. b Expression of CD24/CD44 in the three cell lines. The colors represent the distribution of the sorted fractions in (a). c Overlap of genes differentially expressed between EpCAM−/low/CD49f+ and EpCAM+/CD49f+ cells across HCC1143, SUM149PT and HCC38. p values denote the probability of the overlap being by chance. Below each Venn diagram, the up- and down-regulated gene ontology (GO) terms are shown. Each list included the genes that overlapped between at least two cell fractions (red or green genes). d Supervised hierarchical clustering of the sorted subpopulations based on the expression of the differentially expressed genes between EpCAM−/CD49f+ and EpCAM+/CD49f+ cells across HCC1143, SUM149PT and HCC38. On the right, relative expression data in hESC cells that have acquired a mesodermal state. All the gene lists and the clustering can be obtained in Supplemental material
Fig. 5
Functional analyses of distinct cell subpopulations within basal-like and claudin-low cell lines. a, b Trans-well migration capability of the EpCAM−/low/CD49f+ and EpCAM+/CD49f+ cell fractions within each cell line. Microscopic image (×20) of migrated cells (underside of the membrane) within HCC1143-sorted fractions stained with 0.2 % crystal violet. Migration was quantified by measuring the optical density of the eluted crystal violet solubilized with 100 μl of methanol. c Dual keratin 5/keratin 8 and vimentin IF imaging of HCC1143-sorted fractions. d Proliferation status of the different sorted fractions during cell culture after FACS. Proliferation was estimated by recording the absorbance at 490 nm of the MTS-PES compound in each time point. e, f In vitro differentiation of EpCAM−/low/CD49f+ HCC1143 and HCC38 cells. The two-sorted cell subpopulations from each cell line were grown in vitro under the same conditions as before FACS. After 14–18 days in culture, expression of CD49 and EpCAM was reanalyzed in both subpopulations using FACS
Fig. 6
TIC experiments in SUM149PT cell line and WashU-WHIM2. a FAC-sorted plot based on EpCAM and CD49f expression. Red color: basal-like; yellowish color: Claudin-low. b FAC-sorted plot based on CD24 and CD44 expression. Red and yellowish colors identify the population of cells identified in the EpCAM/CD49f plot. c Dual keratin 5/keratin 8 and keratin 5/vimentin IF imaging of SUM149PT-sorted fractions. d TIC experiment for both sorted fractions. e Luciferase imaging of tumors in nude mice (n = 2 for each fraction) 19 days after injecting 1,000 cells. f Expression of EpCAM/CD49f and identification of two different cell fractions within the WashU WHIM2 model: CD49Flow and CD49Fhigh. g Tumor-initiating ability of the two-sorted fractions in (f), and expression of EpCAM/CD49f of the resulting tumors
Fig. 7
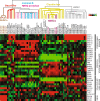
Characterization of hMSC and hESC. Unsupervised hierarchical clustering of cell lines using the most variable genes (n = 17,824). Expression of selected genes is shown in the heatmap. Each colored square of the heatmap represents the relative transcript abundance (in log 2 space) for each cell fraction with highest expression being red, average expression being black, and lowest expression being green
Fig. 8
Summary of the characterization of cell lines derived from breast cancers and normal mammary tissues for the study of the intrinsic subtypes. a IF staining for vimentin, keratin 5 and keratin 8 proteins. b Tumor molecular subtypes that each cell line best resemble. c Cell-type of each cell line. d Approximate localization of Lim et al.’s gene expression profiles of each normal breast subpopulations. e Approximate genomic expression landscape of human embryonic and mesenchymal stem cell profiles. f Approximate genomic expression landscape of the mesenchymal and epithelial profiles
Similar articles
- Phenotypic and molecular characterization of the claudin-low intrinsic subtype of breast cancer.
Prat A, Parker JS, Karginova O, Fan C, Livasy C, Herschkowitz JI, He X, Perou CM. Prat A, et al. Breast Cancer Res. 2010;12(5):R68. doi: 10.1186/bcr2635. Epub 2010 Sep 2. Breast Cancer Res. 2010. PMID: 20813035 Free PMC article. - Epithelial and mesenchymal subpopulations within normal basal breast cell lines exhibit distinct stem cell/progenitor properties.
Sarrio D, Franklin CK, Mackay A, Reis-Filho JS, Isacke CM. Sarrio D, et al. Stem Cells. 2012 Feb;30(2):292-303. doi: 10.1002/stem.791. Stem Cells. 2012. PMID: 22102611 - Tumor initiating but differentiated luminal-like breast cancer cells are highly invasive in the absence of basal-like activity.
Kim J, Villadsen R, Sørlie T, Fogh L, Grønlund SZ, Fridriksdottir AJ, Kuhn I, Rank F, Wielenga VT, Solvang H, Edwards PA, Børresen-Dale AL, Rønnov-Jessen L, Bissell MJ, Petersen OW. Kim J, et al. Proc Natl Acad Sci U S A. 2012 Apr 17;109(16):6124-9. doi: 10.1073/pnas.1203203109. Epub 2012 Mar 27. Proc Natl Acad Sci U S A. 2012. PMID: 22454501 Free PMC article. - Delineating the epithelial hierarchy in the mouse mammary gland.
Asselin-Labat ML, Vaillant F, Shackleton M, Bouras T, Lindeman GJ, Visvader JE. Asselin-Labat ML, et al. Cold Spring Harb Symp Quant Biol. 2008;73:469-78. doi: 10.1101/sqb.2008.73.020. Epub 2008 Nov 6. Cold Spring Harb Symp Quant Biol. 2008. PMID: 19022771 Review. - Mammary development and breast cancer: the role of stem cells.
Ercan C, van Diest PJ, Vooijs M. Ercan C, et al. Curr Mol Med. 2011 Jun;11(4):270-85. doi: 10.2174/156652411795678007. Curr Mol Med. 2011. PMID: 21506923 Free PMC article. Review.
Cited by
- NF-YAl drives EMT in Claudinlow tumours.
Londero M, Gallo A, Cattaneo C, Ghilardi A, Ronzio M, Del Giacco L, Mantovani R, Dolfini D. Londero M, et al. Cell Death Dis. 2023 Jan 28;14(1):65. doi: 10.1038/s41419-023-05591-9. Cell Death Dis. 2023. PMID: 36707502 Free PMC article. - Differential β₂-adrenergic receptor expression defines the phenotype of non-tumorigenic and malignant human breast cell lines.
Gargiulo L, Copsel S, Rivero EM, Galés C, Sénard JM, Lüthy IA, Davio C, Bruzzone A. Gargiulo L, et al. Oncotarget. 2014 Oct 30;5(20):10058-69. doi: 10.18632/oncotarget.2460. Oncotarget. 2014. PMID: 25375203 Free PMC article. - Genomic signatures for paclitaxel and gemcitabine resistance in breast cancer derived by machine learning.
Dorman SN, Baranova K, Knoll JH, Urquhart BL, Mariani G, Carcangiu ML, Rogan PK. Dorman SN, et al. Mol Oncol. 2016 Jan;10(1):85-100. doi: 10.1016/j.molonc.2015.07.006. Epub 2015 Aug 22. Mol Oncol. 2016. PMID: 26372358 Free PMC article. - Translating transcriptomic findings from cancer model systems to humans through joint dimension reduction.
Price BA, Marron JS, Mose LE, Perou CM, Parker JS. Price BA, et al. Commun Biol. 2023 Feb 16;6(1):179. doi: 10.1038/s42003-023-04529-3. Commun Biol. 2023. PMID: 36797360 Free PMC article. - Genomic alterations underlie a pan-cancer metabolic shift associated with tumour hypoxia.
Haider S, McIntyre A, van Stiphout RG, Winchester LM, Wigfield S, Harris AL, Buffa FM. Haider S, et al. Genome Biol. 2016 Jun 29;17(1):140. doi: 10.1186/s13059-016-0999-8. Genome Biol. 2016. PMID: 27358048 Free PMC article.
References
Publication types
MeSH terms
Substances
Grants and funding
- P30 ES010126/ES/NIEHS NIH HHS/United States
- P50-CA58223-09A1/CA/NCI NIH HHS/United States
- R01 CA138255/CA/NCI NIH HHS/United States
- R01 CA148761/CA/NCI NIH HHS/United States
- P50 CA058223/CA/NCI NIH HHS/United States
- R01-CA-138255/CA/NCI NIH HHS/United States
- R01-CA148761/CA/NCI NIH HHS/United States
- N01 CN043308/CA/NCI NIH HHS/United States
LinkOut - more resources
Full Text Sources
Other Literature Sources
Medical
Molecular Biology Databases
Research Materials
Miscellaneous
