Post-Golgi anterograde transport requires GARP-dependent endosome-to-TGN retrograde transport - PubMed (original) (raw)
Post-Golgi anterograde transport requires GARP-dependent endosome-to-TGN retrograde transport
Tetsuya Hirata et al. Mol Biol Cell. 2015.
Abstract
The importance of endosome-to-trans-Golgi network (TGN) retrograde transport in the anterograde transport of proteins is unclear. In this study, genome-wide screening of the factors necessary for efficient anterograde protein transport in human haploid cells identified subunits of the Golgi-associated retrograde protein (GARP) complex, a tethering factor involved in endosome-to-TGN transport. Knockout (KO) of each of the four GARP subunits, VPS51-VPS54, in HEK293 cells caused severely defective anterograde transport of both glycosylphosphatidylinositol (GPI)-anchored and transmembrane proteins from the TGN. Overexpression of VAMP4, v-SNARE, in VPS54-KO cells partially restored not only endosome-to-TGN retrograde transport, but also anterograde transport of both GPI-anchored and transmembrane proteins. Further screening for genes whose overexpression normalized the VPS54-KO phenotype identified TMEM87A, encoding an uncharacterized Golgi-resident membrane protein. Overexpression of TMEM87A or its close homologue TMEM87B in VPS54-KO cells partially restored endosome-to-TGN retrograde transport and anterograde transport. Therefore GARP- and VAMP4-dependent endosome-to-TGN retrograde transport is required for recycling of molecules critical for efficient post-Golgi anterograde transport of cell-surface integral membrane proteins. In addition, TMEM87A and TMEM87B are involved in endosome-to-TGN retrograde transport.
© 2015 Hirata, Fujita, et al. This article is distributed by The American Society for Cell Biology under license from the author(s). Two months after publication it is available to the public under an Attribution–Noncommercial–Share Alike 3.0 Unported Creative Commons License (http://creativecommons.org/licenses/by-nc-sa/3.0).
Figures
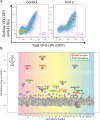
FIGURE 1:
Haploid genetic screening of the factors required for the anterograde transport of GPI-APs. (A) Transport assay of VFG-GPI in HAP1FF9 wild-type cells (left) and the enriched cell population after sorting twice for delayed transport (right). (B) The significance of the enrichment of gene-trap insertions in an enriched population with delayed transport compared with the nonselected population was calculated and plotted as a bubble plot. The horizontal line shows the chromosomal position of the genes, and the vertical line shows the significance of enrichment of each gene (p value). The size of the bubble shows the number of inactivated insertion sites. Genes significantly enriched in sort 2 (p < 0.01) are colored. Red bubbles, genes encoding the GARP complex subunit; green bubbles, genes involved in GPI-AP remodeling. The bubble of VPS53 indicated by an arrow was close to the significance limit.
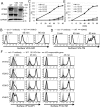
FIGURE 2:
Knockout (KO) of GARP complex subunits severely impairs the anterograde transport of proteins. (A) Western blotting of VPS52 and VPS53 in HEK293FF6 wild-type (WT), VPS52-KO (V52KO), and VPS53-KO (V53KO) cells, showing nearly complete reduction by specific knockout. GAPDH was used as a loading control. (B) Transport assay of VFG-GPI in wild-type (WT) and GARP-KO cells. Surface expression of VFG-GPI at the indicated time in WT and VPS54-KO (V54KO) cells is shown as an example. (C) Relative transport of VFG-GPI in GARP-KO cells. The geometric mean fluorescence of surface VFG-GPI, as shown in the histograms in B, was quantified for each time point, plotting the geometric mean of WT cells at 90 min as 100% relative transport. (D) Transport assay of FVG-TM in WT and GARP-KO cells. WT and GARP-KO cells were transiently transfected with FVG-TM. Surface expression of FVG-TM at the indicated time in WT and V54KO cells is shown as an example. (E) Relative transport of FVG-TM. The geometric mean fluorescence of surface FVG-TM, as shown in the histograms in D, was quantified similarly to C. (F) Rescue of transport delay in GARP-KO cells by the expression of the responsible genes. GARP-KO cells were transiently transfected with a VPS51, VPS52, VPS53, or VPS54 expression plasmid, after which the transport of VFG-GPI (left) was analyzed. For FVG-TM transport, cells were cotransfected with FVG-TM and indicated genes. The quantitative data are the means of three independent experiments. Error bars represent the SDs (n = 3).
FIGURE 3:
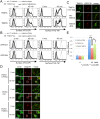
Post-Golgi anterograde transport is defective in V54KO cells. (A) VFG-GPI transport from the ER in V54KO or restored cells. Cells were cultured in medium containing 1 μg/ml Dox at 40°C for 24 h. VFG-GPI transport was chased at 32°C for the indicated time in medium containing 100 μg/ml CHX. Images at 0, 30, and 90 min. Green, VFG-GPI; red, RFP-GPP34 as a TGN marker. Scale bars, 10 μm. (B) The TGN localization of VFG-GPI was quantified based on A. The ratio of the VFG-GPI intensity in the TGN to the total fluorescence intensity was determined. Data are the means of 10 independent images. Error bars represent the SEM (n = 10). Similar results were obtained from two independent experiments. (C) Post-Golgi transport of VFG-GPI in V54KO or restored cells. Cells cultured in medium containing 1 μg/ml Dox for 24 h at 40°C were precultured in medium containing 100 μg/ml CHX for 3 h at 19°C, after which VFG-GPI transport was chased at 32°C for 0 or 45 min. To detect surface VFG-GPI, cells were stained with anti-FLAG M2 antibody under nonpermeabilized conditions. Green, total expression of VFG-GPI; red, RFP-GPP34; cyan, surface expression of VFG-GPI. Scale bars, 10 μm. Similar results were obtained from two independent experiments. (D) The ratio of surface arrived VFG-GPI was quantified based on C. Data are the means of five independent images. Error bars represent the SEM (n = 5). Similar results were obtained from two independent experiments.
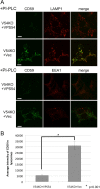
FIGURE 4:
Missorting of CD59 to lysosomes in V54KO cells. (A) Intracellular localization of endogenous GPI-AP, CD59. Cells were treated with PI-PLC at 37°C for 1.5 h, after which they were fixed and double-stained with anti-CD59 and anti-LAMP1 or anti-EEA1. Green, CD59; red, LAMP1 (top) and EEA1 (bottom) as lysosome and early-endosome markers, respectively. Scale bars, 10 μm. (B) CD59 localized in lysosomes was quantified from the images of A. Data are the means of 10 independent images. Error bars represent the SEM (n = 10). Similar results were obtained in two independent experiments.
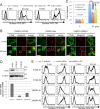
FIGURE 5:
VAMP4-dependent retrograde transport is required for recycling of proteins critical for the post-Golgi anterograde transport. (A) Transport assay of VFG-GPI (left) and FVG-TM (right) in V54KO cells transiently transfected with the indicated genes. (B) Retrograde transport assay using CTxB. Cells incubated with Alexa Fluor 488–conjugated CTxB for 30 min on ice, followed by a chase at 37°C for 0 or 60 min, were analyzed by confocal microscopy after staining with anti-golgin97 antibody. Green, CTxB; red, golgin97 as a TGN marker. Scale bars, 10 μm. Similar results were obtained in two independent experiments. (C) CTxB in the TGN was quantified. Data are the means of 10 independent images. Error bars represent the SEM (n = 10). Similar results were obtained in two independent experiments. (D) Estimation of knockdown efficiency. HEK293FF6 was transfected with indicated siRNAs, and the expression of STX6 or VAMP4 was analyzed by Western blotting or qRT-PCR, respectively. For Western blotting, α-tubulin was used as a loading control. For qRT-PCR, HPRT1 was used as a control. Here #1 and #2 are siRNAs targeting different sites. (E) Effect of STX6 or VAMP4 knockdown on anterograde transport. Transport assay of VFG-GPI (left) or FVG-TM (right) in HEK293FF6 or HEK293TM10 cells, respectively, transfected with indicated siRNAs.
FIGURE 6:
Potential role for TMEM87A and TMEM87B in endosome-to-TGN retrograde transport. (A) Overexpression of TMEM87A (TM87A) and TMEM87B (TM87B) partly rescues the delayed transport of proteins in V54KO cells. Transport assay of VFG-GPI (left) or FVG-TM (right) in V54KO cells transiently transfected with the indicated genes. (B) Overexpression of GPR107 and GPR108 does not rescue delayed transport in V54KO cells. Transport assay of VFG-GPI (left) or FVG-TM (right) in V54KO cells transfected with the indicated genes. (C) Subcellular localization of TMEM87A. Wild-type cells were transfected with nontagged or HA-tagged TMEM87A and double-stained with anti-TMEM87A (nontagged version) or anti-HA7 and anti-GPP130, a Golgi marker. Green, TMEM87A; red, GPP130 as a Golgi marker. Scale bars, 10 μm. (D) CTxB retrograde transport at 0 and 60 min. Green, CTxB; red, golgin97. Scale bars, 10 μm. Similar results were obtained in two independent experiments. (E) Quantitative data were obtained as described in the legend to Figure 5C. Data are the means of 10 independent images. Error bars represent SEM (n = 10). Similar results were obtained in two independent experiments.
Similar articles
- Dual roles of the mammalian GARP complex in tethering and SNARE complex assembly at the trans-golgi network.
Pérez-Victoria FJ, Bonifacino JS. Pérez-Victoria FJ, et al. Mol Cell Biol. 2009 Oct;29(19):5251-63. doi: 10.1128/MCB.00495-09. Epub 2009 Jul 20. Mol Cell Biol. 2009. PMID: 19620288 Free PMC article. - The golgin GCC88 is required for efficient retrograde transport of cargo from the early endosomes to the trans-Golgi network.
Lieu ZZ, Derby MC, Teasdale RD, Hart C, Gunn P, Gleeson PA. Lieu ZZ, et al. Mol Biol Cell. 2007 Dec;18(12):4979-91. doi: 10.1091/mbc.e07-06-0622. Epub 2007 Oct 3. Mol Biol Cell. 2007. PMID: 17914056 Free PMC article. - Yeast dynamin associates with the GARP tethering complex for endosome-to-Golgi traffic.
Saimani U, Smothers J, McDermott H, Makaraci P, Kim K. Saimani U, et al. Eur J Cell Biol. 2017 Sep;96(6):612-621. doi: 10.1016/j.ejcb.2017.04.004. Epub 2017 May 8. Eur J Cell Biol. 2017. PMID: 28521960 - Transport according to GARP: receiving retrograde cargo at the trans-Golgi network.
Bonifacino JS, Hierro A. Bonifacino JS, et al. Trends Cell Biol. 2011 Mar;21(3):159-67. doi: 10.1016/j.tcb.2010.11.003. Epub 2010 Dec 21. Trends Cell Biol. 2011. PMID: 21183348 Free PMC article. Review. - Endosome-to-Golgi transport pathways in physiological processes.
Lieu ZZ, Gleeson PA. Lieu ZZ, et al. Histol Histopathol. 2011 Mar;26(3):395-408. doi: 10.14670/HH-26.395. Histol Histopathol. 2011. PMID: 21210352 Review.
Cited by
- Shedding of N-acetylglucosaminyltransferase-V is regulated by maturity of cellular N-glycan.
Hirata T, Takata M, Tokoro Y, Nakano M, Kizuka Y. Hirata T, et al. Commun Biol. 2022 Aug 1;5(1):743. doi: 10.1038/s42003-022-03697-y. Commun Biol. 2022. PMID: 35915223 Free PMC article. - Vps54 Regulates Lifespan and Locomotor Behavior in Adult Drosophila melanogaster.
Wilkinson EC, Starke EL, Barbee SA. Wilkinson EC, et al. Front Genet. 2021 Oct 12;12:762012. doi: 10.3389/fgene.2021.762012. eCollection 2021. Front Genet. 2021. PMID: 34712272 Free PMC article. - Vesicle trafficking and vesicle fusion: mechanisms, biological functions, and their implications for potential disease therapy.
Cui L, Li H, Xi Y, Hu Q, Liu H, Fan J, Xiang Y, Zhang X, Shui W, Lai Y. Cui L, et al. Mol Biomed. 2022 Sep 21;3(1):29. doi: 10.1186/s43556-022-00090-3. Mol Biomed. 2022. PMID: 36129576 Free PMC article. Review. - Generation and Analysis of hTERT-RPE1 VPS54 Knock-Out and Rescued Cell Lines.
Khakurel A, Kudlyk T, Lupashin VV. Khakurel A, et al. Methods Mol Biol. 2023;2557:349-364. doi: 10.1007/978-1-0716-2639-9_22. Methods Mol Biol. 2023. PMID: 36512226 Free PMC article. - The GARP complex prevents sterol accumulation at the trans-Golgi network during dendrite remodeling.
O'Brien CE, Younger SH, Jan LY, Jan YN. O'Brien CE, et al. J Cell Biol. 2023 Jan 2;222(1):e202112108. doi: 10.1083/jcb.202112108. Epub 2022 Oct 14. J Cell Biol. 2023. PMID: 36239632 Free PMC article.
References
- Belenkaya TY, Wu Y, Tang X, Zhou B, Cheng L, Sharma YV, Yan D, Selva EM, Lin X. The retromer complex influences Wnt secretion by recycling wntless from endosomes to the trans-Golgi network. Dev Cell. 2008;14:120–131. - PubMed
- Bonifacino JS, Glick BS. The mechanisms of vesicle budding and fusion. Cell. 2004;116:153–166. - PubMed
- Brunet S, Sacher M. In sickness and in health: the role of TRAPP and associated proteins in disease. Traffic. 2014;15:803–818. - PubMed
Publication types
MeSH terms
Substances
LinkOut - more resources
Full Text Sources
Molecular Biology Databases
Research Materials
Miscellaneous
