NFATc1 promotes prostate tumorigenesis and overcomes PTEN loss-induced senescence - PubMed (original) (raw)
. 2016 Jun 23;35(25):3282-92.
doi: 10.1038/onc.2015.389. Epub 2015 Oct 19.
P Tripathi 2, A C Hsi 3, J Ning 1 3, M B Ruzinova 2, H Liapis 2, M Bailey 3, H Zhang 4, C A Maher 1 3 5, P A Humphrey 6, G L Andriole 5 7, L Ding 1 3 5, Z You 8, F Chen 1 5 9
Affiliations
- PMID: 26477312
- PMCID: PMC5012433
- DOI: 10.1038/onc.2015.389
NFATc1 promotes prostate tumorigenesis and overcomes PTEN loss-induced senescence
K R Manda et al. Oncogene. 2016.
Abstract
Despite recent insights into prostate cancer (PCa)-associated genetic changes, full understanding of prostate tumorigenesis remains elusive owing to complexity of interactions among various cell types and soluble factors present in prostate tissue. We found the upregulation of nuclear factor of activated T cells c1 (NFATc1) in human PCa and cultured PCa cells, but not in normal prostates and non-tumorigenic prostate cells. To understand the role of NFATc1 in prostate tumorigenesis in situ, we temporally and spatially controlled the activation of NFATc1 in mouse prostate and showed that such activation resulted in prostatic adenocarcinoma with features similar to those seen in human PCa. Our results indicate that the activation of a single transcription factor, NFATc1 in prostatic luminal epithelium to PCa can affect expression of diverse factors in both cells harboring the genetic changes and in neighboring cells through microenvironmental alterations. In addition to the activation of oncogenes c-MYC and STAT3 in tumor cells, a number of cytokines and growth factors, such as IL1β, IL6 and SPP1 (osteopontin, a key biomarker for PCa), were upregulated in NFATc1-induced PCa, establishing a tumorigenic microenvironment involving both NFATc1 positive and negative cells for prostate tumorigenesis. To further characterize interactions between genes involved in prostate tumorigenesis, we generated mice with both NFATc1 activation and Pten inactivation in prostate. We showed that NFATc1 activation led to acceleration of Pten null-driven prostate tumorigenesis by overcoming the PTEN loss-induced cellular senescence through inhibition of p21 activation. This study provides direct in vivo evidence of an oncogenic role of NFATc1 in prostate tumorigenesis and reveals multiple functions of NFATc1 in activating oncogenes, in inducing proinflammatory cytokines, in oncogene addiction, and in overcoming cellular senescence, which suggests calcineurin-NFAT signaling as a potential target in preventing PCa.
Conflict of interest statement
The authors declare no conflict of interest.
Figures
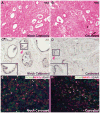
Figure 1. NFATc1 in human PCa and human PCa cell lines. NFATc1+ cells are absent in non-neoplastic human prostate
NFATc1+ cells are absent in non-neoplastic human prostate (A), but detected in human PCa (B–C). NFATc1 is expressed in the PCa cell lines but not in the non-tumorigenic RWPE1 cells (D–G).
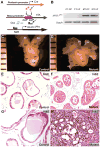
Figure 2. Inducible NFATc1 activation in prostatic epithelium causes PIN and prostatic adenocarcinoma
A, Cre induces the production of rtTA in prostatic epithelium. Binding of the Dox-rtTA complex to TetO leads to the production of NFATc1Nuc. B, RT-PCR using RNA from prostates of control (CT) and mutant (MT) mice treated with Dox showed expression of NFATc1Nuc only in the mutant prostates. DP: dorsal prostate. VP: ventral prostate. TetO: Tetracycline-responsive operator. rtTA: reverse tetracycline_-_controlled transactivator C and D, Prostates from control and mutant mice treated with Dox for 14 weeks starting from P21. U: Urethra; DP: Dorsal prostate; VP: Ventral prostate; UB: Urinary bladder. SV: Seminal vesicle. E and F, H&E Sections of the prostates from control and mutant mice treated with Dox for 6 weeks starting from P21. PINs are obvious in the mutants. G and H, Prostates from control and mutant treated with Dox for 14 weeks starting from P21.
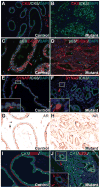
Figure 3. NFATc1-induced PCa has pathological changes resembling human PCa
Samples were from littermates treated with Dox from P21 for 14 weeks. A, the control prostatic gland has CK5+ basal cells and CK8+ luminal epithelium. B, the adenocarcinoma has predominantly CK8+ luminal epithelial cells and few CK5+ basal cells. C–D, p63+ basal cells were present in the control prostate (arrowheads) but absent from NFATc1-induced PCa. E–F, very few SYNAP+ neuroendocrine cells are present in the periphery of the adenocarcinoma. G and H, mutant luminal epithelial cells retain nuclear AR expression. Unlike the control (I), discontinuation of the SMA+ fibromuscular layer and invasion of the CK8+ cells into the stroma (arrowheads in J) can be seen in the mutants.
Figure 4. Active proliferation of NFATc1− cells appears to result from a non-cell autonomous effects of NFATc1 activation in a promitogenic microenvironment
The prostate samples were from mice treated for 14 weeks from P21. N: NFATc1, P: PCNA, M: c-MYC, S: pSTAT3, CT: controls, MT: mutants. Immunostaining using NFATc1 and PCNA showed that a high percentage of NFATc1+ cells were actively proliferating (49.5±4.40%). The percentage of proliferating NFATc1− cells in the mutants (15.8±2.57%), albeit smaller than that of the NFATc1+ cells in the mutants (*p <0.01, N=9), was still substantial and significantly more than the NFATc1− cells in the controls (3.33±1.33% #p<0.01, N=9) (A–C). NFATc1 activation led to significant upregulation of c-MYC in the tumor tissue (D–E). 56.6±7.45% of NFATc1+ cells expressed c-MYC and a smaller percentage (32.4±4.0%) of NFATc1− cells were c-MYC+ (*p<0.01, N=9). The NFATc1−, c-MYC+ cells are drastically more numerous in the mutants than in the controls (1.33±0.57%, #p<0.01, N=9) (F). Double immunostaining with antibodies against NFATc1 and phospho-STAT3 (pSTAT3-Tyr705) showed higher percentage of NFATc1+ cells with nuclear STAT3 (%) than NFATc1− cells with nuclear STAT3 (17.67±1.45%, *p<0.01, N=9) (G–I). However, the percentage of NFATc1−, pSTAT3+ cells is much higher in the mutants than in the control prostates (0%, N=9). Western blot analysis of prostate lysates from controls and PCa from mutants was probed by antibodies against STAT3 (revealing total STAT3 levels) and pSTAT3 (revealing the levels of activated STAT3). The results showed activation of STAT3 specifically in NFATc1-induced PCa, while the levels of total STAT3 were unchanged (J). All data are presented as mean ± s.d and two-tailed t-tests were performed between groups.
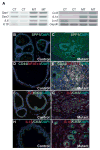
Figure 5. Increased expression of a number of secreted factors in NFATc1-induced PCa
A. Number of secretory factors known to play in PCa progression like SPP1, IL6, IL1β, IL1α, along with several other genes were evaluated for transcriptional changes with RT-PCR using RNA from prostates of control (CT) and mutant (MT) mice treated with Dox for 14 weeks. B–I, Immunostaining showed more extensive expression of Spp1, CD44, IL6, and IL1β in PCa from the prostates of mutant mice compared to their littermate controls.
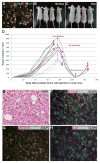
Figure 6. Allografts of NFATc1-induced tumors showed continuous dependency on NFATc1 for tumor progression and survival but not on T cell functions
Cells from NFATc1-induced PCa samples were isolated and cultured. Most of the cultured cells expressed NFATc1 and the HA tag (A). Cultured tumor cells were injected subcutaneously into the lower flanks of nude mice. 100% of the Dox-treated recipients developed tumors by 4 weeks, whereas none of the untreated mice did (B–D). Termination of Dox treatment resulted in significant decrease in tumor size. Such decrease was reverted if Dox treatment was restarted (D). Representative images of H&E stained nude mice allograft (E). The allograft tumors predominantly consist of NFATc1+ cells expressing E-Cad (F). Similar to the original tumor, extensive pSTAT3 (G) and IL6 (H) expression was observed in the allograft tumors.
Figure 7. NFATc1-induced tumors are castration resistant
Representative images of H&E stained sections of tumors from mock-castrated and castrated mice showing PCa (A–B). Predominantly nuclear AR is present in mock-castrated mice. AR signal is weak and diffuse in the sample from the castrated mutants. The insets represent higher magnification images of the black rectangles indicated by arrows (C–D). The numbers of proliferating cells in mock-castrated and castrated mice expressing NFATc1 and PCNA markers (E–F) are very similar.
Figure 8. NFATc1 and PI3K-Akt signaling pathway synergize to drive accelerated tumor formation
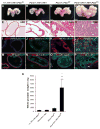
Representative images of tumors with PCre/+;RT/+;TN/+;Ptenfl/fl double mutants showing significantly enlarged tumors compared to control (no NFATc1 activation or Pten deletion), PCre/+;RT/+;TN/+ (NFATc1 activation alone), and PCre/+;Ptenfl/fl (Pten deletion alone) groups (A–D). H&E staining of prostates at 10 weeks of age reveals normal glands in controls, PIN in PCre/+;RT/+;TN/+ mice, morphologically more advanced PIN in PCre/+;Ptenfl/fl mice, and advanced PCa in PCre/+;RT/+;TN/+;Ptenfl/fl double mutant mice (E–H). Deletion of Pten results in activation of AKT in PCre/+;Ptenfl/fl and PCre/+;RT/+;TN/+;Ptenfl/fl mutant mice whereas no significant levels of pAKT were detected in control and NFATc1 activation only groups (I–L). Discontinuation of the SMA+ fibromuscular layer and invasion of the E-Cad+ cells into the stroma (arrowhead in P) can be seen in the mutants (M–P). Average whole prostate weight of the PCre/+;RT/+;TN/+;Ptenfl/fl mice is drastically higher than those of the +/+;RT/+;TN/+;Ptenfl/+ mice (*p <0.05, N=7) PCre/+;RT/+;TN/+ mice (**p <0.05, N=7), and PCre/+;Ptenfl/fl mice (***p <0.05, N=7). (Q). All data are presented as mean ± s.d. Two- tailed t-tests were performed for comparison between groups.
Figure 9. NFAT Activation overcomes PTEN-loss-induced cellular senescence in PCa
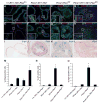
PCre/+;RT/+;TN/+;Ptenfl/fl mutant prostates have a much larger number of proliferating E-Cad+ cells when compared to control, PCre/+;RT/+;TN/+, and PCre/+;Ptenfl/fl mice (A–D). The insets are higher magnification images of the white rectangles indicated by arrows. Quantification of PCNA staining of 10-week-old prostates is shown in M. Asterisk indicates statistical significance between PCre/+;RT/+;TN/+;Ptenfl/fl double mutants and PCre/+;Ptenfl/fl single mutants (*p <0.05, N=5). E–L: Senescence analysis of prostates through p21 and SA-β-gal staining. Control and PCre/+;RT/+;TN/+ mutant lack p21-expressing cells. Mostly nuclear p21 expression was seen in large numbers of prostate epithelial cells in the PCre/+;Ptenfl/fl mice, whereas such cells are essentially absent in the PCre/+;RT/+;TN/+;Ptenfl/fl double mutants (*p <0.05, N=5) (E–H, N). The insets represent higher magnification images of the white rectangles indicated by arrows. Quantification of p21+ cells in 10-week-old prostates is shown in (N). I–L: Senescence-associated β-gal staining of prostates from 10-week-old mice. Prostates from control and PCre/+;RT/+;TN/+ mice had very few senescent cells. Prostates of the PCre/+;Ptenfl/fl mice contain a large number of senescent cells, when compared to prostates of the PCre/+;RT/+;TN/+;Ptenfl/fl double mutants showing drastically fewer p21+ senescent cells (*p <0.05, N=5) (I–L, O). Quantification of SA-β-gal+ cells in 10-week-old prostates (O) is consistent with the p21 data. Prostates from control and PCre/+;RT/+;TN/+ mice had few SA-β-gal+ senescent cells. Prostates of the PCre/+;Ptenfl/fl mice contain a large number of SA-β-gal+ senescent cells, when compared to prostates of the PCre/+;RT/+;TN/+;Ptenfl/fl double mutants that had significantly fewer SA-β-gal+ senescent cells (*p <0.05, N=5). All data are presented as mean ± s.d. Two- tailed t-tests were performed for comparison between groups. Asterisk indicates statistical significance between the PCre/+;Ptenfl/fl single mutants and the PCre/+;RT/+;TN/+;Ptenfl/fl double mutants.
Similar articles
- Activation of NFAT signaling establishes a tumorigenic microenvironment through cell autonomous and non-cell autonomous mechanisms.
Tripathi P, Wang Y, Coussens M, Manda KR, Casey AM, Lin C, Poyo E, Pfeifer JD, Basappa N, Bates CM, Ma L, Zhang H, Pan M, Ding L, Chen F. Tripathi P, et al. Oncogene. 2014 Apr 3;33(14):1840-9. doi: 10.1038/onc.2013.132. Epub 2013 Apr 29. Oncogene. 2014. PMID: 23624921 Free PMC article. - Down-Regulation of Nfatc1 Suppresses Proliferation, Migration, Invasion, and Warburg Effect in Prostate Cancer Cells.
Liu Y, Liang T, Qiu X, Ye X, Li Z, Tian B, Yan D. Liu Y, et al. Med Sci Monit. 2019 Feb 28;25:1572-1581. doi: 10.12659/MSM.910998. Med Sci Monit. 2019. PMID: 30817743 Free PMC article. - Klf5 deletion promotes Pten deletion-initiated luminal-type mouse prostate tumors through multiple oncogenic signaling pathways.
Xing C, Ci X, Sun X, Fu X, Zhang Z, Dong EN, Hao ZZ, Dong JT. Xing C, et al. Neoplasia. 2014 Nov 20;16(11):883-99. doi: 10.1016/j.neo.2014.09.006. eCollection 2014 Nov. Neoplasia. 2014. PMID: 25425963 Free PMC article. - Role of epithelial mesenchymal transition in prostate tumorigenesis.
Khan MI, Hamid A, Adhami VM, Lall RK, Mukhtar H. Khan MI, et al. Curr Pharm Des. 2015;21(10):1240-8. doi: 10.2174/1381612821666141211120326. Curr Pharm Des. 2015. PMID: 25506896 Free PMC article. Review. - Prostate-Specific G-Protein Coupled Receptor, an Emerging Biomarker Regulating Inflammation and Prostate Cancer Invasion.
Rodriguez M, Siwko S, Liu M. Rodriguez M, et al. Curr Mol Med. 2016;16(6):526-32. doi: 10.2174/1566524016666160607091333. Curr Mol Med. 2016. PMID: 27280498 Review.
Cited by
- PGRMC1 Inhibits Progesterone-Evoked Proliferation and Ca2+ Entry Via STIM2 in MDA-MB-231 Cells.
Cantonero C, Salido GM, Rosado JA, Redondo PC. Cantonero C, et al. Int J Mol Sci. 2020 Oct 15;21(20):7641. doi: 10.3390/ijms21207641. Int J Mol Sci. 2020. PMID: 33076541 Free PMC article. - Targeting the NFAT1-MDM2-MDMX Network Inhibits the Proliferation and Invasion of Prostate Cancer Cells, Independent of p53 and Androgen.
Qin JJ, Li X, Wang W, Zi X, Zhang R. Qin JJ, et al. Front Pharmacol. 2017 Dec 14;8:917. doi: 10.3389/fphar.2017.00917. eCollection 2017. Front Pharmacol. 2017. PMID: 29311926 Free PMC article. - Thrombin Cleavage of Osteopontin and the Host Anti-Tumor Immune Response.
Leung LL, Myles T, Morser J. Leung LL, et al. Cancers (Basel). 2023 Jul 3;15(13):3480. doi: 10.3390/cancers15133480. Cancers (Basel). 2023. PMID: 37444590 Free PMC article. Review. - Calcium and Nuclear Signaling in Prostate Cancer.
Maly IV, Hofmann WA. Maly IV, et al. Int J Mol Sci. 2018 Apr 19;19(4):1237. doi: 10.3390/ijms19041237. Int J Mol Sci. 2018. PMID: 29671777 Free PMC article. Review. - A miR-335/COX-2/PTEN axis regulates the secretory phenotype of senescent cancer-associated fibroblasts.
Kabir TD, Leigh RJ, Tasena H, Mellone M, Coletta RD, Parkinson EK, Prime SS, Thomas GJ, Paterson IC, Zhou D, McCall J, Speight PM, Lambert DW. Kabir TD, et al. Aging (Albany NY). 2016 Aug;8(8):1608-35. doi: 10.18632/aging.100987. Aging (Albany NY). 2016. PMID: 27385366 Free PMC article.
References
- Alberti C. Genetic and microenvironmental implications in prostate cancer progression and metastasis. Eur Rev Med Pharmacol Sci. 2008;12:167–175. - PubMed
- Graef IA, Chen F, Crabtree GR. NFAT signaling in vertebrate development. Curr Opin Genet Dev. 2001;11:505–512. - PubMed
- Neal JW, Clipstone NA. A constitutively active NFATc1 mutant induces a transformed phenotype in 3T3-L1 fibroblasts. J Biol Chem. 2003;278:17246–17254. - PubMed
Publication types
MeSH terms
Substances
Grants and funding
- R01 DK087960/DK/NIDDK NIH HHS/United States
- U01 HG006517/HG/NHGRI NIH HHS/United States
- R01 CA174714/CA/NCI NIH HHS/United States
- R01 CA180006/CA/NCI NIH HHS/United States
- R01 CA178383/CA/NCI NIH HHS/United States
LinkOut - more resources
Full Text Sources
Other Literature Sources
Medical
Molecular Biology Databases
Research Materials
Miscellaneous

