Targeting arginase-II protects mice from high-fat-diet-induced hepatic steatosis through suppression of macrophage inflammation - PubMed (original) (raw)
Targeting arginase-II protects mice from high-fat-diet-induced hepatic steatosis through suppression of macrophage inflammation
Chang Liu et al. Sci Rep. 2016.
Abstract
Nonalcoholic fatty liver disease (NAFLD) associates with obesity and type 2 diabetes. Hypoactive AMP-activated protein kinase (AMPK), hyperactive mammalian target of rapamycin (mTOR) signaling, and macrophage-mediated inflammation are mechanistically linked to NAFLD. Studies investigating roles of arginase particularly the extrahepatic isoform arginase-II (Arg-II) in obesity-associated NAFLD showed contradictory results. Here we demonstrate that Arg-II(-/-) mice reveal decreased hepatic steatosis, macrophage infiltration, TNF-α and IL-6 as compared to the wild type (WT) littermates fed high fat diet (HFD). A higher AMPK activation (no difference in mTOR signaling), lower levels of lipogenic transcription factor SREBP-1c and activity/expression of lipogenic enzymes were observed in the Arg-II(-/-) mice liver. Moreover, release of TNF-α and IL-6 from bone marrow-derived macrophages (BMM) of Arg-II(-/-) mice is decreased as compared to WT-BMM. Conditioned medium from Arg-II(-/-)-BMM exhibits weaker activity to facilitate triglyceride synthesis paralleled with lower expression of SREBP-1c and SCD-1 and higher AMPK activation in hepatocytes as compared to that from WT-BMM. These effects of BMM conditioned medium can be neutralized by neutralizing antibodies against TNF-α and IL-6. Thus, Arg-II-expressing macrophages facilitate diet-induced NAFLD through TNF-α and IL-6 in obesity.
Figures
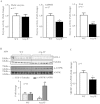
Figure 1. Liver weight is reduced in obese Arg-II−/− mice.
Starting from 7 weeks of age, male wild-type (WT) and Arg-II−/− mice were fed a HFD for 14 weeks to induce obesity or maintained on normal chow diet (NC) as controls. (A) Body weight was measured at the start and at the end of HFD or NC feeding. (B) Weight gains during HFD feeding period. (C) Liver weight at the end of HFD. (D) Ratio of the liver weight and body weight at the end of HFD. *p < 0.05 and ***p < 0.001 between the indicated groups.
Figure 2. HFD-induced hepatic steatosis is reduced in Arg-II−/− mice.
Presented are images of (A) HE staining taken at two different magnifications. (B) Oil Red O staining in liver of WT and Arg-II−/− mice on either normal chow diet (NC) or high fat diet (HFD). Scale bar = 0.2 mm. (C) Liver triglyceride content. **p < 0.01, ***p < 0.001 between the indicated groups.
Figure 3. Reduced lipogenic enzyme activity/expression and SREBP-1c expression, and enhanced AMPK signaling in obese Arg-II−/− mice.
(A) Activity of malic enzyme (ME), glucose-6-phosphate-dehydrogenase (G6PDH) and FAS in liver from obese WT and Arg-II−/− mice. (B) Shown is immunoblotting analysis of SCD-1 and phosphorylated AMPK-T172 (p-AMPK) and total AMPK levels from obese WT and Arg-II−/− liver. Tubulin served as a loading control. Quantification of the signals is presented in the graphics below. (C) qRT-PCR analysis of SREBP-1c mRNA expression in liver from obese WT and Arg-II−/− mice. *p < 0.05 and ***p < 0.001 vs WT-HFD.
Figure 4. Enhanced adiponectin in fat tissue but not in plasma or liver in Arg-II−/− mice.
(A) qRT-PCR analysis of adiponectin mRNA expression in epididymal fat tissue from obese WT and Arg-II−/− mice. ***p < 0.001 vs WT-HFD group. (B) Adiponectin level in plasma measured by ELISA. (C) qRT-PCR analysis of mRNA expression of adiponectin in liver tissue from obese WT and Arg-II−/− mice.
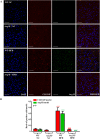
Figure 5. Enhanced hepatic inflammation upon HFD in WT is associated with increased Arg-II expression in macrophages in liver, which is abrogated by Arg-II-deficiency.
(A) Shown are representative images of immunostaining of the liver sections with macrophage marker CLEC4F (red) and Arg-II (green) followed by nuclei counterstaining with DAPI (blue). Scale bar = 50 μm. (B) Quantification of the signal is expressed as a ratio of CLEC4F- or Arg-II-positive cells to tissue nuclei number. ***P < 0.001 vs WT-NC. ###P < 0.001 vs WT-HFD.
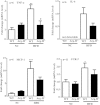
Figure 6. Decreased cytokine production in liver of Arg-II−/− mice.
qRT-PCR analysis of mRNA expression of cytokines in liver tissue from WT and Arg-II−/− mice either on NC or HFD. Except for IL-6, all data are presented as fold change from WT-NC group, since IL-6 is not detectable in WT-NC; the data for IL-6 are presented as fold change from WT-HFD group. *p < 0.05, **p < 0.01, ***p < 0.001 vs WT-NC group; #p < 0.05 vs WT-HFD group.
Figure 7. Suppressed production of IL-6 and TNF-α in Arg-II−/− macrophages accounts for reduced lipogenesis in hepatocyte AML12 cells.
The serum-starved (overnight) WT- or Arg-II−/−-BMM were incubated in the absence or presence of 100 ng/ml LPS for 8 hours, the conditioned medium (CM) was then collected. (A) IL-6 and TNF-α production in CM collected from WT- or Arg-II−/−-BMMs in the absence or presence of LPS was evaluated by ELISA. ***p < 0.001 vs controls (-LPS), ###p < 0.001 vs WT+LPS. (B) AML12 hepatocytes were serum-starved for 6 hours in 0.2% bovine serum albumin (BSA)-ITS-DMEM-F-12 Ham medium and then incubated with CM of LPS-treated BMM from WT or Arg-II−/− mice as indicated in the presence of oleic acid (OA, 20 mmol/L) for 24 hours. The lipid was then extracted for measurement of the triglyceride content in the cells. *p < 0.05 vs WT-CM. (C) Experiment procedure is the same as in panel B, except that BMM-CM was pre-treated for 2 hours with control rat IgG (10 μg/ml) or neutralizing antibodies anti-IL-6 (18 μg/ml) or anti-TNF-α (0.4 μg/ml) or anti-IL-6 (18 μg/ml) plus anti-TNF-α prior to the addition to the cells. *p < 0.05, **p < 0.01, ***p < 0.001 vs (WT-BMM-CM + IgG); ##p < 0.01, ###p < 0.001 vs (Arg-II−/− -BMM-CM + IgG).
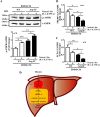
Figure 8. CM from Arg-II−/−-BMM elicits increased AMPK signaling and decreased SREPBP-1c and SCD-1 in hepatocytes.
Experiment procedure is the same as in Fig. 7B, except that (A) AML12 hepatocyte cell lysates were prepared for immunoblotting analysis of AMPK activation. Quantification of the signals is presented below. (B,C) RNA was extracted for qRT-PCR analysis of mRNA expression of SREBP-1c and SCD-1. For all the panels *p < 0.05, **p < 0.01, ***p < 0.001 between the indicated groups. Neutral. Abs means neutralizing antibodies. IgG was used as control (-) for neutralizing antibodies. (D) Schematic illustration of the major findings of this study.
Similar articles
- Chronic administration of recombinant IL-6 upregulates lipogenic enzyme expression and aggravates high-fat-diet-induced steatosis in IL-6-deficient mice.
Vida M, Gavito AL, Pavón FJ, Bautista D, Serrano A, Suarez J, Arrabal S, Decara J, Romero-Cuevas M, Rodríguez de Fonseca F, Baixeras E. Vida M, et al. Dis Model Mech. 2015 Jul 1;8(7):721-31. doi: 10.1242/dmm.019166. Epub 2015 May 14. Dis Model Mech. 2015. PMID: 26035386 Free PMC article. - Thyrotropin increases hepatic triglyceride content through upregulation of SREBP-1c activity.
Yan F, Wang Q, Lu M, Chen W, Song Y, Jing F, Guan Y, Wang L, Lin Y, Bo T, Zhang J, Wang T, Xin W, Yu C, Guan Q, Zhou X, Gao L, Xu C, Zhao J. Yan F, et al. J Hepatol. 2014 Dec;61(6):1358-64. doi: 10.1016/j.jhep.2014.06.037. Epub 2014 Jul 10. J Hepatol. 2014. PMID: 25016220 - Honokiol activates the LKB1-AMPK signaling pathway and attenuates the lipid accumulation in hepatocytes.
Seo MS, Kim JH, Kim HJ, Chang KC, Park SW. Seo MS, et al. Toxicol Appl Pharmacol. 2015 Apr 15;284(2):113-24. doi: 10.1016/j.taap.2015.02.020. Epub 2015 Feb 28. Toxicol Appl Pharmacol. 2015. PMID: 25737164 - Effects of Natural Products on Fructose-Induced Nonalcoholic Fatty Liver Disease (NAFLD).
Chen Q, Wang T, Li J, Wang S, Qiu F, Yu H, Zhang Y, Wang T. Chen Q, et al. Nutrients. 2017 Jan 31;9(2):96. doi: 10.3390/nu9020096. Nutrients. 2017. PMID: 28146130 Free PMC article. Review. - Hepatic AMP Kinase as a Potential Target for Treating Nonalcoholic Fatty Liver Disease: Evidence from Studies of Natural Products.
Xu G, Huang K, Zhou J. Xu G, et al. Curr Med Chem. 2018;25(8):889-907. doi: 10.2174/0929867324666170404142450. Curr Med Chem. 2018. PMID: 28393690 Review.
Cited by
- HFD-induced hepatic lipid accumulation and inflammation are decreased in Factor D deficient mouse.
Tsuru H, Osaka M, Hiraoka Y, Yoshida M. Tsuru H, et al. Sci Rep. 2020 Oct 16;10(1):17593. doi: 10.1038/s41598-020-74617-5. Sci Rep. 2020. PMID: 33067533 Free PMC article. - Targeting macrophagic 17_β_-HSD7 by fenretinide for the treatment of nonalcoholic fatty liver disease.
Dong X, Feng Y, Xu D, Zhang M, Wen X, Zhao W, Hu Q, Zhang Q, Fu H, Ping J. Dong X, et al. Acta Pharm Sin B. 2023 Jan;13(1):142-156. doi: 10.1016/j.apsb.2022.04.003. Epub 2022 Apr 9. Acta Pharm Sin B. 2023. PMID: 36815031 Free PMC article. - Arginase: shedding light on the mechanisms and opportunities in cardiovascular diseases.
Li Z, Wang L, Ren Y, Huang Y, Liu W, Lv Z, Qian L, Yu Y, Xiong Y. Li Z, et al. Cell Death Discov. 2022 Oct 8;8(1):413. doi: 10.1038/s41420-022-01200-4. Cell Death Discov. 2022. PMID: 36209203 Free PMC article. Review. - Pathophysiology of Arginases in Cancer and Efforts in Their Pharmacological Inhibition.
Marzęta-Assas P, Jacenik D, Zasłona Z. Marzęta-Assas P, et al. Int J Mol Sci. 2024 Sep 10;25(18):9782. doi: 10.3390/ijms25189782. Int J Mol Sci. 2024. PMID: 39337272 Free PMC article. Review. - The Mechanism of Zinc Sulfate in Improving Fertility in Obese Rats Analyzed by Sperm Proteomic Analysis.
Ma J, Han R, Li Y, Cui T, Wang S. Ma J, et al. Biomed Res Int. 2020 May 4;2020:9876363. doi: 10.1155/2020/9876363. eCollection 2020. Biomed Res Int. 2020. PMID: 32462040 Free PMC article.
References
- Anderson N. & Borlak J. Molecular mechanisms and therapeutic targets in steatosis and steatohepatitis. Pharmacol Rev 60, 311–357 (2008). - PubMed
- Targher G. & Byrne C. D. Clinical Review: Nonalcoholic fatty liver disease: a novel cardiometabolic risk factor for type 2 diabetes and its complications. J Clin Endocrinol Metab 98, 483–495 (2013). - PubMed
- Angulo P. Nonalcoholic fatty liver disease. N Engl J Med 346, 1221–1231 (2002). - PubMed
- Brown M. S. & Goldstein J. L. Selective versus total insulin resistance: a pathogenic paradox. Cell Metab 7, 95–96 (2008). - PubMed
Publication types
MeSH terms
Substances
LinkOut - more resources
Full Text Sources
Other Literature Sources
Medical
Research Materials
Miscellaneous


