Melanoma cell lysosome secretory burst neutralizes the CTL-mediated cytotoxicity at the lytic synapse - PubMed (original) (raw)
Melanoma cell lysosome secretory burst neutralizes the CTL-mediated cytotoxicity at the lytic synapse
Roxana Khazen et al. Nat Commun. 2016.
Abstract
Human melanoma cells express various tumour antigens that are recognized by CD8(+) cytotoxic T lymphocytes (CTLs) and elicit tumour-specific responses in vivo. However, natural and therapeutically enhanced CTL responses in melanoma patients are of limited efficacy. The mechanisms underlying CTL effector phase failure when facing melanomas are still largely elusive. Here we show that, on conjugation with CTL, human melanoma cells undergo an active late endosome/lysosome trafficking, which is intensified at the lytic synapse and is paralleled by cathepsin-mediated perforin degradation and deficient granzyme B penetration. Abortion of SNAP-23-dependent lysosomal trafficking, pH perturbation or impairment of lysosomal proteolytic activity restores susceptibility to CTL attack. Inside the arsenal of melanoma cell strategies to escape immune surveillance, we identify a self-defence mechanism based on exacerbated lysosome secretion and perforin degradation at the lytic synapse. Interfering with this synaptic self-defence mechanism might be useful in potentiating CTL-mediated therapies in melanoma patients.
Figures
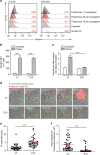
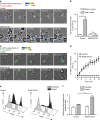
Figure 1. Defective lethal hit delivery at the CTL/melanoma cell synapse.
(a) Time kinetics of perforin staining on the surface of conventional target cells (JY) and melanoma cells (D10) following conjugation with CTL. Target cells were either unpulsed or pulsed with 10 μM antigenic peptide. The median fluorescence intensity (MFI) of perforin staining is indicated. (b) Efficient activation of CTL to lethal hit delivery following encounter with peptide-pulsed melanoma cells. Target cells either pulsed or not with antigenic peptide were conjugated for 1 h with CTL. Cells were stained for CD107a extracellular exposure at 4 °C. (c) Measurement of target cell killing. Cytotoxicity was evaluated by FACS analysis in target cells either pulsed or not with antigenic peptide following 4 h incubation with CTL. Cytotoxicity is expressed as fold increase over corresponding basal death. (d) Sequences of snapshots depicting either JY or D10 cells pulsed with the antigenic peptide interacting with tubulin tracker green-labelled CTL. PI was added to the culture medium to a final concentration of 200 μM at time 0. Perforin pore formation on target cells was detected by PI internalization (red). Typical conjugates with the JY and D10 target cells are shown. Supplementary Movies 1 and 2 show the entire time-lapse recording. Scale bars, 5 μm. (e) Time required for detection of initial PI entry in target cells in JY or D10/CTL conjugates as detected by 1 h time-lapse confocal microscopy. Red bars represent the mean time. (f) Measurement of the cytosolic PI intensity in target cells at the end of the time-lapse video recording in CTL/target cell conjugates. Red bars represent the mean PI fluorescence intensity. Analysis in e and f was performed only on cells exhibiting detectable PI entry. In a, results are representative of three independent experiments. In b and c results are expressed as mean±s.e.m. of three independent experiments (b) and four independent experiments (c). In e and f data are from 40 conjugates for each cell type. Data are from three independent experiments. Unpaired Student's _t_-test using the GraphPad Prism software (version 6; GraphPad) was used to determine the statistical significance of differences between the groups. ***P<0.001, **P<0.01.
Figure 2. Defective granzyme B penetration in melanoma cells.
(a) Visualization of GrzB staining in CTL/target cell conjugates by confocal laser scanning microscopy. Target cells were previously pulsed with 10 μM peptide. Cells were stained with anti-α tubulin (green) and anti GrzB (red). Target cells were identified by loading them with Cell Tracker Blue before conjugation (cyan). Percentage of GrzB+ target cells in peptide-pulsed JY and D10 cells are indicated. Sixty conjugates from three independent experiments were scored. Scale bars, 5 μm. Results are expressed as mean±s.e.m. of three independent experiments. Unpaired Student's _t_-test using the GraphPad Prism software was used to determine the statistical significance of differences between the groups. ***P<0.001. (b) Left panels: time kinetics of GrzB staining in conventional target cells (JY) and melanoma cells (D10), either unpulsed or pulsed with 10 μM peptide concentration, following conjugation with CTL. Right panels: time course of GrzB loss in CTL following interaction with target cells. Target cells were either unpulsed or pulsed with the antigenic peptide. The median fluorescence intensity of GrzB staining is indicated. Results are from one representative experiment out of three. (c) Pooled results from three independent experiments showing the time-dependent loss of GrzB by CTL interacting with JY cells (black dotted lines) or with D10 cells (red dotted lines) and GrzB uptake by JY cells (black plain lines) or by D10 cells (red plain lines). MFI, median fluorescence intensity. Results are expressed as mean±s.e.m. of three independent experiments.
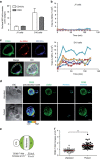
Figure 3. Melanoma cells exhibit a high-rate vesicular trafficking and enrich LLE vesicles at the lytic synapse during conjugation with CTL.
(a) Extracellular staining for CD107a and CD63 on JY and D10 cell surface as detected by FACS analysis. Results are shown as median fluorescence intensity (MFI) fold increase over isotype control. Results are expressed as mean±s.e.m. of five independent experiments. (b) basal lysosomal endo/exocytosis was quantified via Av-SRho uptake by JY (upper panel) or D10 cells (lower panel) in the presence of 8 μg ml−1 Av-SRho in the culture medium. Panels show Av-SRho fluorescence intensity in cells during 2 h acquisition, as measured by time-lapse confocal microscopy. Graphs show six cells representative of the two cell types from three independent experiments. (c) Av-SRho accumulates in melanoma cells lysosomal compartment. Melanoma cells were incubated in the presence of 8 μg ml−1 of Av-SRho (red) overnight. Cells were fixed, permeabilized and stained for CD107a (blue) and CD63 (green). (d) Melanoma cells either unpulsed or pulsed with 10 μM antigenic peptide were conjugated with peptide-specific CTL for 5 min at 37 °C. Cells were then fixed, permeabilized and stained for CD63 (green and pseudo-colour) and perforin (cyan). Scale bars, 5 μm. (e) Scheme depicting the gating strategy used to measure CD63 fluorescence intensity in melanoma cells in a cell volume corresponding to the synaptic area and in an equal volume drawn at the opposite side of the cell. (f) Re-localization of lysosomal compartments was quantified by measuring the CD63 fluorescence intensity fold increase at the lytic synapse in melanoma cells (as indicated in the scheme). In all, 45 and 60 conjugates (for unpulsed and peptide-pulsed cells, respectively) formed by only one melanoma cell and one CTL were scored. Data are from three independent experiments. Bars indicate mean values. Unpaired Student's _t_-test using the GraphPad Prism software was used to determine the statistical significance of differences between the groups. **P<0.01.
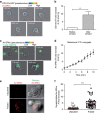
Figure 4. Recruitment of melanoma cell lysosomal compartment to the lytic synapse.
(a,b) Melanoma cells expressing CD107a-GFP and pulsed with 10 μM antigenic peptide were monitored during interaction with CTL using a spinning-disk confocal microscope. (a) Snap shots depicting the CD107a-GFP+ LLE localization before conjugation and after conjugation. The pseudo colour scale indicates molecular enrichment. Snapshots are from Supplementary Movie 5. (b) Quantification of CD107a fluorescence intensity (FI) fold increase. FI either before or 5 min after cell–cell conjugation in 13 melanoma cells conjugated with CTL was measured at the lytic synapse and normalized over FI measured in the region of interest at time 0. Data are from five independent experiments. (c,d) Peptide-pulsed melanoma cells were monitored during interaction with CTL in the presence of 8 μg ml−1 Av-SRho by spinning-disk confocal microscopy. (c) Sequences of snap shots depicting enhanced LLE vesicle exposure in peptide-pulsed melanoma cells during conjugation with CMFDA loaded CTL (green). Lysosomal exposure is detected via Av-SRho uptake (pseudo colour scale intensity). Snapshots are from Supplementary Movie 6. (d) Measurement of Av-SRho FI fold increase in peptide-pulsed melanoma cells during conjugation with CTL. Intensities were scored from 14 conjugates in nine independent experiments and normalized over Av-SRho FI of the cell of interest at time 0. Data are expressed as mean±s.e.m. of the scored cells. (e) Melanoma cells either pulsed or not with antigenic peptide were conjugated with peptide-specific CTL for 5 min at 37 °C in the presence of Av-SRho. Cells were fixed, permeabilized and stained for perforin (green). (f) Exposure of LLE vesicles was quantified by measuring the Av-SRho FI fold increase at the lytic synapse in melanoma cells (as indicated in the scheme in Fig. 3e). In all, 61 and 60 conjugates (for unpulsed and peptide-pulsed cells, respectively) formed by one melanoma cell and one CTL were scored. Data are from three independent experiments. Bars indicate mean values. Scale bars, 5 μm. Unpaired Student's _t_-test using the GraphPad Prism software was used to determine the statistical significance of differences between the groups. ***P<0.001.
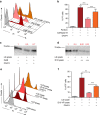
Figure 5. Perforin degradation by cathepsin and melanoma cell extracts.
(a,b) Measurement of perforin lytic activity on Jurkat cells. Jurkat cells were incubated with purified human perforin either in the absence or in the presence of CatB or of CatB plus CA074 for 1 h. PI entry in cells was measured by flow cytometry. (a) Plots show results from one representative experiment; (b) data are expressed as mean±s.e.m. of four independent experiments. (c,d) Degradation of perforin in isolated CTL lytic granules. (c) Western blot analysis of lytic granule perforin either untreated or incubated with CatB or with CatB plus CA074. (d) Western blot analysis of lytic granule perforin either untreated or incubated with increasing concentrations of melanoma cell lysates (+ 0.5 μg ml−1; ++ 1 μg ml−1; +++ 3 μg ml−1). Results are from one representative experiment out of three. Numbers indicate band intensity fold increase. (e,f) Jurkat cells were incubated for 1 h with purified human lytic granules lysate either in the absence or in the presence of melanoma cell vesicular fraction lysates or of melanoma cell vesicular fraction lysates plus CA074 for 1 h. PI entry in cells was measured by flow cytometry. (e) Plots show result from one representative experiment; (f) data are expressed as mean±s.e.m. of three independent experiments. Unpaired Student's _t_-test using the GraphPad Prism software was used to determine the statistical significance of differences between the groups. ***P<0.001, **P<0.01. LG, lytic granules; VF, vesicular fraction.
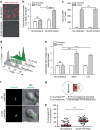
Figure 6. Interference with melanoma cell vesicular trafficking enhances their susceptibility to perforin-mediated cytotoxicity.
(a) Upper panel: sequence of snap shots depicting dynamics of CD107a/GFP+ intracellular vesicles (pseudo colour scale intensity) in control non-targeting shRNA (shCtr) transfected 10 μM peptide-pulsed melanoma cell during conjugation with CTL. Snapshots are from Supplementary Movie 13. Lower panel: sequence of snap shots depicting dynamics of CD107a/GFP+ intracellular vesicles (pseudo colour scale intensity) in SNAP-23 silenced peptide-pulsed melanoma cell during its conjugation with a CTL. Snapshots are from Supplementary Movie 11. CTL lytic granules are stained in red. (b) Quantification of CD107a fluorescence intensity (FI) fold increase at the lytic synapse of 8 SNAP-23 silenced peptide-pulsed melanoma cells conjugated with CTL either before or 5 min after cell–cell conjugation. Data are from two independent experiments. (c) Upper panel: sequence of snap shots depicting LLE vesicle exocytosis of shCtr transfected peptide-pulsed melanoma cells interacting with CMFDA-loaded CTL (green). Lysosomal exposure is detected via Av-SRho binding (pseudo colour scale intensity). Snapshots are from Supplementary Movie 14. Lower panel: sequence of snap shots depicting LLE vesicle exocytosis of a SNAP-23 silenced peptide-pulsed melanoma cell interacting with CMFDA loaded CTL (green). Lysosomal exposure is detected via Av-SRho binding (pseudo colour scale intensity). Snapshots are from Supplementary Movie 12. (d) Measurement of Av-SRho FI fold increase in SNAP-23 silenced peptide-pulsed melanoma cells during conjugation with CTL. Intensities were scored from eight conjugates in three independent experiments. Data are expressed as mean±s.e.m. of the scored cells. (e,f) Cytotoxicity was evaluated in melanoma cells either transduced with shCtr or with shRNA targeting SNAP-23 (shSNAP-23) following 4 h incubation with CTL. Melanoma cells were either unpulsed or peptide-pulsed and cytotoxicity was quantified by measuring 7-AAD uptake by FACS analysis. (e) A representative experiment is shown; (f) pooled data from three independent experiments. Cytotoxicity is expressed as fold increase over corresponding basal death in transduced cells. Scale bars, 5 μm. Unpaired Student's _t_-test using the GraphPad Prism software was used to determine the statistical significance of differences between the groups. ***P<0.001.
Figure 7. Impairment of melanoma cell lysosome function enhances their susceptibility to perforin-mediated cytotoxicity.
(a) Cells were either untreated or treated for 2 h with 40 μM monensin, washed and stained with lysotracker red. Panels show typical snap shots of treated and untreated melanoma cells. (b) Cytotoxicity was evaluated by FACS analysis in melanoma cells following 4 h incubation with CTL. Melanoma cells either pretreated or not with 40 μM monensin for 2 h before conjugation were either unpulsed or pulsed with 10 μM antigenic peptide. Cytotoxicity is expressed as % of positive 7-AAD cells.(c) Efficient activation of CTL to lethal hit delivery after encountering melanoma cells treated or not with monensin. Target cells, either pretreated or not with 40 μM monensin were conjugated for 1 h with specific CTL. Cells were surface stained for CD107a. (d,e) Cytotoxicity was evaluated in melanoma cells following 4 h incubation with CTL. Melanoma cells were either untreated or treated with E64d or CI3 protease inhibitors. Melanoma cells were either unpulsed or peptide pulsed and cytotoxicity was quantified by measuring 7-AAD uptake by FACS analysis. (d) A representative experiment is shown; (e) pooled data from three independent experiments. Cytotoxicity is expressed as % of positive 7-AAD cells. (f) Perforin quanta (green) at the lytic synapse after 5 min conjugation with CTL of peptide-pulsed melanoma cells (either untreated or pretreated with 40 μM monensin). (g) Scheme depicting the fluorescence intensity quantification strategy for perforin deposits at the lytic synapse of melanoma cell/CTL conjugates. (h) Quantification of percentage of perforin fluorescence intensity on melanoma cell side of the lytic synapse in peptide-pulsed melanoma cells either pretreated or not with 40 μM monensin. Red bars indicate mean values of measured fluorescence. In all, 54 and 55 conjugates (for untreated and monensin-treated cells, respectively) formed by one melanoma cell and one CTL were scored. Data are from three independent experiments. In b,c and e results are expressed as mean±s.e.m. of three independent experiments. Scale bars, 5 μm. Unpaired Student's _t_-test using the GraphPad Prism software was used to determine the statistical significance of differences between the groups. ***P<0.001, **_P_<0.01, NS_P_>0.05.
Similar articles
- The exocytosis of lytic granules is impaired in Vti1b- or Vamp8-deficient CTL leading to a reduced cytotoxic activity following antigen-specific activation.
Dressel R, Elsner L, Novota P, Kanwar N, Fischer von Mollard G. Dressel R, et al. J Immunol. 2010 Jul 15;185(2):1005-14. doi: 10.4049/jimmunol.1000770. Epub 2010 Jun 11. J Immunol. 2010. PMID: 20543108 - Syntaxin 8 is required for efficient lytic granule trafficking in cytotoxic T lymphocytes.
Bhat SS, Friedmann KS, Knörck A, Hoxha C, Leidinger P, Backes C, Meese E, Keller A, Rettig J, Hoth M, Qu B, Schwarz EC. Bhat SS, et al. Biochim Biophys Acta. 2016 Jul;1863(7 Pt A):1653-64. doi: 10.1016/j.bbamcr.2016.04.014. Epub 2016 Apr 17. Biochim Biophys Acta. 2016. PMID: 27094127 - Ultrarapid lytic granule release from CTLs activates Ca2+-dependent synaptic resistance pathways in melanoma cells.
Filali L, Puissegur MP, Cortacero K, Cussat-Blanc S, Khazen R, Van Acker N, Frenois FX, Abreu A, Lamant L, Meyer N, Vergier B, Müller S, McKenzie B, Valitutti S. Filali L, et al. Sci Adv. 2022 Feb 18;8(7):eabk3234. doi: 10.1126/sciadv.abk3234. Epub 2022 Feb 16. Sci Adv. 2022. PMID: 35171665 Free PMC article. - The binding and lysis of target cells by cytotoxic lymphocytes: molecular and cellular aspects.
Berke G. Berke G. Annu Rev Immunol. 1994;12:735-73. doi: 10.1146/annurev.iy.12.040194.003511. Annu Rev Immunol. 1994. PMID: 8011296 Review. - Cystatin F as a regulator of immune cell cytotoxicity.
Kos J, Nanut MP, Prunk M, Sabotič J, Dautović E, Jewett A. Kos J, et al. Cancer Immunol Immunother. 2018 Dec;67(12):1931-1938. doi: 10.1007/s00262-018-2165-5. Epub 2018 May 10. Cancer Immunol Immunother. 2018. PMID: 29748898 Free PMC article. Review.
Cited by
- The human cathelicidin peptide LL-37 inhibits pancreatic cancer growth by suppressing autophagy and reprogramming of the tumor immune microenvironment.
Zhang Z, Chen WQ, Zhang SQ, Bai JX, Lau CL, Sze SC, Yung KK, Ko JK. Zhang Z, et al. Front Pharmacol. 2022 Jul 22;13:906625. doi: 10.3389/fphar.2022.906625. eCollection 2022. Front Pharmacol. 2022. PMID: 35935871 Free PMC article. - Determinants of resistance and response to melanoma therapy.
Robertson BM, Fane ME, Weeraratna AT, Rebecca VW. Robertson BM, et al. Nat Cancer. 2024 Jul;5(7):964-982. doi: 10.1038/s43018-024-00794-1. Epub 2024 Jul 17. Nat Cancer. 2024. PMID: 39020103 Review. - Escaping Death: How Cancer Cells and Infected Cells Resist Cell-Mediated Cytotoxicity.
Tuomela K, Ambrose AR, Davis DM. Tuomela K, et al. Front Immunol. 2022 Mar 23;13:867098. doi: 10.3389/fimmu.2022.867098. eCollection 2022. Front Immunol. 2022. PMID: 35401556 Free PMC article. Review. - Enhancing CAR T function with the engineered secretion of C. perfringens neuraminidase.
Durgin JS, Thokala R, Johnson L, Song E, Leferovich J, Bhoj V, Ghassemi S, Milone M, Binder Z, O'Rourke DM, O'Connor RS. Durgin JS, et al. Mol Ther. 2022 Mar 2;30(3):1201-1214. doi: 10.1016/j.ymthe.2021.11.014. Epub 2021 Nov 20. Mol Ther. 2022. PMID: 34813961 Free PMC article. - BRCA1/2 Mutation Status Impact on Autophagy and Immune Response: Unheralded Target.
Morand S, Stanbery L, Walter A, Rocconi RP, Nemunaitis J. Morand S, et al. JNCI Cancer Spectr. 2020 Aug 24;4(6):pkaa077. doi: 10.1093/jncics/pkaa077. eCollection 2020 Dec. JNCI Cancer Spectr. 2020. PMID: 33409454 Free PMC article.
References
- Chen D. S. & Mellman I. Oncology meets immunology: the cancer-immunity cycle. Immunity 39, 1–10 (2013). - PubMed
- Coulie P. G., Van den Eynde B. J., van der Bruggen P. & Boon T. Tumour antigens recognized by T lymphocytes: at the core of cancer immunotherapy. Nat. Rev. Cancer 14, 135–146 (2014). - PubMed
Publication types
MeSH terms
Substances
LinkOut - more resources
Full Text Sources
Other Literature Sources
Medical
Research Materials
