Persisting Rickettsia typhi Causes Fatal Central Nervous System Inflammation - PubMed (original) (raw)
Persisting Rickettsia typhi Causes Fatal Central Nervous System Inflammation
Anke Osterloh et al. Infect Immun. 2016.
Abstract
Rickettsioses are emerging febrile diseases caused by obligate intracellular bacteria belonging to the family Rickettsiaceae. Rickettsia typhi belongs to the typhus group (TG) of this family and is the causative agent of endemic typhus, a disease that can be fatal. In the present study, we analyzed the course of R. typhi infection in C57BL/6 RAG1(-/-) mice. Although these mice lack adaptive immunity, they developed only mild and temporary symptoms of disease and survived R. typhi infection for a long period of time. To our surprise, 3 to 4 months after infection, C57BL/6 RAG1(-/-) mice suddenly developed lethal neurological disorders. Analysis of these mice at the time of death revealed high bacterial loads, predominantly in the brain. This was accompanied by a massive expansion of microglia and by neuronal cell death. Furthermore, high numbers of infiltrating CD11b(+) macrophages were detectable in the brain. In contrast to the microglia, these cells harbored R. typhi and showed an inflammatory phenotype, as indicated by inducible nitric oxide synthase (iNOS) expression, which was not observed in the periphery. Having shown that R. typhi persists in immunocompromised mice, we finally asked whether the bacteria are also able to persist in resistant C57BL/6 and BALB/c wild-type mice. Indeed, R. typhi could be recultivated from lung, spleen, and brain tissues from both strains even up to 1 year after infection. This is the first report demonstrating persistence and reappearance of R. typhi, mainly restricted to the central nervous system in immunocompromised mice.
Copyright © 2016, American Society for Microbiology. All Rights Reserved.
Figures
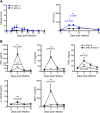
FIG 1
C57BL/6 RAG1−/− mice develop only mild disease and survive the initial phase of R. typhi infection. (A) C57BL/6 RAG1−/− mice were infected with 2 × 10⁶ SFU R. typhi either i.v. (n = 13) or s.c. (n = 16). The course of disease was evaluated by clinical scoring (left, y axis) and quantification of serum GPT levels (right, y axis) at the indicated points in time postinfection (x axis). All mice survived. (B) C57BL/6 wild-type (open symbols, n = 5 to 7) and C57BL/6 RAG1−/− mice (black symbols, n = 5 to 7) were infected with 2 × 10⁶ SFU R. typhi s.c., and plasma cytokine levels (y axes) were quantified with the bead-based LEGENDplex assay at the indicated points in time postinfection (x axes). Serum levels of IFN-γ, IL-6, TNF-α, IL-12p70, and MCP-1 are depicted. Combined results from two independent experiments are shown. Error bars show standard error of the mean (SEM). Statistical analysis was performed with the two-tailed Mann-Whitney U test. Asterisks indicate statistically significant differences compared to naive mice (day 0) (*, P < 0.05; **, P < 0.01).
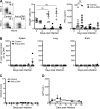
FIG 2
Depletion of NK cells does not affect the course of disease in C57BL/6 RAG1−/− mice upon R. typhi infection. (A) C57BL/6 RAG1−/− mice were treated with anti-asialo GM1 antibody (Anti-a.GM1) or control serum every 5 days starting 1 day prior to infection with 2 × 10⁶ SFU R. typhi s.c. The percentages of NKp46+ NK cells in blood and plasma levels of IFN-γ were assessed by LEGENDplex assay. Representative results for the staining of blood cells from a naive mouse and R. typhi-infected mice that received either control serum or anti-asialo GM1 antibody are shown in the scatter plots (day 3 postinfection). Graphs show statistical analysis of the percentages of NKp46+ cells (y axis) and IFN-γ plasma levels (y axis) at indicated points in time postinfection (x axis). Each symbol represents the result for a single mouse; bars and whiskers show the mean and SEM. Statistical analysis was performed with the Kruskal-Wallis test. Asterisks indicate statistically significant differences (**, P < 0.01; ***, P < 0.001). SSC, side scatter. (B) Bacterial loads were determined by qPCR of prsA in spleen, lung, and brain tissues. R. typhi_prsA_ copy numbers (y axis) at indicated points in time (x axis) are depicted. Each symbol represents the result for a single mouse. (C and D) The course of disease was evaluated by clinical scoring (n = 5 for each group) (y axis) (C) and quantification of GPT in the serum (n = 3 for each group) (y axis) (D) at the indicated points in time (x axes). Error bars show SEM.
FIG 3
R. typhi-infected C57BL/6 RAG1−/− mice develop lethal neurological disorders and bacteria are present in the brain 3 to 4 months postinfection. C57BL/6 RAG1−/− mice were infected with 2 × 10⁶ SFU R. typhi either i.v. (n = 10) or s.c. (n = 10). Control mice received PBS i.v. instead (n = 10). Beyond day 80, R. typhi-infected mice developed neurological disorders, often beginning with stroke-like symptoms and resulting in lethal paralysis. (A) Photographs of two representative mice in the early phase (left) and late phase (right) of disease are shown. (B) The percentage of survival (y axis) was assessed for each group at the indicated points in time postinfection (x axis). (C) At the time of death, bacterial loads (y axis) of R. typhi-infected C57BL/6 RAG1−/− mice that had been infected either i.v. or s.c. were assessed in the indicated organs by qPCR (x axis). SC, spinal cord. Each symbol represents the result for a single mouse. Statistical analysis was performed with the Kruskal-Wallis test. Bars and whiskers show the mean and SEM. Asterisks indicate statistically significant differences (**, P < 0.01). (D) Brains from two mice that were infected with R. typhi s.c. were isolated at the time of death and lysed. Lysates were used to inoculate L929 cells. Cells were incubated for 5 days, and supernatants of these cultures were then used to inoculate L929 cells seeded into chamber slides. Three days later, cells were stained for R. typhi with serum from a patient, anti-human IgG–FITC, and FITC–Alexa Fluor 488-conjugated antibody (green). Nuclei were stained with DAPI (blue).
FIG 4
Accumulation of IBA1+ cells in the brains of C57BL/6 RAG1−/− mice. (A and B) Sagittal brain sections taken from a PBS-treated C57BL/6 RAG1−/− control mouse (A) and a C57BL/6 RAG1−/− mouse previously infected with 2 × 10⁶ SFU R. typhi (B) at the time of death were stained for IBA1, a marker for microglia and macrophages, as well as iNOS and caspase 3, as indicated. Overview pictures were taken at 2-fold magnification. The three panels at the top right show IBA1, iNOS, and caspase 3 staining of the brain of the control mouse at 20-fold magnification. (B) The numbered boxed areas in the brain sections of the R. typhi-infected mouse were analyzed by further staining, images of which are shown in Fig. 5 and discussed in its legend.
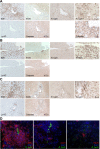
FIG 5
Detection of R. typhi particles and IBA1+, Ly-6G+, CD31+, NeuN+, apoptotic, and iNOS-expressing cells. (A to C) The three numbered boxed areas in the brain sections of the R. typhi-infected mouse shown in Fig. 4 were further stained for IBA1, iNOS, and caspase 3, as well as for R. typhi, employing human patient serum. Stained serial sections are shown for area 1 (A), area 2 (B), and area 3 (C) of Fig. 4B. (D) R. typhi was further detected in brain sections by immunofluorescent staining with serum from a human patient (green). In addition, sections were stained for IBA1, CD31 (endothelial cells), or NeuN (neurons) (red). Nuclei were stained with DAPI (blue).
FIG 6
Expansion of microglia and infiltration of R. typhi-harboring inflammatory macrophages. (A) C57BL/6 RAG1−/− mice were infected with 2 × 10⁶ SFU R. typhi s.c. At the time of death, brain cells were stained for CD45 (x axis) and gated on CD45low (blue gate) and infiltrating CD45high cells (black gate) for further analysis. Representative results of staining for CD45 on brain cells from a control C57BL/6 RAG1−/− mouse that received PBS and an R. typhi-infected C57BL/6 RAG1−/− mouse are depicted in the scatter plots. (B) Cells were further stained for CD11b (y axis), R. typhi (top, x axis), and iNOS (bottom, x axis). Representative results for brain cells gated on the CD45low and CD45high population from a control and an R. typhi-infected C57BL/6 RAG1−/− mouse are shown. (C) CD45low CD11b+ cells were defined as microglia and CD45high CD11b+ as infiltrating macrophages (MΦ). Total numbers (y axis) of microglia and MΦ were assessed in the brains of control and R. typhi-infected C57BL/6 RAG1−/− mice, as indicated on the x axis (left). The percentages of R. typhi+ cells (middle, y axis) and iNOS+ cells (right, y axis) were determined among both populations, as indicated on the x axis. Each symbol represents the result for a single mouse. Combined results from two independent experiments are shown; bars and whiskers show the mean and SEM. Statistical analysis was performed with the Kruskal-Wallis test. Asterisks indicate statistically significant differences (**, P < 0.01; ***, P < 0.001).
FIG 7
Inflammatory macrophages are not detectable in the periphery. (A) Cells from the spinal cords of the same control and R. typhi-infected C57BL/6 RAG1−/− mice described in the legend to Fig. 6, taken at the time of death, were gated on CD45+ cells and further stained for CD11b, R. typhi, and iNOS as indicated (scatter plots). The graphs show the statistical analysis of these measurements. Each symbol represents the result for a single mouse; bars and whiskers show the mean and SEM. (B) In a similar manner, blood and spleen cells (as indicated on the right) from the same mice were stained for CD11b, R. typhi (left), and iNOS (iNOS). Representative results of staining for one mouse are depicted.
FIG 8
Detection of R. typhi, IBA1+, CD31+, and iNOS-expressing cells in the spinal cord. (A and B) Sections of spinal cords from control mice that received PBS (A) and R. typhi-infected C57BL/6 RAG1−/− mice (B) at the time of death were stained for IBA1, iNOS, and R. typhi. For immunofluorescent detection, sections of spinal cords from R. typhi-infected C57BL/6 RAG1−/− mice were stained for either IBA1 or CD31 (red), in addition to R. typhi (green) and DAPI (blue). Representative spinal cord sections from a group of five mice are depicted. Arrows indicate accumulating IBA1+ cells in association with neurons.
FIG 9
Neuronal cell loss in the spinal cords of R. typhi-infected C57BL/6 RAG1−/− mice. Sections of the spinal cords from control mice that received PBS and R. typhi-infected C57BL/6 RAG1−/− mice at the time of death were stained for NeuN. Representative sections of the spinal cords from a control and an R. typhi-infected mouse are shown. NeuN+ neurons were counted with ImageJ software, creating binary pictures as shown below. The graph shows statistical analysis of NeuN+ neurons per mm2 (y axis) in the ventral and dorsal horns of the spinal cord. Each symbol represents the result for a single mouse; bars and whiskers show mean and SEM. Statistical analysis was performed with the Mann-Whitney U test. Asterisks indicate statistically significant differences (*, P < 0.05).
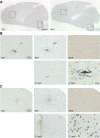
FIG 10
Cellular infiltrates and detection of R. typhi in the brains of C57BL/6 wild-type mice in the initial phase of infection. (A) C57BL/6 wild-type mice were infected with 2 × 10⁶ SFU R. typhi i.v. Brain sections were prepared on day 8 postinfection and stained for IBA1 and CD3, as indicated. (B and C) The numbered boxed areas in panel A were further analyzed by staining of serial sections for IBA1, CD3, iNOS, and R. typhi, employing anti-R. typhi antibody (clone BNI52). (B) Area 1; (C) area 2.
FIG 11
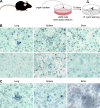
R. typhi persists in the lungs, spleens, and brains of resistant C57BL/6 and BALB/c wild-type mice. (A) Persistence of R. typhi was analyzed by immunofocus assay as schematically depicted. Organs from infected mice 6 to 12 months postinfection were smashed and cultured with irradiated L929 cells in semisolid medium. R. typhi was detected 8 to 10 days later by staining with anti-R. typhi antibody (clone BNI52). (B) Top, representative spots of R. typhi-containing cells after culture of L929 cells with lysates from lung, spleen, and brain from a C57BL/6 mouse 1 year after s.c. infection with 2 × 10⁶ SFU R. typhi are shown. Bottom, organs from a naive mouse were used as a control. (C) In the same manner, organs taken from a BALB/c mouse 6 months after s.c. infection with 2 × 10⁶ SFU R. typhi were analyzed. The results are representative for two mice for each experiment.
Similar articles
- GFPuv-Expressing Recombinant Rickettsia typhi: a Useful Tool for the Study of Pathogenesis and CD8+ T Cell Immunology in R. typhi Infection.
Hauptmann M, Burkhardt N, Munderloh U, Kuehl S, Richardt U, Krasemann S, Hartmann K, Krech T, Fleischer B, Keller C, Osterloh A. Hauptmann M, et al. Infect Immun. 2017 May 23;85(6):e00156-17. doi: 10.1128/IAI.00156-17. Print 2017 Jun. Infect Immun. 2017. PMID: 28289147 Free PMC article. - Liver Necrosis and Lethal Systemic Inflammation in a Murine Model of Rickettsia typhi Infection: Role of Neutrophils, Macrophages and NK Cells.
Papp S, Moderzynski K, Rauch J, Heine L, Kuehl S, Richardt U, Mueller H, Fleischer B, Osterloh A. Papp S, et al. PLoS Negl Trop Dis. 2016 Aug 22;10(8):e0004935. doi: 10.1371/journal.pntd.0004935. eCollection 2016 Aug. PLoS Negl Trop Dis. 2016. PMID: 27548618 Free PMC article. - CD4+ T Cells Are as Protective as CD8+ T Cells against Rickettsia typhi Infection by Activating Macrophage Bactericidal Activity.
Moderzynski K, Papp S, Rauch J, Heine L, Kuehl S, Richardt U, Fleischer B, Osterloh A. Moderzynski K, et al. PLoS Negl Trop Dis. 2016 Nov 22;10(11):e0005089. doi: 10.1371/journal.pntd.0005089. eCollection 2016 Nov. PLoS Negl Trop Dis. 2016. PMID: 27875529 Free PMC article. - Murine Typhus with Marked Thrombocytopenia in a Child in Northern Greece and Literature Review.
Sarikloglou E, Goula A, Sidiropoulos C, Tsolia M, Papa A. Sarikloglou E, et al. Jpn J Infect Dis. 2018 Sep 21;71(5):368-369. doi: 10.7883/yoken.JJID.2018.091. Epub 2018 May 31. Jpn J Infect Dis. 2018. PMID: 29848847 Review. - Flea-borne rickettsioses: ecologic considerations.
Azad AF, Radulovic S, Higgins JA, Noden BH, Troyer JM. Azad AF, et al. Emerg Infect Dis. 1997 Jul-Sep;3(3):319-27. doi: 10.3201/eid0303.970308. Emerg Infect Dis. 1997. PMID: 9284376 Free PMC article. Review.
Cited by
- GFPuv-Expressing Recombinant Rickettsia typhi: a Useful Tool for the Study of Pathogenesis and CD8+ T Cell Immunology in R. typhi Infection.
Hauptmann M, Burkhardt N, Munderloh U, Kuehl S, Richardt U, Krasemann S, Hartmann K, Krech T, Fleischer B, Keller C, Osterloh A. Hauptmann M, et al. Infect Immun. 2017 May 23;85(6):e00156-17. doi: 10.1128/IAI.00156-17. Print 2017 Jun. Infect Immun. 2017. PMID: 28289147 Free PMC article. - Cytotoxic effector functions of T cells are not required for protective immunity against fatal Rickettsia typhi infection in a murine model of infection: Role of TH1 and TH17 cytokines in protection and pathology.
Moderzynski K, Heine L, Rauch J, Papp S, Kuehl S, Richardt U, Fleischer B, Osterloh A. Moderzynski K, et al. PLoS Negl Trop Dis. 2017 Feb 21;11(2):e0005404. doi: 10.1371/journal.pntd.0005404. eCollection 2017 Feb. PLoS Negl Trop Dis. 2017. PMID: 28222146 Free PMC article. - GroEL is an immunodominant surface-exposed antigen of Rickettsia typhi.
Rauch J, Barton J, Kwiatkowski M, Wunderlich M, Steffen P, Moderzynski K, Papp S, Höhn K, Schwanke H, Witt S, Richardt U, Mehlhoop U, Schlüter H, Pianka V, Fleischer B, Tappe D, Osterloh A. Rauch J, et al. PLoS One. 2021 Jun 10;16(6):e0253084. doi: 10.1371/journal.pone.0253084. eCollection 2021. PLoS One. 2021. PMID: 34111210 Free PMC article. - Neuroinflammation associated with scrub typhus and spotted fever group rickettsioses.
Fisher J, Card G, Soong L. Fisher J, et al. PLoS Negl Trop Dis. 2020 Oct 22;14(10):e0008675. doi: 10.1371/journal.pntd.0008675. eCollection 2020 Oct. PLoS Negl Trop Dis. 2020. PMID: 33091013 Free PMC article. Review. - Association of scrub typhus with incidence of dementia: a nationwide population-based cohort study in Korea.
Kim J, Seok H, Jeon JH, Choi WS, Seo GH, Park DW. Kim J, et al. BMC Infect Dis. 2023 Mar 1;23(1):127. doi: 10.1186/s12879-023-08107-0. BMC Infect Dis. 2023. PMID: 36859244 Free PMC article.
References
- Walker D, Raoult D, Dumler JS, Marrie T (ed). 2008. Rickettsial diseases. McGraw-Hill, New York, NY.
MeSH terms
Substances
LinkOut - more resources
Full Text Sources
Other Literature Sources
Research Materials
Miscellaneous
