Increased toll-like receptors and p53 levels regulate apoptosis and angiogenesis in non-muscle invasive bladder cancer: mechanism of action of P-MAPA biological response modifier - PubMed (original) (raw)
Increased toll-like receptors and p53 levels regulate apoptosis and angiogenesis in non-muscle invasive bladder cancer: mechanism of action of P-MAPA biological response modifier
Patrick Vianna Garcia et al. BMC Cancer. 2016.
Abstract
Background: The new modalities for treating patients with non-muscle invasive bladder cancer (NMIBC) for whom BCG (Bacillus Calmette-Guerin) has failed or is contraindicated are recently increasing due to the development of new drugs. Although agents like mitomycin C and BCG are routinely used, there is a need for more potent and/or less-toxic agents. In this scenario, a new perspective is represented by P-MAPA (Protein Aggregate Magnesium-Ammonium Phospholinoleate-Palmitoleate Anhydride), developed by Farmabrasilis (non-profit research network). This study detailed and characterized the mechanisms of action of P-MAPA based on activation of mediators of Toll-like Receptors (TLRs) 2 and 4 signaling pathways and p53 in regulating angiogenesis and apoptosis in an animal model of NMIBC, as well as, compared these mechanisms with BCG treatment.
Results: Our results demonstrated the activation of the immune system by BCG (MyD88-dependent pathway) resulted in increased inflammatory cytokines. However, P-MAPA intravesical immunotherapy led to distinct activation of TLRs 2 and 4-mediated innate immune system, resulting in increased interferons signaling pathway (TRIF-dependent pathway), which was more effective in the NMIBC treatment. Interferon signaling pathway activation induced by P-MAPA led to increase of iNOS protein levels, resulting in apoptosis and histopathological recovery. Additionally, P-MAPA immunotherapy increased wild-type p53 protein levels. The increased wild-type p53 protein levels were fundamental to NO-induced apoptosis and the up-regulation of BAX. Furthermore, interferon signaling pathway induction and increased p53 protein levels by P-MAPA led to important antitumor effects, not only suppressing abnormal cell proliferation, but also by preventing continuous expansion of tumor mass through suppression of angiogenesis, which was characterized by decreased VEGF and increased endostatin protein levels.
Conclusions: Thus, P-MAPA immunotherapy could be considered an important therapeutic strategy for NMIBC, as well as, opens a new perspective for treatment of patients that are refractory or resistant to BCG intravesical therapy.
Keywords: Angiogenesis; Bacillus Calmette–Guerin; Bladder Cancer; Immunotherapy; P-MAPA; Toll-like Receptor; p53.
Figures
Fig. 1
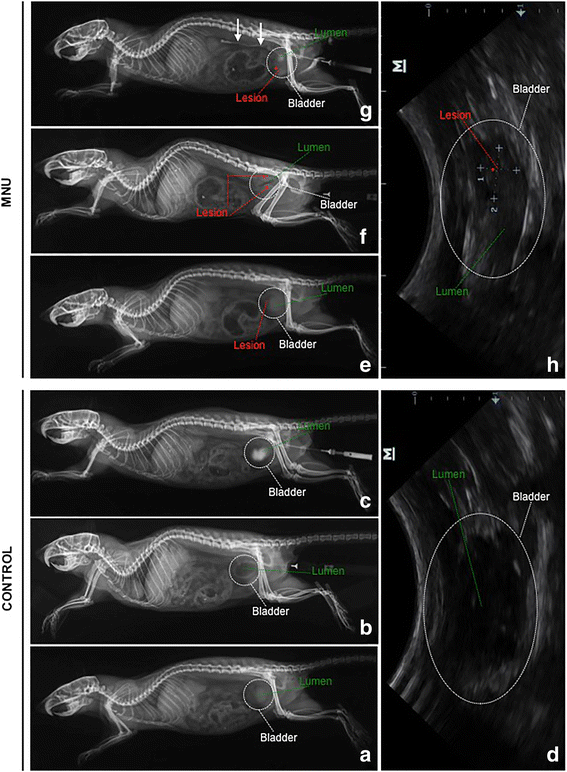
a–h Retrograde cystography and ultrasonography from CONTROL (a, b, c, d) and MNU (e, f, g, h) groups. Cystography without contrast (a), negative (b) and positive (c) contrast cystographies, and ultrasounds (d) showed no mass infiltrating the bladder walls, as well as, there were no vesicoureteral reflux and neither bladder filling defect. Cystography without contrast (e) and negative contrast cystography (f) showed a mass infiltrating the ventral, dorsal and cranial bladder walls (asterisks). Positive contrast cystography (g) demonstrated several bladder filling defects and vesicoureteral reflux unilateral (arrows). Ultrasound showed tumor (asterisk) infiltrating the bladder walls, tumor size: 1–3,9 mm, 2–5,5 mm
Fig. 2
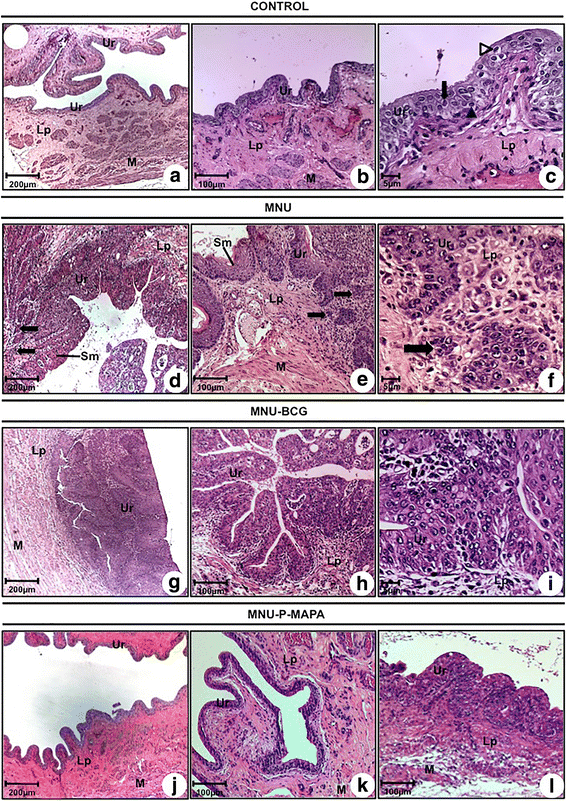
a–l Photomicrographs of the urinary bladder from CONTROL (a, b, c), MNU (d, e, f), MNU-BCG (g, h, i) and MNU-P-MAPA (j, k, l) groups. a, b, c, j and k Normal urothelium composed of 2–3 layers: a basal cell layer (arrowhead), an intermediate cell layer (arrow), and a superficial or apical layer composed of umbrella cells (open arrowhead). d, e and f pT1: neoplastic cells arranged in small groups (arrows) invading the lamina propria; keratinizing squamous metaplasia (Sm). g, h and i pTa characterized by fibrovascular stalk and frequent papillary branching with increased cellular size. l Papillary hyperplasia. a–l Lp lamina propria, M muscular layer, Ur urothelium
Fig. 3
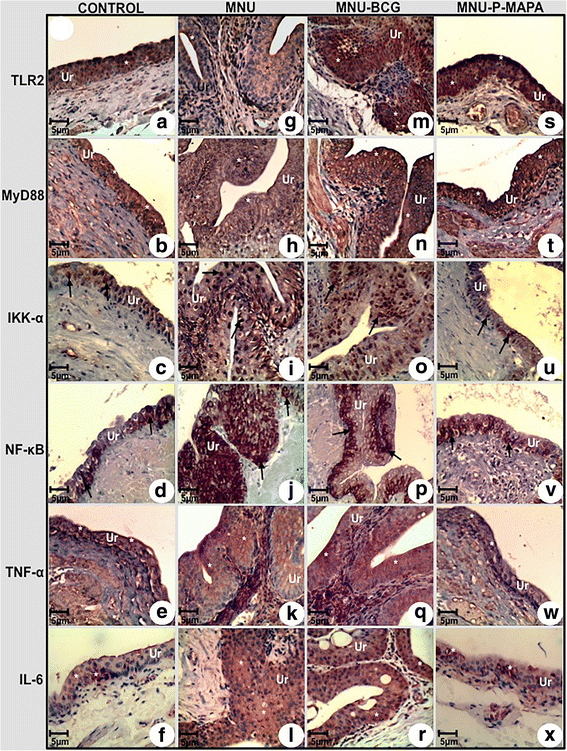
Immunolabelled antigen intensities of the urinary bladder from the CONTROL (a, b, c, d, e, f), MNU (g, h, i, j, k, l), MNU-BCG (m, n, o, p, q, r), and MNU-P-MAPA (s, t, u, v, w, x) groups. TLR2 immunoreactivities (asterisks) were moderate in the urothelium from the CONTROL (a) group, weak in the MNU (g) group and intense in the MNU-BCG (m) and MNU-P-MAPA (s) groups. MyD88 immunoreactivities (asterisks) were moderate in the urothelium from the CONTROL (b) group, weak in the MNU (h) group and intense in the MNU-BCG (n) and MNU-P-MAPA (t) groups. IKK-α immunoreactivities (arrows) were weak in the urothelium from the CONTROL (c) group, moderate in the MNU (i) group, intense in the MNU-BCG group (o) and weak in the MNU-P-MAPA (u) group. NF-kB immunoreactivities (arrows) were weak in the cytoplasm of the urothelial cells from the CONTROL (d) group, intense in the nucleus and cytoplasm of the urothelial cells from the MNU (j) group, moderate in the nucleus and cytoplasm of the urothelial cells from the MNU-BCG (p) group and weak in the cytoplasm of the urothelial cells from the MNU-P-MAPA (v) group. TNF-α immunoreactivities (asterisks) were weak in the urothelium from the CONTROL (e) group, intense in the MNU (k) and MNU-BCG (q) groups and weak in the MNU-P-MAPA (w) group. IL-6 immunoreactivities (asterisks) were weak in the urothelium from the CONTROL (f) group, intense in the MNU (l) and MNU-BCG (r) groups and weak in the MNU-P-MAPA (x) group. a–x Ur urothelium
Fig. 4
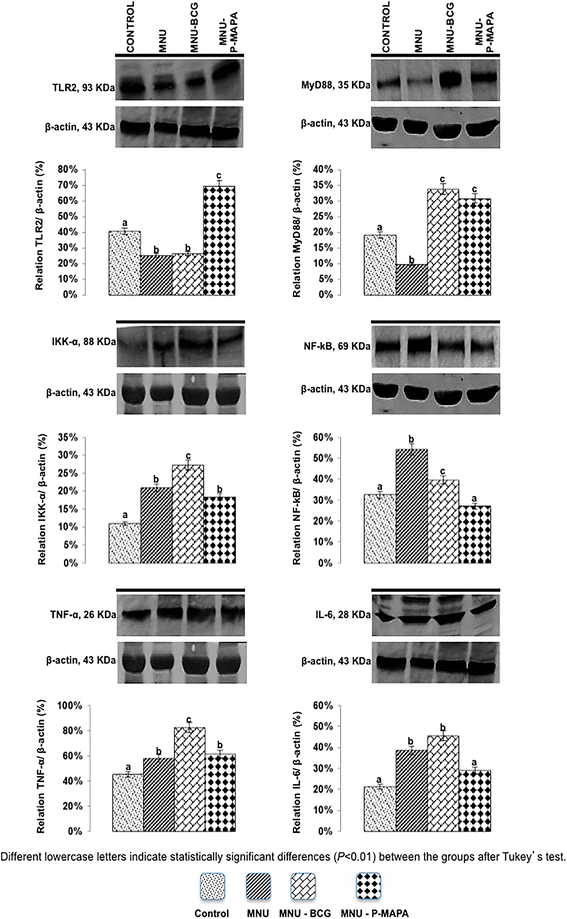
Representative Western Blotting and semiquantitative determination for TLR2, MyD88, IKK-α, NF-kB, TNF-α and IL-6 protein levels. Samples of urinary bladder were pooled from five animals per group for each repetition (duplicate) and used for semi-quantitative densitometry (IOD – Integrated Optical Density) analysis of the TLR2, MyD88, IKK-α, NF-kB, TNF-α and IL-6 levels following normalization to the β-actin. All data were expressed as the mean ± standard deviation. Different lowercase letters (a, b, c, d) indicate significant differences (p <0.01) between the groups after Tukey’s test
Fig. 5
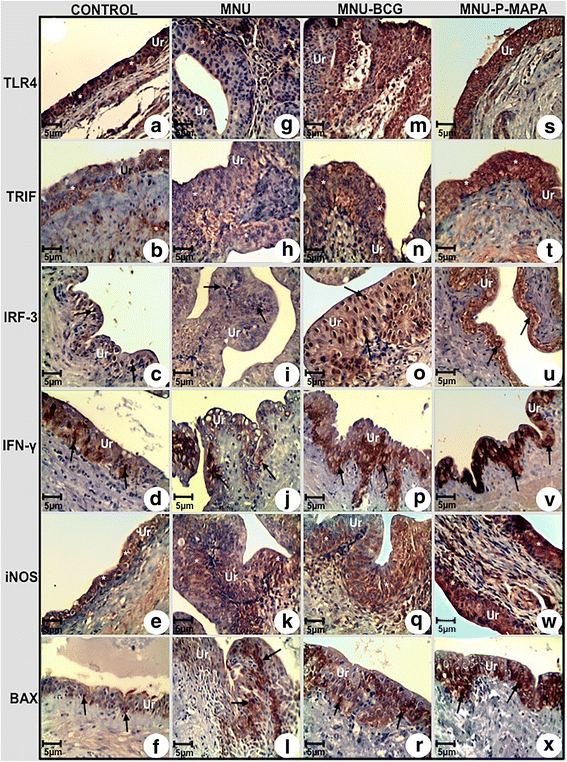
Immunolabelled antigen intensities of the urinary bladder from the CONTROL (a, b, c, d, e, f), MNU (g, h, i, j, k, l), MNU-BCG (m, n, o, p, q, r), and MNU-P-MAPA (s, t, u, v, w, x) groups. TLR4 immunoreactivities (asterisks) were moderate in the urothelium from the CONTROL group (a), weak in the MNU group (g) and intense in the MNU-BCG (m) and MNU-P-MAPA (s) groups. TRIF immunoreactivities (asterisks) were weak in the urothelium from the CONTROL (b) and MNU (h) groups, moderate in the MNU-BCG (n) group and intense in the MNU-P-MAPA (t) group. IRF-3 immunoreactivities (arrows) were weak in the urothelium from the CONTROL (c) and MNU (i) groups, moderate in the MNU-BCG (o) group and intense in the MNU-P-MAPA (u) group. IFN-γ immunoreactivities (arrows) were weak in the urothelium from the CONTROL (d) and MNU (j) groups, moderate in the MNU-BCG (p) group and intense in the MNU-P-MAPA (v) group. iNOS immunoreactivities (asterisks) were weak in the urothelium from the CONTROL (e) and MNU (k) groups, moderate in the MNU-BCG (q) group and intense in the MNU-P-MAPA (w) group. BAX immunoreactivities (asterisks) were weak in the urothelium from the CONTROL (f) group, moderate in the MNU (l) and MNU-BCG (r) groups and intense in the MNU-P-MAPA (x) group. a–x Ur urothelium
Fig. 6
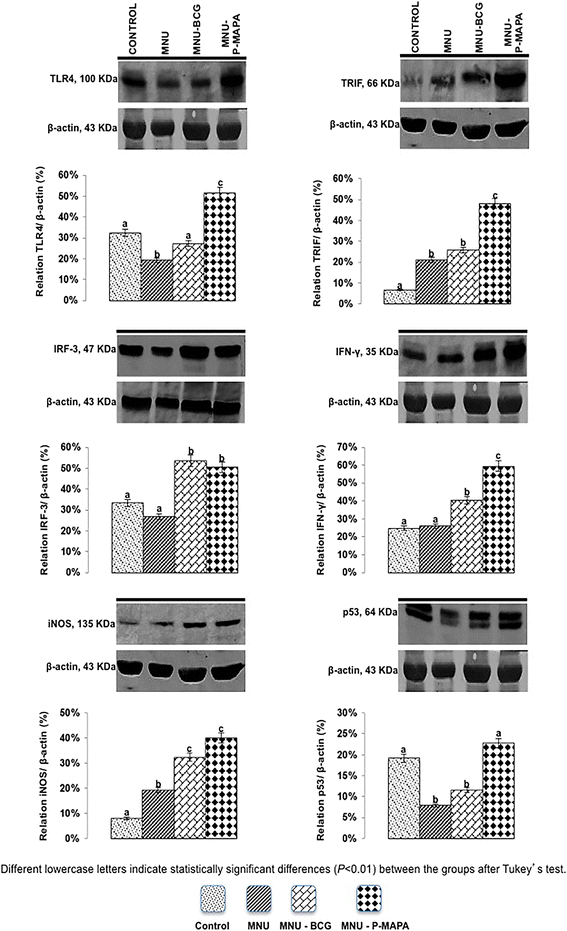
Representative Western Blotting and semiquantitative determination for TLR4, TRIF, IRF-3, IFN-γ, iNOS, and p53 protein levels. Samples of urinary bladder were pooled from five animals per group for each repetition (duplicate) and used for semi-quantitative densitometry (IOD – Integrated Optical Density) analysis of the TLR4, TRIF, IRF-3, IFN-γ, iNOS, and p53 levels following normalization to the β-actin. All data were expressed as the mean ± standard deviation. Different lowercase letters (a, b, c, d) indicate significant differences (p <0.01) between the groups after Tukey’s test
Fig. 7
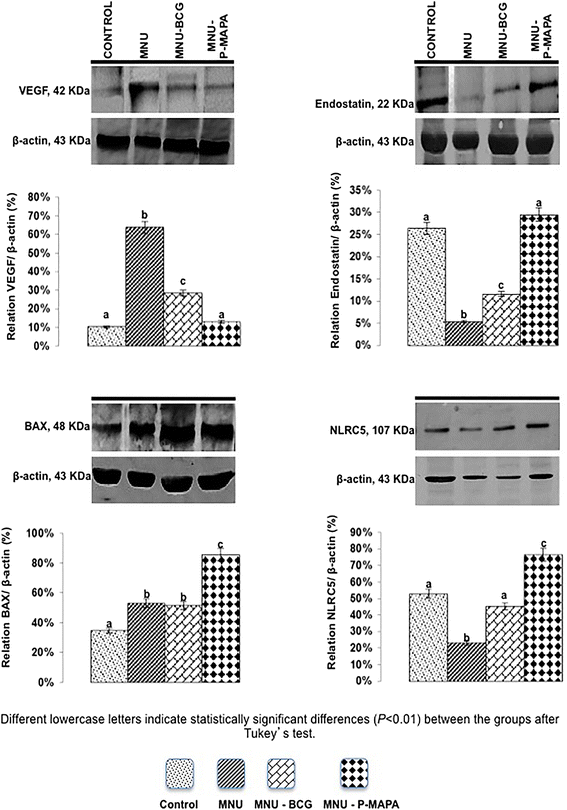
Representative Western Blotting and semiquantitative determination for VEGF, Endostatin, BAX and NLRC5 protein levels. Samples of urinary bladder were pooled from five animals per group for each repetition (duplicate) and used for semi-quantitative densitometry (IOD – Integrated Optical Density) analysis of the VEGF, Endostatin, BAX and NLRC5 levels following normalization to the β-actin. All data were expressed as the mean ± standard deviation. Different lowercase letters (a, b, c, d) indicate significant differences (p <0.01) between the groups after Tukey’s test
Fig. 8
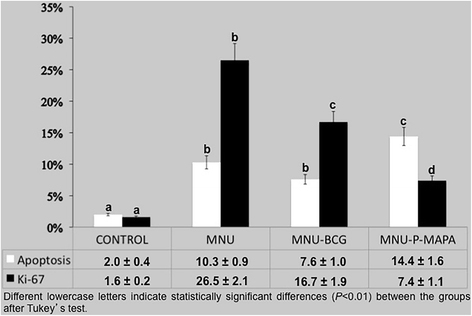
Percentage of Proliferative (Ki-67) and Apoptotic Indexes
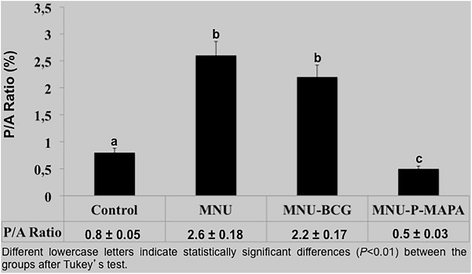
Fig. 9
Proliferation/Apoptotic Ratio (P/A)
Similar articles
- Impact of intravesical instillation of a novel biological response modifier (P-MAPA) on progress of non-muscle invasive bladder cancer treatment in a rat model.
Fávaro WJ, Socca EAR, Böckelmann PK, Reis IB, Garcia PV, Durán N. Fávaro WJ, et al. Med Oncol. 2022 Jan 4;39(2):24. doi: 10.1007/s12032-021-01612-9. Med Oncol. 2022. PMID: 34982270 - Alterations in ubiquitin ligase Siah-2 and its corepressor N-CoR after P-MAPA immunotherapy and anti-androgen therapy: new therapeutic opportunities for non-muscle invasive bladder cancer.
Garcia PV, Apolinário LM, Böckelmann PK, da Silva Nunes I, Duran N, Fávaro WJ. Garcia PV, et al. Int J Clin Exp Pathol. 2015 May 1;8(5):4427-43. eCollection 2015. Int J Clin Exp Pathol. 2015. PMID: 26191134 Free PMC article. - Potential therapeutic strategies for non - muscle invasive bladder cancer based on association of intravesical immunotherapy with p - mapa and systemic administration of cisplatin and doxorubicin.
Dias QC, Nunes ID, Garcia PV, Favaro WJ. Dias QC, et al. Int Braz J Urol. 2016 Sep-Oct;42(5):942-954. doi: 10.1590/S1677-5538.IBJU.2015.0381. Int Braz J Urol. 2016. PMID: 24893914 Free PMC article. - Determining optimal maintenance schedules for adjuvant intravesical bacillus Calmette-Guerin immunotherapy in non-muscle-invasive bladder cancer: a systematic review and network meta-analysis.
Huang Z, Liu H, Wang Y, Zhang C, Xu T. Huang Z, et al. Curr Med Res Opin. 2017 Aug;33(8):1379-1387. doi: 10.1080/03007995.2017.1326889. Epub 2017 Jun 6. Curr Med Res Opin. 2017. PMID: 28471272 Review. - Interferon alfa in the treatment paradigm for non-muscle-invasive bladder cancer.
Lamm D, Brausi M, O'Donnell MA, Witjes JA. Lamm D, et al. Urol Oncol. 2014 Jan;32(1):35.e21-30. doi: 10.1016/j.urolonc.2013.02.010. Epub 2013 Apr 28. Urol Oncol. 2014. PMID: 23628309 Review.
Cited by
- P-MAPA and Interleukin-12 Reduce Cell Migration/Invasion and Attenuate the Toll-Like Receptor-Mediated Inflammatory Response in Ovarian Cancer SKOV-3 Cells: A Preliminary Study.
Lupi LA, Delella FK, Cucielo MS, Romagnoli GG, Kaneno R, Nunes IDS, Domeniconi RF, Martinez M, Martinez FE, Fávaro WJ, Chuffa LGA. Lupi LA, et al. Molecules. 2019 Dec 18;25(1):5. doi: 10.3390/molecules25010005. Molecules. 2019. PMID: 31861351 Free PMC article. - Recent clinical trends in Toll-like receptor targeting therapeutics.
Anwar MA, Shah M, Kim J, Choi S. Anwar MA, et al. Med Res Rev. 2019 May;39(3):1053-1090. doi: 10.1002/med.21553. Epub 2018 Nov 18. Med Res Rev. 2019. PMID: 30450666 Free PMC article. Review. - Molecular docking analysis of p53 with Toll-like receptors.
Alam MJ, Bardakci F, Anjum S, Mir SR, Ahmad I, Saeed M. Alam MJ, et al. Bioinformation. 2021 Sep 30;17(9):784-789. doi: 10.6026/97320630017784. eCollection 2021. Bioinformation. 2021. PMID: 35539888 Free PMC article. - Identification and Verification of SLC27A1, PTBP1 and EIF5A With Significantly Altered Expression in Aggressive Pituitary Adenomas.
Cheng J, Sun R, Nie D, Li B, Gui SB, Li CZ, Zhang YZ, Zhao P. Cheng J, et al. Front Surg. 2022 Jun 21;9:923143. doi: 10.3389/fsurg.2022.923143. eCollection 2022. Front Surg. 2022. PMID: 35836612 Free PMC article. - Calcium supplementation shows a hepatoprotective effect against high-fat diet by regulating oxidative-induced inflammatory response and lipogenesis activity in male rats.
Das S, Choudhuri D. Das S, et al. J Tradit Complement Med. 2019 Jun 4;10(5):511-519. doi: 10.1016/j.jtcme.2019.06.002. eCollection 2020 Sep. J Tradit Complement Med. 2019. PMID: 32953568 Free PMC article.
References
- American Cancer Society. Bladder Cancer Statistics. 2015. http://www.cancer.org/cancer/bladdercancer/detailedguide/bladder-cancer-.... Accessed at 10 Dec 2015.
- Epstein JI, Amin MB, Reuter VR, Mostofi FK. The World Health Organization/International Society of Urological Pathology consensus classification of urothelial (transitional cell) neoplasms of the urinary bladder. Bladder Consensus Conference Committee. Am J Surg Pathol. 1998;22:1435–48. doi: 10.1097/00000478-199812000-00001. - DOI - PubMed
Publication types
MeSH terms
Substances
LinkOut - more resources
Full Text Sources
Other Literature Sources
Medical
Research Materials
Miscellaneous
