Salmonella Typhimurium disrupts Sirt1/AMPK checkpoint control of mTOR to impair autophagy - PubMed (original) (raw)
Salmonella Typhimurium disrupts Sirt1/AMPK checkpoint control of mTOR to impair autophagy
Raja Ganesan et al. PLoS Pathog. 2017.
Abstract
During intracellular infections, autophagy significantly contributes to the elimination of pathogens, regulation of pro-inflammatory signaling, secretion of immune mediators and in coordinating the adaptive immune system. Intracellular pathogens such as S. Typhimurium have evolved mechanisms to circumvent autophagy. However, the regulatory mechanisms targeted by S. Typhimurium to modulate autophagy have not been fully resolved. Here we report that cytosolic energy loss during S. Typhimurium infection triggers transient activation of AMPK, an important checkpoint of mTOR activity and autophagy. The activation of AMPK is regulated by LKB1 in a cytosolic complex containing Sirt1 and LKB1, where Sirt1 is required for deacetylation and subsequent activation of LKB1. S. Typhimurium infection targets Sirt1, LKB1 and AMPK to lysosomes for rapid degradation resulting in the disruption of the AMPK-mediated regulation of mTOR and autophagy. The degradation of cytosolic Sirt1/LKB1/AMPK complex was not observed with two mutant strains of S. Typhimurium, ΔssrB and ΔssaV, both compromising the pathogenicity island 2 (SPI2). The results highlight virulence factor-dependent degradation of host cell proteins as a previously unrecognized strategy of S. Typhimurium to evade autophagy.
Conflict of interest statement
The authors have declared that no competing interests exist.
Figures
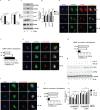
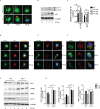
Fig 1. S. Typhimurium infection results in energy loss and transient activation of AMPK.
(A) ATP levels in BMDMs upon S. Typhimurium was analyzed by mass spectrometry and the mass peak intensity is depicted in the graph as mean ± SEM, ***p≤0.001 (n = 6). (B) Intracellular NAD+ and NADH levels form uninfected and S. Typhimurium-infected BMDMs were measured using NAD+/NADH assay kit. Bar graphs are expressed as mean ± SEM, ***p≤0.001 (n = 3). (C) Immunoblot analysis of AMPK, ACC and LKB1 expression upon S. Typhimurium infection in BMDMs cells. (D) Mean densitometric analysis of immunoblots is shown. Data are representative of 3 independent experiments. Bar graphs are expressed as mean ± SEM, ***p≤0.001 and **p≤0.01. (E) Confocal image showing AMPK-LKB1 (n = 4). (F) Pearson’s correlation coefficient of AMPK with LKB1 analyzed from 50 regions of interest (ROI). (G) AMPK-LysoTracker Red co-localization (n = 4). (H) Pearson’s correlation coefficient of AMPK with LysoTracker Red analyzed from 50 ROIs. (I) LKB1-LysoTracker Red co-localization in BMDMs upon S. Typhimurium infection n = 3. (J) Pearson’s correlation coefficient of LKB1-LAMP1 co-localization calculated by measuring minimum of 50 ROI using olympus fluoview fv1000 software. Scale bar = 10μm for microscopy images. (K) Total AMPK and LKB1 expression upon S. Typhimurium infection in BMDMs treated with concanamycinA (concA) or MG132. Western blots are representative of three experiments. (L) Mean densitometric data of protein expression were analyzed using NIH Image J software. Bar graphs are expressed as mean ± SEM, ns non-significant, ***p≤0.001 and **p≤0.01.
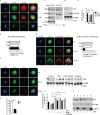
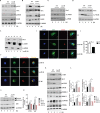
Fig 2. Sirt1 is degraded upon S. Typhimurium infection.
(A) Confocal image of Sirt1 and LKB1 in BMDMs upon S. Typhimurium infection (n = 3). (B) Pearson’s correlation coefficient of Sirt1 with LKB1 calculated by measuring 42 ROIs. (C) Sirt1 was immunoprecipitated (IP) from uninfected and S. Typhimurium-infected BMDMs and the precipitated samples were immunoblotted (IB) for LKB1, AMPK and Sirt1 (n = 2). (D) Immunoblot of Sirt1, acetylated NFκB and GAPDH in BMDMs upon S. Typhimurium infection. Data shown are representative of 6 independent experiments. (E) Densitometric analysis of immunoblots. Bar graphs are expressed as mean ± SEM, ***p≤0.001 and **p≤0.01. (F) Immunofluorescence image of BMDMs stained for Sirt1 and S. Typhimurium (n = 4). (G) Quantitation of Sirt1-ST co-localization with SCVs. 100 SCVs were counted and expressed as percentage co-localization. Bar graphs are expressed as mean ± SEM, ***p≤0.001. (H) Sirt1-Lysotracker red co-localization in BMDMs upon S. Typhimurium infection (n = 4). (I) Pearson’s correlation coefficient of Sirt1 with Lysotracker red calculated by measuring minimum of 50 ROI. (J) Sirt1 expression upon S. Typhimurium infection in BMDMs treated with bafilomycinA (BafA), E64D, pepstatin A and calpeptin. (K) Sirt1 expression levels are quantified by densitometric analysis. Data shown are representative of 3 independent experiments. Bar graphs are expressed as mean ± SEM, ***p≤0.001 and **p≤0.01. (L) Sirt1 expression in nuclear (N) and cytoplasmic (C) fractions of BMDMs infected with S. Typhimurium. LaminB and GAPDH were used as housekeeping controls for nuclear and cytoplasmic fractions respectively (n = 2). Scale bar = 10μm for microscopical images.
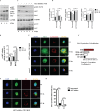
Fig 3. S. Typhimurium triggered cytosolic translocation and degradation of Sirt1 involves AKT.
(A) Immunoblot analysis of AKT activation upon S. Typhimurium infection in BMDMs. (B) The phosphorylated and total AKT amounts are quantified by densitometric analysis. Data shown are representative of at least 3 independent experiments. Bar graphs are expressed as mean ± SEM, ***p≤0.001, **p≤0.01 and *p≤0.05. (C) Protein expression of AKT, Sirt1, GAPDH and ACC from BMDMs pretreated with or without AKT inhibitor VIII prior to infection with S. Typhimurium. Western bots are representative of 3 independent experiments. (D) The phosphorylated AKT, ACC and Sirt1 amounts are quantified by densitometric analysis. Bar graphs are expressed as mean ± SEM, ***p≤0.001, **p≤0.01 and *p≤0.05. (E) Confocal immunofluorescence image showing Sirt1-LysoTracker Red co-localization in BMDMs pretreated with AKT inhibitor VIII followed by S. Typhimurium infection. BMDMs untreated with AKT inhibitor VIII but infected with S. Typhimurium for 4h is shown for comparison (n = 3). (F) Pearson’s correlation coefficient of Sirt1 with LysoTracker Red calculated by measuring 35 ROIs. (G) Sirt1- S. Typhimurium co-localization in BMDMs pretreated with AKT inhibitor VIII followed by S. Typhimurium infection (n = 3). Scale bar = 10μm for microscopical images. (H) Quantitation of LysoTracker Red co-localization with SCVs. 100 SCVs were counted and expressed as percentage co-localization. Bar graphs are expressed as mean ± SEM, ***p≤0.001.
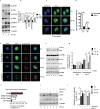
Fig 4. Increased mTOR activation leads to degradation of Sirt1 upon S. Typhimurium infection.
(A) Immunoblot analysis of S. Typhimurium-infected BMDMs for mTOR and its downstream targets p70S6K and NDRG1. (B) Densitomertic analysis of phosphorylation amounts of mTOR, p70s6K and NDRG1. Data shown are representative of at least 3 independent experiments. Bar graphs are expressed as mean ± SEM, ***p≤0.001, **p≤0.01 and *p≤0.05. (C) Confocal image of Sirt1- S. Typhimurium. (D) Quantitation of LysoTracker Red co-localization with SCVs. 100 SCVs were counted and expressed as percentage co-localization. Bar graphs are expressed as mean ± SEM, ***p≤0.001. (E) Sirt1-LysoTracker Red co-localization in BMDMs pretreated with Torin1 followed by S. Typhimurium infection. Sirt1-LysoTracker Red co-localization in untreated-BMDMs infected with S. Typhimurium for 4h is shown for comparison (n = 3). (F) Pearson’s correlation coefficient of Sirt1 with LysoTracker Red calculated by measuring 35 selected regions of interest (ROI) using olympus fluoview fv1000 software. (G) Immunoblot analysis of Sirt1, ACC phosphorylation and S6Kinase activation in S. Typhimurium-infected BMDMs pretreated with Torin1. (H) Mean densitometric data of Sirt1 and phosphorylated ACC were analyzed and normalized to GAPDH and total ACC respectively (n = 3). Bar graphs are expressed as mean ± SEM, ***p≤0.001 and **p≤0.01. (I) Immunoblot of phosphorylated ACC in BMDMs transfected with control or Sirt1-expressing plasmids. Western blots are representative of three experiments. (J) Densitomertic analysis of phosphorylation amounts of ACC is shown from 3 independent experiments. Bar graphs are expressed as mean ± SEM, ***p≤0.001, **p≤0.01 and *p≤0.05.
Fig 5. S. Typhimurium evades autophagy by disrupting Sirt1-dependent AMPK activation.
(A) Immunofluorescence image of S. Typhimurium co-localization with LC3 in GFP-LC3 expressing BMDMs at indicated time points. Data shown are representative of 3 independent experiments (n = 3). (B) Immunoblot analysis of p62 and LC3 expression upon S. Typhimurium infection in BMDMs. (C) LC3 and p62 expression levels are quantified by densitometry analysis. Data shown are from 3 independent experiments. (D) Confocal image of macrophages stained for Sirt1 and LC3. (E) BMDMs stained for LC3 and AMPK upon S. Typhimurium infection. (F) Confocal image of macrophages stained for LKB1 and LC3. (G) Immunoblot analysis of Sirt1, AMPK and LKB1 in wild type (WT) and Atg7-deficient macrophages. (H) Densitometric analysis of Sirt1, AMPK and LKB1 immunoblots (n = 3). Bar graphs are expressed as mean ± SEM, ***p≤0.001, **p≤0.01 and *p≤0.05. Scale bar = 10μm for microscopical images.
Fig 6. S. Typhimurium mediated targeting of Sirt1 for lysosomal degradation is virulence dependent.
Immunoblot analysis of ACC and LKB1 activation upon infection with ΔssrB (A) and ΔssaV (B) compared to S. Typhimurium. Sirt1 and acetylated-NFκB from macrophages infected with ΔssrB (C) and ΔssaV (D) compared to S. Typhimurium. (E) Expression of Sirt1 from cytoplasmic (C) and nuclear (N) fraction from BMDMs infected with ΔssrB. (F) Confocal image of Sirt1 and LysoTracker Red in _ΔssrB_-infected BMDMs. Sirt1-LysoTracker Red co-localization in untreated BMDMs infected with S. Typhimurium for 4h is shown for comparison (n = 3). (G) Immunoblot analysis of LC3 and p62. (H) Densitometric analysis of LC3 lipidation and p62 (n = 4). (I) Immunofluorescence image of _ΔssrB_-infected BMDMs stained for LC3 and LPS of S. Typhimurium (n = 3). (J) Quantitation of LC3 co-localization with SCVs. 100 SCVs were counted and expressed as percentage co-localization. (K) AKT, mTOR, p70S6K, NDRG1 expression upon S. Typhimurium (ST) and ΔssrB infection in BMDMs. (L) Densitometric analysis of AKT, mTOR, p70S6K and NDRG1 are shown from 3 independent experiments. Bar graphs are expressed as mean ± SEM, ***p≤0.001. Scale bar = 10μm for microscopical images.
Fig 7. Schematic representation.
SsrB-regulated virulence proteins of S. Typhimurium impedes Sirt1-LKB1-AMPK circuitry network to evade autophagy. S. Typhimurium induces energy depletion resulting in transient activation of AMPK. AMPK-mediated inhibition of mTOR and induction of autophagy are blunted by SPI2-regulated effector proteins by targeting Sirt1/LKB1/AMPK complex for lysosomal degradation.
Similar articles
- Toll-like receptor signalling cross-activates the autophagic pathway to restrict Salmonella Typhimurium growth in macrophages.
Liu W, Zhuang J, Jiang Y, Sun J, Prinz RA, Sun J, Jiao X, Xu X. Liu W, et al. Cell Microbiol. 2019 Dec;21(12):e13095. doi: 10.1111/cmi.13095. Epub 2019 Aug 26. Cell Microbiol. 2019. PMID: 31392811 - Activation of focal adhesion kinase by Salmonella suppresses autophagy via an Akt/mTOR signaling pathway and promotes bacterial survival in macrophages.
Owen KA, Meyer CB, Bouton AH, Casanova JE. Owen KA, et al. PLoS Pathog. 2014 Jun 5;10(6):e1004159. doi: 10.1371/journal.ppat.1004159. eCollection 2014 Jun. PLoS Pathog. 2014. PMID: 24901456 Free PMC article. - SIRT1 promotes proliferation and prevents senescence through targeting LKB1 in primary porcine aortic endothelial cells.
Zu Y, Liu L, Lee MY, Xu C, Liang Y, Man RY, Vanhoutte PM, Wang Y. Zu Y, et al. Circ Res. 2010 Apr 30;106(8):1384-93. doi: 10.1161/CIRCRESAHA.109.215483. Epub 2010 Mar 4. Circ Res. 2010. PMID: 20203304 - mTOR, AMPK, and Sirt1: Key Players in Metabolic Stress Management.
Cetrullo S, D'Adamo S, Tantini B, Borzi RM, Flamigni F. Cetrullo S, et al. Crit Rev Eukaryot Gene Expr. 2015;25(1):59-75. doi: 10.1615/critreveukaryotgeneexpr.2015012975. Crit Rev Eukaryot Gene Expr. 2015. PMID: 25955819 Review. - Autophagy recognizes intracellular Salmonella enterica serovar Typhimurium in damaged vacuoles.
Birmingham CL, Brumell JH. Birmingham CL, et al. Autophagy. 2006 Jul-Sep;2(3):156-8. doi: 10.4161/auto.2825. Epub 2006 Jul 10. Autophagy. 2006. PMID: 16874057 Review.
Cited by
- Activation of Mechanistic Target of Rapamycin (mTOR) in Human Endothelial Cells Infected with Pathogenic Spotted Fever Group Rickettsiae.
Sahni A, Narra HP, Sahni SK. Sahni A, et al. Int J Mol Sci. 2020 Sep 29;21(19):7179. doi: 10.3390/ijms21197179. Int J Mol Sci. 2020. PMID: 33003310 Free PMC article. - Salmonella Populations inside Host Cells.
Castanheira S, García-Del Portillo F. Castanheira S, et al. Front Cell Infect Microbiol. 2017 Oct 4;7:432. doi: 10.3389/fcimb.2017.00432. eCollection 2017. Front Cell Infect Microbiol. 2017. PMID: 29046870 Free PMC article. Review. - Research progress on Chaihu Shugan San in treating perimenopausal syndrome: A review.
Zhang X, Luo L, Wang C, Lv W, Duan Y, Kong L. Zhang X, et al. Medicine (Baltimore). 2024 Dec 27;103(52):e41044. doi: 10.1097/MD.0000000000041044. Medicine (Baltimore). 2024. PMID: 39969354 Free PMC article. Review. - Host sirtuin 2 as an immunotherapeutic target against tuberculosis.
Bhaskar A, Kumar S, Khan MZ, Singh A, Dwivedi VP, Nandicoori VK. Bhaskar A, et al. Elife. 2020 Jul 22;9:e55415. doi: 10.7554/eLife.55415. Elife. 2020. PMID: 32697192 Free PMC article. - Essential role for epithelial HIF-mediated xenophagy in control of Salmonella infection and dissemination.
Dowdell AS, Cartwright IM, Kitzenberg DA, Kostelecky RE, Mahjoob O, Saeedi BJ, Welch N, Glover LE, Colgan SP. Dowdell AS, et al. Cell Rep. 2022 Sep 27;40(13):111409. doi: 10.1016/j.celrep.2022.111409. Cell Rep. 2022. PMID: 36170839 Free PMC article.
References
MeSH terms
Substances
LinkOut - more resources
Full Text Sources
Other Literature Sources
Medical
Molecular Biology Databases
Research Materials
Miscellaneous
