A RhoG-mediated signaling pathway that modulates invadopodia dynamics in breast cancer cells - PubMed (original) (raw)
. 2017 Mar 15;130(6):1064-1077.
doi: 10.1242/jcs.195552. Epub 2017 Feb 15.
Affiliations
- PMID: 28202690
- PMCID: PMC5358339
- DOI: 10.1242/jcs.195552
A RhoG-mediated signaling pathway that modulates invadopodia dynamics in breast cancer cells
Silvia M Goicoechea et al. J Cell Sci. 2017.
Abstract
One of the hallmarks of cancer is the ability of tumor cells to invade surrounding tissues and metastasize. During metastasis, cancer cells degrade the extracellular matrix, which acts as a physical barrier, by developing specialized actin-rich membrane protrusion structures called invadopodia. The formation of invadopodia is regulated by Rho GTPases, a family of proteins that regulates the actin cytoskeleton. Here, we describe a novel role for RhoG in the regulation of invadopodia disassembly in human breast cancer cells. Our results show that RhoG and Rac1 have independent and opposite roles in the regulation of invadopodia dynamics. We also show that SGEF (also known as ARHGEF26) is the exchange factor responsible for the activation of RhoG during invadopodia disassembly. When the expression of either RhoG or SGEF is silenced, invadopodia are more stable and have a longer lifetime than in control cells. Our findings also demonstrate that RhoG and SGEF modulate the phosphorylation of paxillin, which plays a key role during invadopodia disassembly. In summary, we have identified a novel signaling pathway involving SGEF, RhoG and paxillin phosphorylation, which functions in the regulation of invadopodia disassembly in breast cancer cells.
Keywords: Guanine-nucleotide exchange factors; Invadopodia; Paxillin; Rac1; RhoG; SGEF; Src.
© 2017. Published by The Company of Biologists Ltd.
Conflict of interest statement
Competing interests
The authors declare no competing or financial interests.
Figures
Fig. 1.
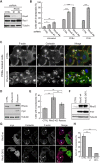
RhoG negatively regulates invadopodia formation in SUM159 cells. (A) Cell lysates from SUM159 cells stably expressing non-targeting (CTRL) or RhoG-specific shRNAs (shRNA#1 and shRNA #4) were analyzed by western blotting and probed for RhoG and Rac1, and for tubulin as a loading control. (B) Quantification of cortactin- and actin-containing invadopodia in CTRL and RhoG KD cells. Results are expressed as the percentage of cells with invadopodia. Data are mean±s.e.m. for at least three independent experiments. Cells were either untreated, or treated with PDBu or PMA. (C) CTRL or RhoG KD SUM159 cells were treated with PDBu for 30 min and stained with anti-cortactin antibody (red), Alexa-Fluor-488–phalloidin (green) and Hoechst 33342 (blue). Arrowheads indicate representative invadopodia. (D) Cell lysates from CTRL, RhoG KD and RhoG KD cells expressing shRNA resistant Myc–RhoG (rescue) were immunoblotted with anti-RhoG and -Myc antibodies. Tubulin was used as a loading control. (E) Quantification of cortactin- and actin-containing invadopodia in CTRL, RhoG KD and rescue cells. Data are mean±s.e.m. of three independent experiments. (F) Cell lysates from CTRL, Myc–RhoG wt (RhoG wt) or Myc–RhoG Q61L (RhoG Q61L) cells were immunoblotted with anti-RhoG and -Myc antibodies. Tubulin was used as a loading control. (G) SUM159 cells transiently transfected with Myc-tagged wild-type (RhoG wt) or constitutively active RhoG (RhoG Q61L) were treated with PDBu for 30 min and stained with anti-cortactin antibody (red), anti-Myc antibody (green), Alexa-Fluor-647–phalloidin (magenta) and Hoechst 33342 (blue). Arrowheads indicate transfected cells and arrows indicate representative invadopodia. (H) Invadopodia were quantified in CTRL (non-transfected cells), and RhoG wt and RhoG Q61L transfected cells. Results are representative of three independent experiments in which at least 100 cells per experiment were counted. Data are mean±s.e.m. (error bars). Scale bars: 10 µm. *P<0.05; **P<0.01; ***P<0.001; ns, not significant.
Fig. 2.
Src activity is necessary for increased invadopodia formation after RhoG KD. Western blot analysis shows increased levels of phospho-Src (Src p418) (A) and phospho-FAK (FAK p397) (B) in RhoG-depleted cells. Data are mean±s.e.m. of three independent experiments. (C–F) CTRL and RhoG KD cells were cultured in the presence of vehicle control, 5 μM PP2 (C,D) or 5 μM PF-573228 (E,F) for 30 min followed by a 30 min incubation with PDBu. The efficiency of the inhibitors was tested by immunoblotting for phospho-Src (Src p418) (C) or phospho-FAK (FAK p397) (E). Quantifications in D and F show the percentage of cells with invadopodia, as determined by cortactin and actin staining. Data are mean±s.e.m. of three independent experiments. *P<0.05; **P<0.01; ***P<0.001; ns, not significant.
Fig. 3.
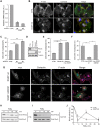
SGEF regulates invadopodia formation. (A) Cell lysates from SUM159 cells stably expressing non-targeting (CTRL) or SGEF-specific shRNAs (shRNA#4 and shRNA #5) were analyzed by qRT-PCR for expression of SGEF. (B) CTRL and SGEF KD SUM159 cells were treated with PDBu for 30 min and stained with anti-cortactin antibody (red), Alexa-Fluor-488–phalloidin (green) and Hoechst 33342 (blue). Arrowheads indicate representative invadopodia. (C) Quantification of cortactin- and actin-containing invadopodia in CTRL and SGEF KD cells expressed as the percentage of cells with invadopodia. Data are mean±s.e.m. of four independent experiments. (D) Cell lysates from CTRL, RhoG KD and RhoG KD cells expressing Myc–SGEF (rescue Myc–SGEF) were immunoblotted with anti-RhoG and -Myc antibodies. Tubulin was used as a loading control. (E) Quantification of cortactin- and actin-containing invadopodia in CTRL, RhoG KD and rescue Myc–SGEF cells. Data are mean±s.e.m. of three independent experiments in which at least 200 cells per experiment were counted. (F) Quantification of cortactin- and actin-containing invadopodia in SUM159 cells transiently transfected with either Myc-tagged wild-type SGEF (SGEF wt) or catalytically inactive SGEF (SGEF 446/621). Data are mean± s.e.m. of at least three independent experiments in which at least 200 cells per experiment were counted. (G) Representative images of cells transfected with either Myc-tagged wild-type SGEF (SGEF wt) or catalytically inactive SGEF (SGEF 446/621). Cells were stained with anti-cortactin antibody (red), anti-Myc antibody (green), Alexa-Fluor-647–phalloidin (magenta) and Hoechst 33342 (blue). Arrows indicate transfected cells and arrowheads indicate representative invadopodia. (H–J) CTRL (H) and SGEF KD (I) cells were treated with PDBu for the indicated times. Active RhoG was precipitated from total lysates using GST–ELMO and immunoblotted with RhoG antibody. (J) For quantification, active RhoG levels were normalized to total RhoG levels. Data are mean±s.e.m. of at least three independent experiments. Scale bars: 10 µm. *P<0.05; **P<0.01; ***P<0.001.
Fig. 4.
Silencing RhoG increases matrix degradation but not invasion. (A) CTRL and RhoG KD cells were cultured on Oregon Green 488-conjugated gelatin and stained with anti-cortactin antibody (red). Invadopodia quantification in CTRL and RhoG KD cells is expressed as the percentage of cells with invadopodia. Data are mean±s.e.m. of three independent experiments. (B) Representative images showing matrix degradation in CTRL and RhoG KD cells. Scale bars: 20 µm. (C) Area of matrix degraded per cell area. Data are mean±s.e.m. of three independent experiments. (D) Invasion assay in CTRL, RhoG KD and RhoG KD/Myc-RhoG rescue cells. Representative images showing cells that have invaded across a Matrigel-coated transwell membrane are presented. Results are representative of at least four individual experiments. (E) Invasion assay of CTRL and SGEF KD cells. Representative images are showing on the left. Results are representative of at least four individual experiments. *P<0.05; **P<0.01.
Fig. 5.
Rac1 is necessary for invadopodia formation in SUM159 cells. (A) Cells lysates from CTRL and Rac1 KO SUM159 cells were analyzed by western blotting and probed for Rac1 and tubulin, as a loading control. (B) CTRL and Rac1 KO cells were treated with PDBu for 30 min and stained with anti-cortactin antibody (red), Alexa-Fluor-488–phalloidin (green) and Hoechst 33342 (blue). Arrowheads indicate representative invadopodia. Scale bars: 10 µm. (C) Quantification of cortactin- and actin-containing invadopodia in CTRL and Rac1 KO cell lines expressed as percentage of number of cells with invadopodia. Data are mean±s.e.m. of at least three independent experiments in which at least 200 cells per experiment were counted. (D) Cell lysates from CTRL, Rac1 KO and Rac1 KO cells expressing Myc–Rac1 (rescue) were immunoblotted with anti-Rac1 and -Myc antibodies. Tubulin was used as a loading control (left panel). Quantification of cortactin- and actin-containing invadopodia in CTRL, Rac1 KO and rescue cells (right panel). Data are mean±s.e.m. of at least three independent experiments in which at least 200 cells per experiment were counted. (E) Cell lysates from CTRL and cells expressing Myc–Rac1 (Rac1 OE) were immunoblotted with anti-Rac1 and -Myc antibodies. Tubulin was used as a loading control (left panel). Quantification of cortactin- and actin-containing invadopodia in CTRL cells and cells expressing Myc-Rac1 (right panel). Data are mean±s.e.m. of at least three independent experiments in which at least 200 cells per experiment were counted. (F) Cell lysates from CTRL, RhoG KD and RhoG KD cells expressing Myc–Rac1 (RhoG KD+Myc-Rac1) were immunoblotted with anti-RhoG and -Myc antibodies. Tubulin was used as a loading control (left panel). Quantification of cortactin- and actin-containing invadopodia in CTRL, RhoG KD and RhoG KD+Myc-Rac1 cells (right panel). Data are mean±s.e.m. of at least three independent experiments in which at least 200 cells per experiment were counted. *P<0.05; **P<0.01; ***P<0.001.
Fig. 6.
Silencing RhoG or SGEF increases invadopodia lifetime. (A) CTRL or RhoG KD SUM159 cells were treated with PDBu for the indicated times and stained for cortactin and actin as invadopodia markers. Invadopodia were quantified and expressed as the percentage of cells with invadopodia. Data are mean± s.e.m. of three independent experiments in which at least 200 cells were analyzed per condition. (B) Representative time series of invadopodia formation in CTRL and RhoG KD cells. SUM159 cells expressing mCherry–cortactin were imaged for 120 min at 15 s intervals following the addition of PDBu. White arrows point to an invadopodia cluster forming in the nuclear region. Scale bars: 20 µm. (C) Invadopodia lifetime increases when RhoG and SGEF expression are silenced. Re-expression of RhoG and SGEF in RhoG KD and SGEF KD cells respectively restores the lifetime to the levels of CTRL cells. Results are representative of three independent experiments in which at least five cells were analyzed per condition. The box represents the 25–75th percentiles, and the median is indicated. The whiskers show the 5th to 95th percentiles. *P<0.05; **P<0.01.
Fig. 7.
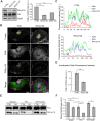
RhoG knockdown decreases paxillin phosphorylation at invadopodia. (A) Cell lysates from CTRL, RhoG KD and SGEF KD SUM159 cells were analyzed by western blotting and probed for phospho-paxillin (PXN p118), total paxillin (PXN) and tubulin as a loading control (left panel). The quantification represents the average of at least three independent experiments. Data are mean±s.e.m. (right panel). (B) CTRL and RhoG KD SUM159 cells were treated with PDBu for 30 min, fixed and stained with Alexa-Fluor-647–phalloidin (magenta), and for PXN (green) and PXN p118 (red). Scale bars: 10 µm. (C) Graphs indicate fluorescent intensity in arbitrary units (A.U.) of PXN p118 (red) with respect to PXN (green) and F-actin (blue) over the indicated line scan in (B). (D) Total fluorescence intensity for PXN and PXN p118 in individual invadopodia from CTRL and RhoG KD cells were measurements of at least 50 invadopodia per condition. Data are mean±s.e.m. (E) CTRL and RhoG KD cells were cultured in the presence of vehicle control, 5 μM PP2 or 5 μM PF-573228 for 30 min. Cell lysates were analyzed by western blotting and probed for total paxillin (PXN) and phosho-paxillin (PXN p118). (F) Quantification of PXN p118 to PXN ratio in cells treated with vehicle, PP2 and PF-573228. Results represent the mean±s.e.m. of at least three independent experiments. *P<0.05, **P<0.01.
Fig. 8.
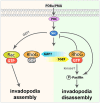
Model of RhoG function in invadopodia. Phorbol esters, including PDBu and PMA, stimulate PKC, which induces the formation of invadopodia in a Src-dependent fashion. Assembly of invadopodia requires Rac1 activity. In contrast, RhoG activity needs to be downregulated for invadopodia to form. During disassembly, SGEF is recruited to invadopodia, where it activates RhoG, which promotes the phosphorylation of paxillin.
Similar articles
- Phosphorylated cortactin recruits Vav2 guanine nucleotide exchange factor to activate Rac3 and promote invadopodial function in invasive breast cancer cells.
Rosenberg BJ, Gil-Henn H, Mader CC, Halo T, Yin T, Condeelis J, Machida K, Wu YI, Koleske AJ. Rosenberg BJ, et al. Mol Biol Cell. 2017 May 15;28(10):1347-1360. doi: 10.1091/mbc.E16-12-0885. Epub 2017 Mar 29. Mol Biol Cell. 2017. PMID: 28356423 Free PMC article. - A Trio-Rac1-Pak1 signalling axis drives invadopodia disassembly.
Moshfegh Y, Bravo-Cordero JJ, Miskolci V, Condeelis J, Hodgson L. Moshfegh Y, et al. Nat Cell Biol. 2014 Jun;16(6):574-86. doi: 10.1038/ncb2972. Epub 2014 May 25. Nat Cell Biol. 2014. PMID: 24859002 Free PMC article. - Targeting invadopodia for blocking breast cancer metastasis.
Meirson T, Gil-Henn H. Meirson T, et al. Drug Resist Updat. 2018 Jul;39:1-17. doi: 10.1016/j.drup.2018.05.002. Epub 2018 May 17. Drug Resist Updat. 2018. PMID: 30075834 Review. - Invadopodia, a Kingdom of Non-Receptor Tyrosine Kinases.
Saha T, Gil-Henn H. Saha T, et al. Cells. 2021 Aug 9;10(8):2037. doi: 10.3390/cells10082037. Cells. 2021. PMID: 34440806 Free PMC article. Review.
Cited by
- Dissecting the heterogeneity of the alternative polyadenylation profiles in triple-negative breast cancers.
Wang L, Lang GT, Xue MZ, Yang L, Chen L, Yao L, Li XG, Wang P, Hu X, Shao ZM. Wang L, et al. Theranostics. 2020 Aug 21;10(23):10531-10547. doi: 10.7150/thno.40944. eCollection 2020. Theranostics. 2020. PMID: 32929364 Free PMC article. - RhoG-ELMO1-RAC1 is involved in phagocytosis suppressed by mono-butyl phthalate in TM4 cells.
Gong P, Chen S, Zhang L, Hu Y, Gu A, Zhang J, Wang Y. Gong P, et al. Environ Sci Pollut Res Int. 2018 Dec;25(35):35440-35450. doi: 10.1007/s11356-018-3503-z. Epub 2018 Oct 22. Environ Sci Pollut Res Int. 2018. PMID: 30350139 - ARHGAP17 regulates the spatiotemporal activity of Cdc42 at invadopodia.
Kreider-Letterman G, Castillo A, Mahlandt EK, Goedhart J, Rabino A, Goicoechea S, Garcia-Mata R. Kreider-Letterman G, et al. J Cell Biol. 2023 Feb 6;222(2):e202207020. doi: 10.1083/jcb.202207020. Epub 2022 Dec 26. J Cell Biol. 2023. PMID: 36571786 Free PMC article. - FARP1, ARHGEF39, and TIAM2 are essential receptor tyrosine kinase effectors for Rac1-dependent cell motility in human lung adenocarcinoma.
Cooke M, Kreider-Letterman G, Baker MJ, Zhang S, Sullivan NT, Eruslanov E, Abba MC, Goicoechea SM, García-Mata R, Kazanietz MG. Cooke M, et al. Cell Rep. 2021 Nov 2;37(5):109905. doi: 10.1016/j.celrep.2021.109905. Cell Rep. 2021. PMID: 34731623 Free PMC article. - The Scribble/SGEF/Dlg1 complex regulates the stability of apical junctions in epithelial cells.
Rabino A, Awadia S, Ali N, Edson A, Garcia-Mata R. Rabino A, et al. bioRxiv [Preprint]. 2024 Mar 27:2024.03.26.586884. doi: 10.1101/2024.03.26.586884. bioRxiv. 2024. PMID: 38585765 Free PMC article. Updated. Preprint.
References
- Ayala I., Giacchetti G., Caldieri G., Attanasio F., Mariggio S., Tete S., Polishchuk R., Castronovo V. and Buccione R. (2009). Faciogenital dysplasia protein Fgd1 regulates invadopodia biogenesis and extracellular matrix degradation and is up-regulated in prostate and breast cancer. Cancer Res. 69, 747-752. 10.1158/0008-5472.CAN-08-1980 - DOI - PubMed
MeSH terms
Substances
LinkOut - more resources
Full Text Sources
Other Literature Sources
Medical
Research Materials
Miscellaneous


