TFEB-driven endocytosis coordinates MTORC1 signaling and autophagy - PubMed (original) (raw)
TFEB-driven endocytosis coordinates MTORC1 signaling and autophagy
Israel C Nnah et al. Autophagy. 2019 Jan.
Abstract
The mechanistic target of rapamycin kinase complex 1 (MTORC1) is a central cellular kinase that integrates major signaling pathways, allowing for regulation of anabolic and catabolic processes including macroautophagy/autophagy and lysosomal biogenesis. Essential to these processes is the regulatory activity of TFEB (transcription factor EB). In a regulatory feedback loop modulating transcriptional levels of RRAG/Rag GTPases, TFEB controls MTORC1 tethering to membranes and induction of anabolic processes upon nutrient replenishment. We now show that TFEB promotes expression of endocytic genes and increases rates of cellular endocytosis during homeostatic baseline and starvation conditions. TFEB-mediated endocytosis drives assembly of the MTORC1-containing nutrient sensing complex through the formation of endosomes that carry the associated proteins RRAGD, the amino acid transporter SLC38A9, and activate AKT/protein kinase B (AKT p-T308). TFEB-induced signaling endosomes en route to lysosomes are induced by amino acid starvation and are required to dissociate TSC2, re-tether and activate MTORC1 on endolysosomal membranes. This study characterizes TFEB-mediated endocytosis as a critical process leading to activation of MTORC1 and autophagic function, thus identifying the importance of the dynamic endolysosomal system in cellular clearance. Abbreviations: CAD: central adrenergic tyrosine hydroxylase-expressing-a-differentiated; ChIP-seq: chromosome immunoprecipitation sequencing; DAPI: 4',6-diamidino-2-phenylindole; DMSO: dimethyl sulfoxide; EDTA: ethylenediaminetetraacetic acid; EEA1: early endosomal antigen 1; EGF: epidermal growth factor; FBS: fetal bovine serum; GFP: green fluorescent protein; GTPase: guanosine triphosphatase; HEK293T: human embryonic kidney 293 cells expressing a temperature-sensitive mutant of the SV40 large T antigen; LAMP: lysosomal-associated membrane protein; LYNUS: lysosomal nutrient-sensing complex; MAP1LC3/LC3: microtubule associated protein 1 light chain 3 alpha/beta; MTOR: mechanistic target of rapamycin kinase; MTORC: mechanistic target of rapamycin kinase complex; OE: overexpression; PH: pleckstrin homology; PtdIns(3,4,5)P3: phosphatidylinositol 3,4,5-trisphosphate; RRAGD: Ras related GTPase binding D; RHEB: Ras homolog enriched in brain; SLC38A9: solute carrier family 38 member 9; SQSTM1: sequestosome 1; TFEB: transcription factor EB; TSC2: tuberous sclerosis 2; TMR: tetramethylrhodamine; ULK1: unc-51 like kinase 1; WT: wild type.
Keywords: Autophagic mechanisms; TOR signaling; cell biology; endosome; lysosome.
Figures
Figure 1.
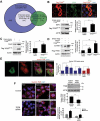
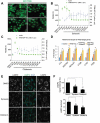
Overexpression of TFEB stimulates cellular endocytosis. (a) Venn diagram illustrating the relationship between 623 endocytic genes with 46 endocytic genes directly bound by TFEB (ChIP-seq analysis on stable TFEB-FLAG HeLa cells) and 35 TFEB-upregulated endocytic genes (microarray analysis on TFEB-GFP HeLa cells compared to WT HeLa controls), identifying putative genes of interest regulating the endocytic process. A complete list of the 46 endocytic genes identified by ChIP-seq (adapted from [6]) is presented in Table S1, 623 endocytic genes with known/predicted roles in the endocytic pathway are listed in Table S2, and the 35 endocytic genes determined by microarray can be found in Table S3. Bracketed numbers within each domain represent the number of genes in each intersecting or non-overlapping region. (b) Immunofluorescence images represent HeLa cells transiently transfected with WT Flag-TFEB for 48 h and immunostained for EEA1. Flag-TFEB-expressing cells showed a significant increase in the levels of EEA1-positive endosomes as compared to untransfected, neighboring cells. HEK293T cells transiently transfected with constitutively active TFEBS211A also showed an increased level of EEA1 expression. (c and d) HEK293T cells transiently overexpressing TFEBS211A showed increased CAV2 and CLTA/B protein levels. Bar graph represents a quantitative evaluation of the indicated relative protein levels. (e) Overexpression of TFEB-GFP increased the number of dextran-tetramethylrhodamine (dextran-TMR)-positive puncta indicating increased rates of endocytosis, panels on the right show magnifications of the outlined areas in merged images. The bar graph represents quantitative dextran-TMR uptake assays assessing TMR fluorescence intensities in cells. Note that TFEB-overexpression, 50 µM chloroquine (CQ) for 2 h, 1 µM Torin1 for 2 h and 2-h amino acid starvation all potently increased dextran-TMR uptake. (f) In dextran-TMR uptake assays for cellular endocytosis, TFEB-deficient HEK293T cells show a lower rate of uptake compared to control cells, in both fed and 2-h amino acid-starved conditions. Panels on the right are magnifications of the outlined areas in images of fed or starved cells. Bar diagram represents a quantitative assessment of dextran-TMR uptake in control or TFEB-knockdown cells under fed or starved conditions (compare average number of dextran-TMR puncta per cell in control vs _TFEB_-siRNA-treated cells). Note that amino acid starvation increases endocytic dextran-TMR uptake and is dependent on TFEB expression. Immunoblot analyses represent TFEB knockdown efficiency in HEK293T cells. The bar graph represents a quantitative evaluation of TFEB protein levels. Transient overexpression of TFEB increased and relocalized EGF-rhodamine and CAV2 (see Figure S1). Data are represented as mean ± SEM, n = 3, *p ≤ 0.05; **p ≤ 0.01; ANOVA, Scale bar: 10 μm. ACTB is used as loading control.
Figure 2.
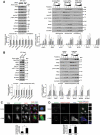
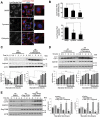
Overexpression of TFEB induces the formation of signaling endosomes to assemble the LYNUS complex. (a) HEK293T cells transfected either with control scrambled or _TFEB_-specific siRNA were starved of amino acids for up to 6 h and used in endosomal fractionation assays. All cells were exposed to the same concentration of dialyzed FBS to allow for growth factor signaling. Input shown on the left indicates that equal protein amounts were used in fractionation assays (shown on the right). Starved cells showed an increased quantity of LAMP1- and RAB5-positive organelles, endosomal phospho-AKT (p-Thr308), the MTORC1 tethering molecule RRAGD, and MTOR itself, while TSC2 was strongly reduced in denser lysosomal fractions. This starvation-induced effect was not observed in TFEB-depleted cells (TFEB siRNA-labeled lanes). Bar graphs present quantification of protein levels in input and indicated fractions. (b) TFEB-overexpressing (OE) HEK293T cells used in identical fractionation assays mimicked long-term starvation conditions showing accumulation of organelles positive for LAMP1, RAB5, p-AKT, RRAGD, and MTOR, while being deficient in TSC2. Bar graphs represent protein levels in input and fractions. (c) Overexpression of TFEB induced the formation of AKT-PH-GFP-positive endosomes in NIH-3T3 fibroblasts. The otherwise plasma membrane-bound or cytoplasmic bioprobe AKT-PH-GFP relocalized to RAB5-positive endosomes in TFEB-overexpressing fibroblasts (yellow arrowheads), indicating an increase in PtdIns(3,4,5)P3 levels and activation of AKT. Bar graph represents a quantitative evaluation of AKT-PH-GFP colocalization with RAB5. Scale bar: 10 μm. (d) Localization of the MTOR-tethering molecule RRAGD to RAB5Q79L-positive endosomes was increased with the expression of TFEB-Flag. Diagrams represent a quantitative evaluation of MTOR or RRAGD colocalization with RAB5Q79L-DsRed endosomes. Scale bar: 10 μm. Data are represented as mean ± SEM, n = 3, *p ≤ 0.05; **p ≤ 0.01; ANOVA.
Figure 3.
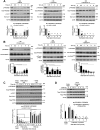
Recovery of MTORC1 activity during prolonged starvation occurs in a TFEB-driven endocytosis-dependent manner. (a) MTORC1 activity was assessed in amino acid (leucine and glutamine)-starved HEK293T cells for the indicated time points. Relative p-RPS6KB1 (p-Thr389) as well as relative p-ULK1 (p-Ser757) levels were assessed by immunoblots indicative of changes in MTORC1 activity. Reactivation of MTORC1 was observed after 6 h of starvation in DMSO-treated control cells but remained suppressed in dynasore- or ciliobrevin A-treated and starved cells. Bar graphs represent a quantitative evaluation of relative p-RPS6KB1 and p-ULK1 protein levels. (b) Faster recovery of MTORC1 signaling was observed in HEK293T cells overexpressing WT DNM2, whereas the overexpression of the dominant negative form of DNM2 efficiently inhibited MTORC1 reactivation during starvation (compare DNM2WT- and DNM2K44A-expressing cells to those expressing an empty vector control). Arrows indicate specific p-RPS6KB1 bands. Bar graphs represent the quantitative analyses of relative p-RPS6KB1 protein levels. (c and d) Depletion of endogenous TFEB inhibits MTORC1 reactivation, whereas overexpression of Flag-TFEB increased basal MTORC1 activity and promoted faster recovery of MTORC1 signaling during prolonged starvation in a DNM-dependent manner. An empty vector control is shown in the first lane and used for comparison to TFEB knockdown or overexpression samples. Bar graphs represent a quantitative evaluation of relative p-RPS6KB1 and p-ULK1 protein levels. Gray bars in (d) show relative p-RPS6KB1 levels adjusted for transfection efficiency of the Flag-TFEB vectors. Data are represented as mean ± SEM, n = 3, ns denotes ‘no significant difference’, *p ≤ 0.05; **p ≤ 0.01; ***p ≤ 0.001; ANOVA.
Figure 4.
Endocytic trafficking controls MTORC1 tethering and signaling. (a-c) Pharmacological inhibition of DNM GTPase with dynasore under fed conditions disperses MTORC1 into the cytosol while TSC2, the negative regulator of MTORC1, relocalizes to lysosomes. NIH-3T3 fibroblasts were treated with 80 μM of dynasore for 4 h followed by colocalization analyses of MTOR or TSC2 with the lysosomal LAMP2 protein. The bar graph in (c) represents a quantitative evaluation of lysosomal MTORC1 or TSC2 shown in (a and b). Scale bars: 10 μm. (d) Dynasore treatment inhibits MTORC1 activity under fed conditions and has no significant effect on relative p-AKT (Thr308) protein levels. NIH-3T3 fibroblasts were subjected to hydroxyl-dynasore treatment for the indicated time points followed by p-RPS6KB1 immunoblot analyses for MTORC1 activity. Bar graph represents a quantitative analysis of relative protein levels of p-RPS6KB1 and p-AKT (Thr308). (e) Competitive inhibition of DNM2 with a dominant-negative form of DNM2 (DNM2K44A) reduced MTORC1 activity, whereas overexpression of the wild-type form increased MTORC1 signaling in HEK293T cells. An increasing LC3-II level, indicative of autophagy induction and buildup of autophagosomes, were observed in DNM2K44A-overexpressing cells. Bar graph represents the quantitative analyses of relative protein levels of p-RPS6KB1, LC3-I and LC3-II. (f) Pharmacological inhibition of the dynein motor protein, hence retrograde trafficking, with ciliobrevin A dissociates MTOR from lysosomal membranes. NIH-3T3 fibroblasts were treated with 100 μM of ciliobrevin A for 2 h followed by colocalization analyses of MTOR with lysosomal LAMP2 protein. Scale bar: 10 μm. Bar graph represents quantitative analyses of colocalization of MTOR and LAMP2 signals. (g) Competitive inhibition of RAB5 with a dominant-negative form of RAB5N133I reduced MTORC1 activity whereas the wild-type form increased MTORC1 signaling in HEK293T cells. Bar graph represents the quantitative analyses of relative protein levels of p-RPS6KB1. Inhibition of cellular endocytosis with hypertonic sucrose media and pharmacological inhibition of dynein motor proteins also inhibited MTORC1 signaling (see Figure S3). Data are represented as mean ± SEM, n = 3, p ≤ 0.05; **p ≤ 0.01; ***p ≤ 0.001; ANOVA.
Figure 5.
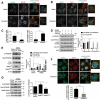
Inhibition of endosomal trafficking translocates TFEB into the nucleus and reduces the quantity of LAMP2-positive vesicles. (a-c) Inhibition of DNM or dynein with dynasore or ciliobrevin A relocalizes TFEB to the nucleus. A plasmid expressing GFP-TFEB was transiently transfected into HeLa cells followed by dynasore (a and b) or ciliobrevin A treatment (A and C) with the indicated concentrations overnight. Nuclear TFEB was assessed by confocal microscopy and quantitatively represented in the graphs in (b and c). Scale bar: 10 μm. (D) Quantitative RT-PCR analyses of ciliobrevin A- and dynasore-treated cells showed increased transcription of TFEB target genes (LC3, SQSTM1, MCOLN1, CTSB, CTSF, and TFEB) after inhibition of endocytosis with dynasore or inhibition of retrograde trafficking with ciliobrevin A. Bar graphs represent fold change in mRNA levels. (e and f) NIH3T3 cells treated with dynasore or ciliobrevin A overnight showed a strong reduction of the intensity of LAMP2-immunoreactivity and number of LAMP2-positive spots per cell, indicative of the number of lysosomes. Right panels are magnifications of outlined areas. Bar graphs represent the quantitative analysis of the LAMP2 signal intensity and an average number of LAMP2 puncta per cell in both conditions. Scale bar: 10 μm. Data are represented as mean ± SEM, n = 3; *p ≤ 0.05; **p ≤ 0.01; ANOVA.
Figure 6.
Inhibition of endocytic trafficking attenuates number and acidification of endolysosomes to halt autophagy flux. (a and b) Inhibition of endocytic trafficking in fibroblasts, with either dynasore or ciliobrevin A, consequently reduces the number of acidic vesicles indicated by LysoTracker Red fluorescence staining. Scale bar: 10 μm. Bar graphs in (b) represent the quantitative analysis of the LysoTracker Red fluorescence intensity and an average number of puncta per cell in both conditions. (c) Autophagy flux assay of HEK293T cells treated with DMSO and starved of amino acids for the indicated time points. Normal autophagy flux is indicated by the gradual decrease in the levels of LC3-II and SQSTM1 during starvation and their accumulation when the lysosomal function is inhibited by chloroquine. Bar graphs represent a quantitative analysis of the relative SQSTM1 and LC3 protein levels during starvation. (d) Autophagy flux was impaired in cells treated with either dynasore or ciliobrevin A. HEK293T Cells were pre-incubated with dynasore for 4 h or ciliobrevin A for 2 h prior to amino acid starvation for the indicated time points. Compared to controls (c), LC3-II protein levels did not decrease, but rather increased over time indicating an impaired autophagy flux due to lysosomal inhibition. Bar graphs represent a quantitative analysis of the relative SQSTM1 and LC3 protein levels during starvation. (e) Autophagic markers LC3 and SQSTM1 were decreased in cells overexpressing Flag-TFEB in an endocytic trafficking-dependent manner. Inhibition of dynein-dependent trafficking with ciliobrevin A strongly increased LC3-II and SQSTM1 protein levels. Bar graphs represent a quantitative analysis of the relative SQSTM1, LC3 and Flag-TFEB protein levels during starvation. A significant change relative to the control at the time point 0 h is given. Treatment with dynasore or ciliobrevin A did not affect fusion of autophagosomes with lysosomes (Figure S4). Data are represented as mean ± SEM, n = 6; ns denotes no significant difference, *p ≤ 0.05; **p ≤ 0.01; ***p ≤ 0.001; ANOVA.
Figure 7.
TFEB-mediated endocytosis activates MTORC1 by coordinating the sorting of LYNUS components on endosomal membranes. Starvation-induced inhibition of MTORC1 promotes nuclear TFEB activity (1) that triggers expression of endocytic genes driving random formation of endosomes that shuttle LYNUS components including active p-AKT and RRAG GTPases (2), en route to lysosomes to inhibit TSC2 (via AKT-mediated phosphorylation that targets TSC2) (3), tether MTORC1 (4) and eventually promote autophagy flux.
Similar articles
- VCP maintains lysosomal homeostasis and TFEB activity in differentiated skeletal muscle.
Arhzaouy K, Papadopoulos C, Schulze N, Pittman SK, Meyer H, Weihl CC. Arhzaouy K, et al. Autophagy. 2019 Jun;15(6):1082-1099. doi: 10.1080/15548627.2019.1569933. Epub 2019 Jan 29. Autophagy. 2019. PMID: 30654731 Free PMC article. - MITF-MIR211 axis is a novel autophagy amplifier system during cellular stress.
Ozturk DG, Kocak M, Akcay A, Kinoglu K, Kara E, Buyuk Y, Kazan H, Gozuacik D. Ozturk DG, et al. Autophagy. 2019 Mar;15(3):375-390. doi: 10.1080/15548627.2018.1531197. Epub 2018 Oct 16. Autophagy. 2019. PMID: 30290719 Free PMC article. - Trehalose causes low-grade lysosomal stress to activate TFEB and the autophagy-lysosome biogenesis response.
Jeong SJ, Stitham J, Evans TD, Zhang X, Rodriguez-Velez A, Yeh YS, Tao J, Takabatake K, Epelman S, Lodhi IJ, Schilling JD, DeBosch BJ, Diwan A, Razani B. Jeong SJ, et al. Autophagy. 2021 Nov;17(11):3740-3752. doi: 10.1080/15548627.2021.1896906. Epub 2021 Mar 11. Autophagy. 2021. PMID: 33706671 Free PMC article. - Therapeutic regulation of autophagy in hepatic metabolism.
Byrnes K, Blessinger S, Bailey NT, Scaife R, Liu G, Khambu B. Byrnes K, et al. Acta Pharm Sin B. 2022 Jan;12(1):33-49. doi: 10.1016/j.apsb.2021.07.021. Epub 2021 Jul 28. Acta Pharm Sin B. 2022. PMID: 35127371 Free PMC article. Review. - The Lysosome and Intracellular Signalling.
Hesketh GG, Wartosch L, Davis LJ, Bright NA, Luzio JP. Hesketh GG, et al. Prog Mol Subcell Biol. 2018;57:151-180. doi: 10.1007/978-3-319-96704-2_6. Prog Mol Subcell Biol. 2018. PMID: 30097775 Review.
Cited by
- Berberine-induced TFEB deacetylation by SIRT1 promotes autophagy in peritoneal macrophages.
Zheng Y, Kou J, Wang P, Ye T, Wang Z, Gao Z, Cong L, Li M, Dong B, Yang W, Li Q, Li H, Wang R, Yang L. Zheng Y, et al. Aging (Albany NY). 2021 Feb 26;13(5):7096-7119. doi: 10.18632/aging.202566. Epub 2021 Feb 26. Aging (Albany NY). 2021. PMID: 33639613 Free PMC article. - Nano Silver-Induced Toxicity and Associated Mechanisms.
Zhang J, Wang F, Yalamarty SSK, Filipczak N, Jin Y, Li X. Zhang J, et al. Int J Nanomedicine. 2022 Apr 26;17:1851-1864. doi: 10.2147/IJN.S355131. eCollection 2022. Int J Nanomedicine. 2022. PMID: 35502235 Free PMC article. Review. - Nutrient regulation of mTORC1 at a glance.
Condon KJ, Sabatini DM. Condon KJ, et al. J Cell Sci. 2019 Nov 13;132(21):jcs222570. doi: 10.1242/jcs.222570. J Cell Sci. 2019. PMID: 31722960 Free PMC article. Review. - RNA editing alterations define manifestation of prion diseases.
Kanata E, Llorens F, Dafou D, Dimitriadis A, Thüne K, Xanthopoulos K, Bekas N, Espinosa JC, Schmitz M, Marín-Moreno A, Capece V, Shormoni O, Andréoletti O, Bonn S, Torres JM, Ferrer I, Zerr I, Sklaviadis T. Kanata E, et al. Proc Natl Acad Sci U S A. 2019 Sep 24;116(39):19727-19735. doi: 10.1073/pnas.1803521116. Epub 2019 Sep 6. Proc Natl Acad Sci U S A. 2019. PMID: 31492812 Free PMC article.
References
- Nnah IC, Khayati K, Dobrowolski R. Cellular metabolism and lysosomal mTOR signaling. Cell Death Ther. 2015;1:11–22.
Publication types
MeSH terms
Substances
LinkOut - more resources
Full Text Sources
Other Literature Sources
Molecular Biology Databases
Research Materials
Miscellaneous
