Autophagy regulates lipid metabolism through selective turnover of NCoR1 - PubMed (original) (raw)
doi: 10.1038/s41467-019-08829-3.
Akiko Kuma 2 3 4, Yuki Sugiura 4 5, Yoshinobu Ichimura 1, Miki Obata 1, Hiroshi Kitamura 6, Shujiro Okuda 7, Hyeon-Cheol Lee 8, Kazutaka Ikeda 9, Yumi Kanegae 10, Izumu Saito 11 12, Johan Auwerx 13, Hozumi Motohashi 6, Makoto Suematsu 5, Tomoyoshi Soga 14, Takehiko Yokomizo 8, Satoshi Waguri 15, Noboru Mizushima 2, Masaaki Komatsu 16 17
Affiliations
- PMID: 30952864
- PMCID: PMC6450892
- DOI: 10.1038/s41467-019-08829-3
Autophagy regulates lipid metabolism through selective turnover of NCoR1
Tetsuya Saito et al. Nat Commun. 2019.
Abstract
Selective autophagy ensures the removal of specific soluble proteins, protein aggregates, damaged mitochondria, and invasive bacteria from cells. Defective autophagy has been directly linked to metabolic disorders. However how selective autophagy regulates metabolism remains largely uncharacterized. Here we show that a deficiency in selective autophagy is associated with suppression of lipid oxidation. Hepatic loss of Atg7 or Atg5 significantly impairs the production of ketone bodies upon fasting, due to decreased expression of enzymes involved in β-oxidation following suppression of transactivation by PPARα. Mechanistically, nuclear receptor co-repressor 1 (NCoR1), which interacts with PPARα to suppress its transactivation, binds to the autophagosomal GABARAP family proteins and is degraded by autophagy. Consequently, loss of autophagy causes accumulation of NCoR1, suppressing PPARα activity and resulting in impaired lipid oxidation. These results suggest that autophagy contributes to PPARα activation upon fasting by promoting degradation of NCoR1 and thus regulates β-oxidation and ketone bodies production.
Conflict of interest statement
The authors declare no competing interests.
Figures
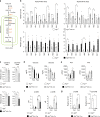
Fig. 1
Decreased lipid-oxidation in autophagy-deficient livers. a Enzymes involved in lipid catabolism, and representative metabolites produced by the enzymes. b Levels of acylcarnitines in livers of 5-week-old Atg7 f/f;Alb-Cre (n = 5) as well as of 12-week-old Atg5 f/f;Mx1-Cre (n = 3) mice, relative to those in the corresponding age-matched control mice, Atg7 f/f (n = 5) and Atg5 f/f (n = 3). At the age of 10 weeks, Atg5 f/f and Atg5 f/f;Mx1-Cre mice were intraperitoneally injected with pIpC to delete Atg5 in the liver. c Relative levels of carnitines in livers of mice described in b. d–f Blood glucose (d), free-fatty acid (e), and β-OHB (f) in mice described in b. g Tracer study using [13C] palmitate. pIpC-injected Atg5 f/f and Atg5 f/f;Mx1-Cre mice were starved for 24 h and administered [13C] palmitate 1 h before sacrifice. Total (left graph) and 13C-labeled (right graph) β-OHB were analyzed by liquid chromatography–tandem mass spectrometry. The experiments were performed three times. Data are means ± s.e.m. *P < 0.05, **P < 0.01, and ***P < 0.001 as determined by Welch’s _t_-test
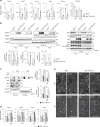
Fig. 2
Accumulation of NCoR1 and inactivation of PPARα in autophagy-deficient livers. a Gene expression of enzymes related to lipid oxidation in _Atg7_-deficient livers. Total RNAs were prepared from livers of Atg7 f/f (n = 4) and Atg7 f/f;Alb-Cre (n = 4) mice aged at 5 weeks under both fed and fasting conditions. Values were normalized against the amount of mRNA in the livers of fasting Atg7 f/f mice. The experiments were performed three times. b PPARα and NCoR1 level in _Atg7_-deficient mouse livers. Total homogenate, as well as nuclear and cytoplasmic fractions, were prepared from livers of Atg7 f/f and Atg7 f/f;Alb-Cre mice aged 5 weeks, and subjected to immunoblotting with the indicated antibodies. Bar graphs indicate the quantitative densitometric analyses of indicated cytoplasmic and nuclear proteins relative to Gapdh and Lamin B, respectively. c Immunoblot analysis. Primary hepatocytes were isolated from Atg7 f/f mice and infected with adenovirus for GFP or Cre-recombinase. Forty-eight hours after infection, the cells were cultured under nutrient-rich and ketogenic conditions for 24 h, and then both nuclear and cytoplasmic fractions were prepared from the cells and subjected to immunoblotting with the indicated antibodies. Data are representative of three separate experiments. Bar graphs indicate the quantitative densitometric analyses of cytoplasmic and nuclear NCoR1 relative to Gapdh and Lamin B, respectively. d Total RNAs were prepared from cells described in c. Values were normalized against the amount of mRNA in adenovirus-uninfected Atg7 f/f primary hepatocytes. The experiments were performed three times. e Immunohistofluorescence microscopy. Liver sections of Atg7 f/f and Atg7 f/f;Alb-Cre mice aged 5 weeks were immunostained with anti-NCoR1 antibody. Arrowheads indicate intranuclear signals for NCoR1. Bars: 50 μm. Data are means ± s.e.m. *P < 0.05, **P < 0.01, and ***P < 0.001 as determined by Welch’s _t_-test
Fig. 3
Decreased H3K27ac deposition on promoter regions of PPARα targets in autophagy-incompetent cells. a Immunoblot analysis. Both nuclear and cytoplasmic fractions were prepared from three independent _ATG7_-knockout HepG2 cells and subjected to immunoblotting with the indicated antibodies. Data are representative of three separate experiments. b Real-time PCR analysis. Total RNAs were prepared from parental HepG2 and _ATG7_-deficient HepG2 (#14) cells. Values were normalized against the amount of mRNA in parental HepG2 cells. The experiments were performed three times. c H3K27ac deposition was compared between wild-type and _ATG7_- knockout HepG2 cells (#4) by ChIP assay at indicated genomic regions. _GATA1_-ex3 and NQO1 promoter regions were used as negative and positive controls, respectively. Data are average ± s.e.m. from four independent experiments. Statistical analysis was performed by Welch’s _t_-test. *P < 0.05, and **P < 0.01
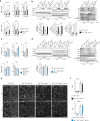
Fig. 4
NCoR1-dependent PPARα-inactivation in autophagy-incompetent cells. a, c Immunoblot analysis. Parental and _ATG7_-knockout HepG2 cells (#14) were treated with siRNA for p62 (a) and NCoR1 (c). Thereafter, both nuclear and cytoplasmic fractions were prepared and subjected to immunoblotting with the indicated antibodies. Data are representative of three separate experiments. Bar graphs indicate the quantitative densitometric analyses of cytoplasmic and nuclear NCoR1 relative to Gapdh and Lamin B, respectively. b, d Real-time PCR analysis. Total RNAs were prepared from cells described in b and d. Values were normalized against the amount of mRNA in parental HepG2 cells treated with control siRNA. The experiments were performed three times. e Immunoblot analysis. GFP or NCoR1 was exogenously expressed in wild-type and _NCoR1_-knockout HepG2 cells using the adenovirus system. Forty-eight hours after infection, both nuclear and cytoplasmic fractions were prepared from cells and subjected to immunoblotting with the indicated antibodies. Data shown are representative of three separate experiments. Bar graphs indicate the quantitative densitometric analyses of cytoplasmic and nuclear NCoR1 relative to Gapdh and Lamin B, respectively. f Real-time PCR analysis. Total RNAs were prepared from cells described in e. Values were normalized against the amount of mRNA in GFP-expressing wild-type HepG2 cells. The experiments were performed three times. Data are means ± s.e.m. *P < 0.05, **P < 0.01, and ***P < 0.001 as determined by Welch’s _t_-test
Fig. 5
NCoR1-dependent PPARα-inactivation in autophagy-deficient livers. a, c Gene expression of enzymes related to lipid oxidation in Atg7 p62 double- (a) and Atg7 p62 NCoR1 triple-knockout livers (c). Total RNAs were prepared from livers of Atg7 f/f;p62 f/f (fed: n = 3; fasted: n = 5), Atg7 f/f;p62 f/f;Alb-Cre (fed: n = 3; fasted: n = 4), Atg7 f/f;p62 f/f;NCoR1 f/f (fed: n = 4; fasted: n = 4), and Atg7 f/f;p62 f/f;NCoR1 f/f;Alb-Cre (fed: n = 4; fasted: n = 4) mice aged 5 weeks under both fed and fasting conditions. Values were normalized against the amount of mRNA in the livers of fasting Atg7 f/f;p62 f/f or Atg7 f/f;p62 f/f;NCoR1 f/f mice. The experiments were performed three times. b, d NCoR1 level in Atg7 p62 double- (b) and Atg7 p62 NCoR1 triple-knockout livers (d). Total homogenate, as well as nuclear and cytoplasmic fractions, were prepared from livers of mice of the indicated genotypes and subjected to immunoblotting with the indicated antibodies. Bar graphs indicate the quantitative densitometric analyses of indicated cytoplasmic and nuclear proteins relative to Gapdh and Lamin B, respectively. e Immunohistofluorescence microscopy. Liver sections of Atg7 f/f;p62 f/f, Atg7 f/f;p62 f/f;Alb-Cre, Atg7 f/f;p62 f/f;NCoR1 f/f, and Atg7 f/f;p62 f/f;NCoR1 f/f;Alb-Cre mice aged 5 weeks were immunostained with anti-NCoR1 antibody. Arrowheads indicate intranuclear signals for NCoR1. Bars: 50 μm. f Blood β-OHB in mice described in a. Data are means ± s.e.m. *P < 0.05, **P < 0.01, and ***P < 0.001 as determined by Welch’s _t_-test
Fig. 6
Degradation of NCoR1 in autophagy-lysosomal pathway. a Immunoblot analysis. Both nuclear and cytoplasmic fractions were prepared from _ATG7_-knockdown HepG2 cells under nutrient-rich and deprived conditions and subjected to immunoblotting with the indicated antibodies. Data are representative of three separate experiments. Bar graphs indicate the quantitative densitometric analyses of cytoplasmic and nuclear NCoR1 relative to Gapdh and Lamin B, respectively. b Immunoblot analysis. HepG2 cells were cultured in the presence or absence of E64d and Pepstatin A (E.P.) for 24 h. Subsequently, both nuclear and cytoplasmic fractions were prepared from the HepG2 cells and subjected to immunoblotting with the indicated antibodies. Data are representative of three separate experiments. Bar graphs indicate the quantitative densitometric analyses of cytoplasmic and nuclear NCoR1 relative to Gapdh and Lamin B, respectively. c Immunoblot analysis. GFP, wild-type ATG7, or ATG7C572S was expressed in _ATG7_-knockout HepG2 (#14) cells by adenovirus system. Forty-eight hours after infection, the cells were cultured under nutrient-rich or -deprived conditions. Thereafter, both nuclear and cytoplasmic fractions were prepared and subjected to immunoblotting with the indicated antibodies. Data shown are representative of three separate experiments. Bar graphs indicate the quantitative densitometric analyses of cytoplasmic and nuclear NCoR1 relative to Gapdh and Lamin B, respectively. d Oxygen consumption rate (OCR). OCR of ATG7 −/− HepG2 cells (#14) expressing GFP or wild-type ATG7 in β-oxidation assay medium was measured using a Seahorse XF24 Extracellular Flux Analyzer. Etomoxir (final concentration 40 μM) was added to the cells after baseline measurement in assay medium. Arrows indicate the time when etomoxir was added to the cells. The graphs represent the average OCR at four time points. Data are means ± s.e.m. *P < 0.05, **P < 0.01, and ***P < 0.001 as determined by Welch’s _t_-test
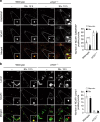
Fig. 7
Localization of NCoR1 on GABARAP-positive structures. a, b Immunofluorescence analysis. Wild-type or _ATG7_-deficient HepG2 cells were cultured under nutrient-rich or -poor conditions, and then immunostained with anti-GABARAP and anti-NCoR1 (a) or anti-Lamp1 and anti-NCoR1 antibodies (b). The number of cytoplasmic NCoR1 and GABARAP or of cytoplasmic NCoR1 and Lamp1 double-positive dots per 20 cells was counted. The experiments were performed three times. Data are means ± s.e.m. ***P < 0.001 as determined by Welch’s _t_-test. Each inset is a magnified image. Bar: 2.5 μm
Fig. 8
Specific interaction of NCoR1 with GABARAP. a Pull-down assay. One-Strep-FLAG (OSF)-tagged LC3B or GABARAP family proteins were expressed in HEK293T cells. Precipitates generated with Strep-Tactin Sepharose were subjected to immunoblot analysis with indicated antibodies. ULK1 and p62 bind to GABARAP family and all Atg8 family proteins, respectively, and were therefore used as positive controls. Data are representative of three independent experiments. b Diagrams of the deletion-mutation constructs of NCoR1 (left panel) and the corresponding pull-down assays (middle and right panels). Middle panel: Each FLAG-tagged NCoR1-deletion mutant and OSF-GABARAP was co-expressed in HEK293T cells. At 48 h post-transfection, lysates were prepared and precipitated with Strep-Tactin Sepharose. Right panel: OSF-GABARAP immobilized on Strep-Tactin Sepharose was mixed with lysates prepared from cells expressing each NCoR1-deletion mutant. The resultant precipitates were subjected to immunoblotting with anti-FLAG antibody. Data are representative of three independent experiments. c Alignment of the LC3-interacting region (LIR)/GABARAP-interacting motif (GIM) of NCoR1 homologs in various species. Black and gray boxes indicate identical amino-acid residues with complete and partial conservation, respectively. d Pull-down assay. OSF-GABARAP and FLAG-NCoR1 or NCoR1 ΔLIR/GIM were co-expressed in HEK293T cells. The assay was carried out as described in a
Fig. 9
Autophagic degradation of NCoR1 dependent on the GABARAP-interaction. Immunoblot analysis. FLAG-NCoR1 or NCoR1 ΔLIR/GIM was expressed in _NCoR1_-knockout HepG2 cells. Forty-eight hours after transfection, the cells were cultured in nutrient-rich medium, or nutrient-deprived medium. Thereafter, cytoplasmic and nuclear fractions were prepared and subjected to immunoblotting with the indicated antibodies. Data are representative of three independent experiments. Bar graphs indicate the quantitative densitometric analyses of cytoplasmic and nuclear FLAG-NCoR1 and FLAG-NCoR1 ΔLIR/GIM relative to Gapdh and Lamin B, respectively. b Immunofluorescence analysis. FLAG-NCoR1 or NCoR1 ΔLIR/GIM was expressed in _NCoR1_-deficient HepG2 cells. Forty-eight hours after transfection, the cells were cultured in nutrient-rich medium, or nutrient-deprived medium for 6 h and then immunostained with anti-NCoR1 antibody. To label lysosomes, the cells were incubated with Lyso Tracker Deep Red (50 nM final) for 2 h before the immunostaining. c Real-time PCR analysis. Total RNAs were prepared from cells described in a. Values were normalized against the amount of mRNA in _NCoR1_-deficient HepG2 cells expressing FLAG. The experiments were performed three times. d Model of PPARα transactivation through selective autophagic degradation of NCoR1. Data are means ± s.e.m. *P < 0.05, **P < 0.01, and ***P < 0.001 as determined by Welch’s _t_-test
Similar articles
- Loss of autophagy impairs physiological steatosis by accumulation of NCoR1.
Takahashi SS, Sou YS, Saito T, Kuma A, Yabe T, Sugiura Y, Lee HC, Suematsu M, Yokomizo T, Koike M, Terai S, Mizushima N, Waguri S, Komatsu M. Takahashi SS, et al. Life Sci Alliance. 2019 Dec 26;3(1):e201900513. doi: 10.26508/lsa.201900513. Print 2020 Jan. Life Sci Alliance. 2019. PMID: 31879337 Free PMC article. - Chaperone-mediated autophagy dysregulation during aging impairs hepatic fatty acid oxidation via accumulation of NCoR1.
Choi YJ, Yun SH, Yu J, Mun Y, Lee W, Park CJ, Han BW, Lee BH. Choi YJ, et al. Mol Metab. 2023 Oct;76:101784. doi: 10.1016/j.molmet.2023.101784. Epub 2023 Jul 29. Mol Metab. 2023. PMID: 37524243 Free PMC article. - The class 3 PI3K coordinates autophagy and mitochondrial lipid catabolism by controlling nuclear receptor PPARα.
Iershov A, Nemazanyy I, Alkhoury C, Girard M, Barth E, Cagnard N, Montagner A, Chretien D, Rugarli EI, Guillou H, Pende M, Panasyuk G. Iershov A, et al. Nat Commun. 2019 Apr 5;10(1):1566. doi: 10.1038/s41467-019-09598-9. Nat Commun. 2019. PMID: 30952952 Free PMC article. - Molecular mechanisms and physiological roles of Atg5/Atg7-independent alternative autophagy.
Arakawa S, Honda S, Yamaguchi H, Shimizu S. Arakawa S, et al. Proc Jpn Acad Ser B Phys Biol Sci. 2017;93(6):378-385. doi: 10.2183/pjab.93.023. Proc Jpn Acad Ser B Phys Biol Sci. 2017. PMID: 28603209 Free PMC article. Review. - PPARα and NCOR/SMRT corepressor network in liver metabolic regulation.
Kang Z, Fan R. Kang Z, et al. FASEB J. 2020 Jul;34(7):8796-8809. doi: 10.1096/fj.202000055RR. Epub 2020 May 12. FASEB J. 2020. PMID: 32396271 Review.
Cited by
- Autophagy deficiency promotes triple-negative breast cancer resistance to T cell-mediated cytotoxicity by blocking tenascin-C degradation.
Li ZL, Zhang HL, Huang Y, Huang JH, Sun P, Zhou NN, Chen YH, Mai J, Wang Y, Yu Y, Zhou LH, Li X, Yang D, Peng XD, Feng GK, Tang J, Zhu XF, Deng R. Li ZL, et al. Nat Commun. 2020 Jul 30;11(1):3806. doi: 10.1038/s41467-020-17395-y. Nat Commun. 2020. PMID: 32732922 Free PMC article. - Transcriptional changes impact hepatic proteome in autophagy-impaired liver.
Baral K, Joshi S, Lopez A, Mugon G, Chanda A, Chandrasheker AA, Hinton C, Thapa K, Mercer A, Spade L, Liu G, Bhetwal BP, Fang J, Khambu B. Baral K, et al. FEBS Open Bio. 2024 Nov;14(11):1851-1863. doi: 10.1002/2211-5463.13898. Epub 2024 Sep 16. FEBS Open Bio. 2024. PMID: 39284785 Free PMC article. - Pleiotropic Effects of mTOR and Autophagy During Development and Aging.
Schmeisser K, Parker JA. Schmeisser K, et al. Front Cell Dev Biol. 2019 Sep 11;7:192. doi: 10.3389/fcell.2019.00192. eCollection 2019. Front Cell Dev Biol. 2019. PMID: 31572724 Free PMC article. Review. - Dietary regulation in health and disease.
Wu Q, Gao ZJ, Yu X, Wang P. Wu Q, et al. Signal Transduct Target Ther. 2022 Jul 23;7(1):252. doi: 10.1038/s41392-022-01104-w. Signal Transduct Target Ther. 2022. PMID: 35871218 Free PMC article. Review. - p21-activated kinase 4 suppresses fatty acid β-oxidation and ketogenesis by phosphorylating NCoR1.
Shi MY, Yu HC, Han CY, Bang IH, Park HS, Jang KY, Lee S, Son JB, Kim ND, Park BH, Bae EJ. Shi MY, et al. Nat Commun. 2023 Aug 17;14(1):4987. doi: 10.1038/s41467-023-40597-z. Nat Commun. 2023. PMID: 37591884 Free PMC article.
References
- Karsli-Uzunbas G, et al. Autophagy is required for glucose homeostasis and lung tumor maintenance. Cancer Discov. 2014;4:914–927. doi: 10.1158/2159-8290.CD-14-0363. - DOI - PMC - PubMed
Publication types
MeSH terms
Substances
LinkOut - more resources
Full Text Sources
Molecular Biology Databases
Research Materials


