TIPE2 specifies the functional polarization of myeloid-derived suppressor cells during tumorigenesis - PubMed (original) (raw)
TIPE2 specifies the functional polarization of myeloid-derived suppressor cells during tumorigenesis
Dehong Yan et al. J Exp Med. 2020.
Abstract
Myeloid-derived suppressor cells (MDSCs) are "polarized" myeloid cells that effectively promote tumorigenesis by inhibiting antitumor immunity. How myeloid cells acquire the protumoral properties during tumorigenesis is poorly understood. We report here that the polarity protein TIPE2 (tumor necrosis factor-α-induced protein 8-like 2) mediates the functional polarization of murine and human MDSCs by specifying their pro- and antitumoral properties. Tumor cells induced the expression of TIPE2 in Gr1+CD11b+ cells through reactive oxygen species (ROS). TIPE2 in turn increased the expression of protumoral mediators such as CCAAT/enhancer-binding protein-β while inhibiting the expression of antitumoral mediators. Consequently, tumor growth in TIPE2-deficient mice was significantly diminished, and TIPE2-deficient MDSCs markedly inhibited tumor growth upon adoptive transfer. Pharmaceutical blockade of ROS inhibited TIPE2 expression in MDSCs and reduced tumor growth in mice. These findings indicate that TIPE2 plays a key role in the functional polarization of MDSCs and represents a new therapeutic target for cancer immunotherapy.
© 2019 Yan et al.
Figures
Graphical abstract
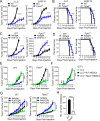
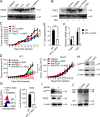
Figure 1.
TIPE2 deficiency significantly reduced tumor growth in mice in an MDSC-dependent manner. (A and B) Tumor growth curve (A) and mouse survival rate (B) of WT and Tipe2−/− C57BL/6 mice (n = 10 mice/group) injected s.c. on day 0 with LLC lung carcinoma or B16F10 melanoma cells as indicated. (C and D) Tumor growth curve (C) and mouse survival rate (D) of WT and Tipe2−/− C57BL/6 mice (n = 10 mice/group) injected s.c. on day 0 with LLC lung carcinoma cells and that received i.p. injections of either anti-Gr-1 (RB6-8C5) or isotype control antibody once every 3 d. (E) Tumor growth in WT (left) and Tipe2−/− (middle) mice (n = 6 mice/group) injected s.c. on day 0 with LLC cells alone or coinjected with LLC cells plus purified splenic MDSCs from WT or Tipe2−/− mice, mixed at a 1:1 ratio. (F) Tumor growth in WT mice (n = 6 mice/group) injected s.c. on day 0 with LLC cells, with or without subsequent i.v. injections, on days 3 and 6, of splenic WT or Tipe2−/− MDSCs as indicated. (G) Tumor growth in WT and Tipe2−/− C57BL/6 mice (n = 10 mice/group) injected s.c. on day 0 with LLC cells and that received i.p. injections of anti-CD4, anti-CD8, or isotype control antibodies twice every week. (H) Number of lung tumors assessed 14 d after i.v. injection of B16F10 cells into WT and Tipe2−/− C57BL/6 mice (n = 8 mice/group). Results are pooled from three (A–D, G, and H) or two (E and F) independent experiments. Error bars show means ± SEM. Unpaired Student’s t test was used for A, C, and E–H. The log-rank test was used for B and D. *, P < 0.05; **, P < 0.01; ***, P < 0.001; ****, P < 0.0001.
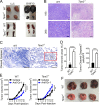
Figure S1.
Impact of TIPE2 deletion on tumor growth, necrosis, and metastasis and spleen size. (A) Representative pictures of tumors and spleens of WT and Tipe2−/− mice bearing LLC lung carcinoma or B16F10 melanoma. Scale bars, 50 mm. (B) H&E-stained sections of LLC tumors from WT and Tipe2−/− mice on day 17. Scale bars, 100 µm. (C) Cleaved caspase 3 expression in B16F10 tumors from WT and Tipe2−/− mice on day 17 as determined by IHC (400×; scale bars, 100 µm). The rectangle shows cleaved caspase 3+ areas of B16F10 tumors from Tipe2−/− mice. (D) Quantification of the necrotic areas of LLC tumors from WT and Tipe2−/− mice as shown in B and number of cleaved caspase 3+ cells in B16F10 tumors from WT and Tipe2−/− mice as shown in C. More necrosis was observed in the Tipe2−/− group than in the WT group. (E) Tumor growth curve of WT and Tipe2−/− C57BL/6 mice (n = 10 mice per group) injected s.c. on day 0 with B16F10 cells and that received i.p. injections of either anti-Gr-1 (RB6-8C5) or isotype control antibody once every 3 d. Means ± SEM are shown. Results are pooled from three independent experiments. (F) Representative pictures of lung tumors assessed 14 d after i.v. injection of B16F10 melanoma cells into WT and Tipe2−/− C57BL/6 mice. Scale bars, 50 mm. Results are from a representative experiment of three (A–D and F). Unpaired Student’s t test for D and E. **, P < 0.01; ***, P < 0.001; ****, P < 0.0001.
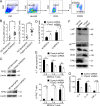
Figure 2.
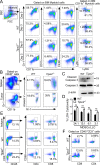
TIPE2 conferred the immunosuppressive function of MDSCs. (A) Percentages of indicated leukocyte subsets among live cells isolated from tumors of WT and Tipe2−/− mice injected s.c. on day 0 with LLC cells and that received i.p. injections, starting on day 7, of either anti-Gr-1 (RB6-8C5) or isotype control antibody once every 3 d, as determined by flow cytometry 17 d after LLC cell injection. Leukocytes were CD45+; MDSCs were CD45+CD11b+Gr-1+; G-MDSCs were CD45+CD11b+Ly6G+Ly6Clow; M-MDSCs were CD45+CD11b+Ly6G_−Ly6Chigh; DCs were CD45+CD11b+CD11c+; macrophages were CD45+CD11b+F4/80+; CD3+ T cells were CD45+CD3+NK1.1_−; CD4+ T cells were CD45+CD3+CD4+CD8−; CD8+ T cells were CD45+CD3+CD4_−_CD8+; B cells were CD45+CD3_−_CD19+; and NK cells were CD45+CD3_−_NK1.1+. Gating strategies are shown in Fig. S2, A and B. (B) Percentages of MDSCs (CD11b+Gr-1+CD45+) in BM, spleen, lung, and liver of WT and Tipe2−/− mice 17 d after LLC cell injection. (C) BM cells isolated from WT and Tipe2−/− mice were cultured in the presence of GM-CSF for 3 d. The percentages of the indicated myeloid subsets before (day 0) and after the in vitro culture (day 3) were determined by flow cytometry. Gating strategies are shown in Fig. S3 A. (D) Percentages of annexin V+ MDSCs in the spleens and tumors of WT and Tipe2−/− mice 17 d after LLC cell injection. (E) Percentages of CD69+CD4+ T cells and CD69+CD8+ T cells among CD45+CD3+ cells isolated from tumors of WT and Tipe2−/− mice injected s.c. with LLC cells 17 d earlier, as determined by flow cytometry. (F) Percentages of IFNγ-expressing CD8+ and CD4+ T cells among splenic CD45+CD3+ cells of WT and Tipe2−/− mice injected s.c. with B16F10 cells 16 d earlier, as determined by flow cytometry. Cells were activated in vitro with anti-CD3 and anti-CD28 for 48 h before testing. (G) Percentage of T cell suppression (left) and IFNγ-expressing T cells (right) in co-cultures of MDSCs and CFSE-labeled CD3+ T cells at the indicated ratios, as determined by flow cytometry. MDSCs were isolated from spleens of WT and Tipe2−/− mice injected s.c. with LLC cells 17 d earlier. (H) Percentage of T cell suppression (left) and IFNγ-expressing T cells (right) in co-cultures of CFSE-labeled CD3+ T cells and WT or Tipe2 knockdown (Tipe2 siRNA) MDSCs at an MDSC:T cell ratio of 1:4, as determined by flow cytometry. MDSCs were generated from the BM of C57BL/6 mice and treated with pLKO.1-TRC-Tipe2 siRNA lentivirus (for Tipe2 siRNA group) or control siRNA lentivirus (for WT group) before testing. Representative results from three independent experiments are shown (n = 6 mice/group; A–H). Results are expressed as mean ± SEM. Unpaired Student’s t test for A–H. *, P < 0.05; **, P < 0.01; ***, P < 0.001; ****, P < 0.0001; ns, not significant.
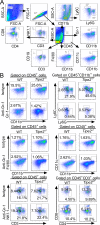
Figure S2.
Flow cytometry analyses of leukocytes and the effect of anti-Gr-1 treatment in mice. (A) Representative flow cytometry plots illustrating the gating strategy used in Fig. 2 (A and B). (B) Representative flow cytometry results showing tumor-infiltrating leukocyte subsets from WT and Tipe2−/− mice treated with isotype control or anti-Gr-1 antibody on day 17 after LLC cell injection, as shown in Fig. 2 A. FSC, forward scatter. SSC, side scatter.
Figure S3.
Impact of TIPE2 deletion on MDSC precursor differentiation, apoptosis, and function. (A) Representative flow cytometry results showing percentages of the indicated myeloid subsets among WT and Tipe2−/− BM cells before and after 3-d culture in the presence of GM-CSF, as in Fig. 2 C. (B) Representative flow cytometry results showing annexin V+ MDSCs in the spleens and tumors of WT and Tipe2−/− mice 17 d after LLC cell injection as in Fig. 2 D. (C) Levels of cleaved and total caspase 3 of MDSCs in the tumors of WT and Tipe2−/− mice 17 d after LLC cell injection, as determined by immunoblotting. (D) Results from lactate dehydrogenase (LDH) cytotoxicity assay after co-culturing LLC tumor cells for 6 h with tumor-derived MDSCs from WT and Tipe2−/− mice. (E) Representative flow cytometry results showing CD69+CD4+ and CD69+CD8+ T cells among CD45+CD3+ cells of tumors from WT and Tipe2−/− mice bearing LLC tumors on day 17. (F) Representative flow cytometry results showing IFNγ-expressing splenic CD8+ and CD4+ T cells among CD45+CD3+ cells from WT and Tipe2−/− mice bearing B16F10 tumors on day 16. Representative results from three experiments are shown (A–F, n = 6 mice/group). Unpaired Student’s t test for D. Error bars represent means ± SEM; ns, not significant. FSC, forward scatter; SSC, side scatter.
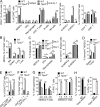
Figure 3.
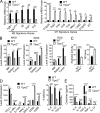
TIPE2 specified gene expression patterns of MDSCs. (A) RT-qPCR analyses of mRNA abundance of M1 or M2 signature genes in WT and Tipe2−/− MDSCs isolated by FACS from the tumors of C57BL/6 mice that were injected s.c. with B16F10 cells 16 d earlier (n = 3 mice/group). PCR values were normalized to the internal β-actin signal. The values of the Tipe2−/− MDSCs were set as 1 (left), and the values of the WT MDSCs were set as 1 (right). (B) Flow cytometry analysis of mean fluorescence intensity (× 102) of the indicated proteins in WT and Tipe2−/− MDSCs isolated by FACS from the tumors, BM, and spleens of C57BL/6 mice that were injected s.c. with LLC cells 17 d earlier (n = 6 samples per group). (C) Arginase enzyme activity (U/liter) and NO levels (μmol/liter) of MDSCs isolated by FACS from the tumors of C57BL/6 mice that were injected s.c. with LLC cells 17 d earlier. (D) The mean fluorescence intensity and percentages of MDSCs expressing the indicated proteins as determined by flow cytometry. MDSCs were isolated by FACS from the tumors of WT and Tipe2−/− C57BL/6 mice that were injected s.c. with B16F10 cells 17 d earlier. They were stimulated with LPS (1 µg/ml) for 6 h before the test. (E) Cytokine abundance as determined by ELISA in the whole-cell extracts of MDSCs isolated by FACS from the tumors of WT and Tipe2−/− C57BL/6 mice that were injected s.c. with B16F10 cells 16 d earlier. Data are means ± SEM pooled from three independent experiments (A and B) or from one representative of three independent experiments (C–E, n = 6 samples per group). Unpaired student t test for A–E. *, P < 0.05; **, P < 0.01; ***, P < 0.001; ****, P < 0.0001; ns, not significant.
Figure S4.
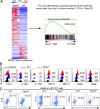
Impact of TIPE2 deletion on gene expression and protein expression in tumor-infiltrating MDSCs. (A) RNA-seq experiments were performed on tumor MDSCs isolated from WT and Tipe2−/− mice (all bearing B16F10 tumors of ∼1,500 mm3, n = 3 mice/group). Left: Heatmap of 333 differentially expressed genes. Right: M1 signature gene set was queried on the MDSC gene expression using GSEA to reveal the increase of M1 signature genes in Tipe2−/− tumor MDSCs. (B) Flow cytometry analysis for the indicated markers of tumor-derived MDSCs from WT and Tipe2−/− mice. (C) Flow cytometry analysis for the percentages of IL-6+, IL-10+, and TGF-β+ MDSCs isolated from tumors of WT and Tipe2−/− B16F10 tumor-bearing mice, after stimulation in vitro with LPS (1 µg/ml) for 6 h. Results are from a representative experiment of three (B and C; n = 6 mice/group).
Figure 4.
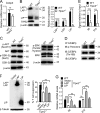
TIPE2 controlled MDSC function through C/EBPβ. (A and B) C/EBPβ expression as determined by RT-qPCR (A) and immunoblotting (B) in MDSCs isolated from tumors of WT and Tipe2−/− C57BL/6 mice that were injected s.c. with B16F10 cells 16 d earlier. Right graph of B shows levels of C/EBPβ LAP, LAP*, and LIP proteins as determined by densitometry. Data are means ± SEM pooled from three independent experiments (n = 6 mice per group per experiment). Molecular weights: LAP* = 38 kD; LAP = 34 kD; LIP = 20 kD. (C) Expression levels of the indicated proteins as determined by immunoblotting in MDSCs isolated from tumors of WT and Tipe2−/− C57BL/6 mice that were injected s.c. with B16F10 cells 16 d earlier. (D) Abundance of the indicated molecules as determined by immunoblotting (IB) in the immunoprecipitates (IP) of WT and Tipe2−/− MDSCs isolated from the spleens of B16F10 tumor-bearing mice; the immunoprecipitates were collected with protein G agarose beads after incubating the MDSC lysates with anti-C/EBPβ. (E) ChIP PCR analyses of the Il6 and Il10 promoter regions with anti-C/EBPβ for tumor-derived WT and Tipe2−/− MDSCs isolated from B16F10 tumor-bearing mice. (F and G) C/EBPβ–LAP rescue of the functional deficiency of Tipe2−/− MDSCs. (F) Left: Immunoblot analysis of HEK293T cells treated with or without pLVX-IRES-ZsGreen1/LAP (pLVX-LAP), pLVX-IRES-ZsGreen1/ LIP (pLVX-LIP), or pLVX-IRES-ZsGreen1 (pLVX- Vector) viruses. Right: Percentage of T cell suppression mediated by WT MDSCs and Tipe2−/− MDSCs infected with pLVX-Vector control, pLVX-LAP, or pLVX-LIP lentiviruses at an MDSC:T cell ratio of 1:4. (G) RT-qPCR results of Il6 and Il10 gene expression levels in WT MDSCs and Tipe2−/− MDSCs infected with pLVX-Vector control, pLVX-LAP, or pLVX-LIP lentiviruses. All MDSCs were isolated from the spleens of B16F10 tumor-bearing mice 16 d after tumor cell injection. For C–G, data are means ± SEM and are from a representative experiment of three; n = 6 mice per group. Unpaired Student’s t test for A, B, and E–G. *, P < 0.05; ***, P < 0.001; ****, P < 0.0001; ns, not significant.
Figure 5.
IL-6–mediated rescue of the functional deficiency of Tipe2−/− MDSCs. (A) Expression levels of the indicated proteins in WT and Tipe2−/− tumor-derived MDSCs as determined by immunoblotting (left) and densitometric analysis of the immunoblots (right). (B) Histograms of CD126 and CD130 expression by CD45+CD11b+Gr-1+ tumor-derived MDSCs from WT and Tipe2−/− B16F10 tumor-bearing mice. (C) Tumor growth in WT and Tipe2−/− mice injected with mock or IL-6–expressing B16F10 cells. (D) T cell suppression by tumor-derived MDSCs from WT and Tipe2−/− mice injected s.c. with mock or IL-6–expressing B16F10 cells, at an MDSC:T cell ratio of 1:4. (E) Expression levels of the indicated proteins as determined by immunoblotting in tumor-derived MDSCs from WT and Tipe2−/− mice injected s.c. with mock or IL-6–expressing B16F10 cells. Data are means ± SEM and are from a representative experiment of three; n = 6 mice per group (A, B, D, and E) or n = 10 mice per group (C). Unpaired Student’s t test for A–D. ***, P < 0.001; ****, P < 0.0001; ns, not significant.
Figure 6.
Tumor-derived ROS-induced TIPE2 expression in MDSCs. (A) TIPE2 expression in BM-derived MDSCs cultured for 24 h in medium alone or medium containing 40% TES, IL-6 (40 ng/ml), hydrogen peroxide (H2O2; 250 mM), and
l
-arginine (1 mM). TES was collected after culturing B16F10 tumor cells overnight at 1 × 10⁷ cells/ml. (B) TIPE2 expression in BM-derived MDSCs cultured with or without 40% TES, 1 mM L-NAC (ROS inhibitor), 100 µM L-NMMA (arginase I inhibitor), or 100 µM nor-NOHA (iNOS inhibitor). (C) B16F10 tumor growth in WT and Tipe2−/− mice treated i.p. once a day with PBS or 1.5 mg/mouse L-NAC (n = 10 mice per group). (D) Tumor growth in WT and Tipe2−/− mice injected s.c. on day 0 with B16F10 cells and treated i.p. once a day with PBS or 1.5 mg/mouse L-NAC and that received, starting on day 7, i.p. injections of anti-PD-1 antibodies or isotype control antibodies twice a week for 2 wk (n = 10 mice per group). (E) T cell suppression by tumor-derived MDSCs from PBS- or L-NAC–treated B16F10 tumor-bearing mice, at an MDSC:T cell ratio of 1:4 (n = 6 mice per group). (F) Tipe2 and Arg1 expression in tumor-derived MDSCs from B16F10 mice treated with PBS or L-NAC for 16 d (n = 6 mice per group). (G) Flow cytometry analysis of ROS in tumor-derived MDSCs from B16F10 mice treated with PBS or L-NAC for 16 d. Right graph shows means ± SEM, n = 6 mice per group. (H) Immunoblot for p47phox and TIPE2 in tumor-derived MDSCs from B16F10 mice treated with PBS or L-NAC for 16 d. (I) Immunoblot for p47phox and TIPE2 in B16F10 tumor-derived MDSCs treated with or without pLKO.1-TRC-p47phox shRNA lentiviruses (p47phox shRNA). (J) Expression of LAP, LAP*, and LIP in tumor-derived MDSCs from B16F10 mice treated with PBS or L-NAC for 16 d. Molecular weight: LAP* = 38 kD; LAP = 34 kD; LAP = 20 kD. Data are means ± SEM and are from a representative experiment of three (A–D and H–J) or from two independent experiments (E and F). Unpaired Student’s t test for C–G. **, P < 0.01; ***, P < 0.001; ****, P < 0.0001; ns, not significant.
Figure 7.
TIPE2 conferred immunosuppressive function of human MDSCs. (A) Representative flow cytometry plots illustrating the gating strategy to show human MDSCs, monocytes, and neutrophils from PBMCs of lung cancer patients and HDs. Human neutrophils and G-MDSCs were HLA-DR−/lowCD33+CD14−/lowCD66b+; human monocytes and M-MDSCs were HLA-DR−/lowCD33+CD14+CD66b_−_. FSC, forward scatter; SSC, side scatter. (B) Percentages of indicated patient MDSC subsets and HD monocytes or neutrophils among HLA-DR_−_CD33+ cells of lung cancer patients and HDs, as determined by flow cytometry. (C) TIPE2 expression in indicated patient MDSC subsets and HD monocytes or neutrophils from PBMCs of lung cancer patients and HDs. Results are from a representative experiment of three (A–C). HD, n = 5; patients, n = 11 (A–C). (D–G) PBMCs from lung cancer patients were cultured in the presence of human GM-CSF and IL-6 for 2 d. HLA-DR_−_CD33+ eMDSCs were infected with control or human TIPE2 (hTIPE2) shRNA-encoding lentiviruses and cultured for 2 additional days with GM-CSF and IL-6. (D) Percentages of indicated human MDSC subsets among cultured PBMC-derived HLA-DR_−_CD33+ cells, as determined by flow cytometry. (E) Percentage of T cell suppression (upper panel) and IFNγ-expressing T cells (lower panel) in co-cultures of HLA-DR−/lowCD33+CD14−/lowCD66b+ G-MDSCs and CFSE-labeled human CD3+ T cells at the indicated ratios, as determined by flow cytometry. G-MDSCs were isolated from PBMC cultures. (F) Expression levels of the indicated proteins as determined by immunoblotting in G-MDSCs isolated from PBMC cultures. (G) Cytokine abundance as determined by ELISA in the human G-MDSC culture supernatant among PBMC cultures. Data are means ± SEM from one representative of three independent experiments (D–G; n = 6 samples per group). Multiple unpaired Student’s t test for B; unpaired Student’s t test for D, E, and G. *, P < 0.05; **, P < 0.01; ***, P < 0.001; ns, not significant.
Figure 8.
Lung cancer patients with high-TIPE2 MDSCs have poor long-term survival. (A) Left: Representative mIHC images of a lung cancer patient with low TIPE2 expression in HLA-DR−/lowCD33+CD11b+CD14−/lowCD66b+ G-MDSCs (with 1–15% cells positive for TIPE2) who was still alive 64 mo after surgery. Right: Representative mIHC images of a lung cancer patient with high TIPE2 expression in HLA-DR−/lowCD33+CD11b+CD14−/lowCD66b+ G-MDSCs (with >15% cells positive for TIPE2) who died 22 mo after surgery. TIPE2 high-expressing G-MDSCs are marked by arrows. Nuclei were stained with DAPI. Scale bars, 100 µm. (B) Kaplan–Meier analysis of cumulative survival rates of lung cancer patients subdivided by TIPE2 expression in HLA-DR−/lowCD33+CD11b+CD14−/lowCD66b+ G-MDSCs. Statistical significance was assessed using log-rank test (P = 0.013). TIPE2 low expression, n = 58; TIPE2 high expression, n = 17; no TIPE2 expression, n = 17. The percentages of TIPE2 expression in HLA-DR−/lowCD33+CD11b+CD14−/lowCD66b+ G-MDSCs of all patients (n = 92) are listed in Fig. S5 B.
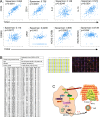
Figure S5.
Relationship between TIPE2 expression and lung cancer patient survival, or T cell response to cancer . (A) Correlation between TIPE2 expression and various MDSC-associated surface markers or genes in human lung adenocarcinoma samples from The Cancer Genome Atlas dataset (n = 230). Spearman’s rank correlation coefficients and the corresponding P values are indicated. (B) Top: Clinical-pathological characteristics of human lung cancer specimens (n = 92) used in this study. Bottom: TIPE2 expression in HLA-DR−/lowCD33+CD11b+CD14−/lowCD66b+ G-MDSCs and survival time of lung cancer patients (n = 92). TIPE2 low expression (1–15% cells were positive for TIPE2), n = 58; TIPE2 high expression (>15% cells were positive for TIPE2), n = 17; no TIPE2 expression (<1% cells were positive for TIPE2), n = 17. S, survived; D, died. Right middle: Arrangement of the lung cancer tissue array (HLugA180Su03) and mIHC merged images of lung cancer tissues of 92 patients (carcinoma samples: blue dots, n = 92; carcinoma adjacent samples: yellow dots, n = 88). (C) A model of TIPE2 control of immunosuppressive function of MDSCs and T cell–dependent responses to cancer.
Similar articles
- Direction of leukocyte polarization and migration by the phosphoinositide-transfer protein TIPE2.
Fayngerts SA, Wang Z, Zamani A, Sun H, Boggs AE, Porturas TP, Xie W, Lin M, Cathopoulis T, Goldsmith JR, Vourekas A, Chen YH. Fayngerts SA, et al. Nat Immunol. 2017 Dec;18(12):1353-1360. doi: 10.1038/ni.3866. Epub 2017 Oct 23. Nat Immunol. 2017. PMID: 29058702 Free PMC article. - Expression of the B-cell receptor component CD79a on immature myeloid cells contributes to their tumor promoting effects.
Luger D, Yang YA, Raviv A, Weinberg D, Banerjee S, Lee MJ, Trepel J, Yang L, Wakefield LM. Luger D, et al. PLoS One. 2013 Oct 16;8(10):e76115. doi: 10.1371/journal.pone.0076115. eCollection 2013. PLoS One. 2013. PMID: 24146823 Free PMC article. - Gene delivery of TIPE2 attenuates collagen-induced arthritis by modulating inflammation.
Zhou J, Chen P, Li Z, Zuo Q. Zhou J, et al. Int Immunopharmacol. 2020 Feb;79:106044. doi: 10.1016/j.intimp.2019.106044. Epub 2019 Dec 18. Int Immunopharmacol. 2020. PMID: 31863922 - Understanding the roles of negative immune regulator TIPE2 in different diseases and tumourigenesis.
Li Z, Jia W, Niu J, Zhang L. Li Z, et al. Histol Histopathol. 2018 Sep;33(9):919-928. doi: 10.14670/HH-11-977. Epub 2018 Feb 26. Histol Histopathol. 2018. PMID: 29480508 Review. - Research progress of TIPE2 in immune-related diseases.
Gao J, Zhang H, Zhang F. Gao J, et al. Int Immunopharmacol. 2023 Aug;121:110514. doi: 10.1016/j.intimp.2023.110514. Epub 2023 Jun 20. Int Immunopharmacol. 2023. PMID: 37348234 Review.
Cited by
- Friend or Foe? Recent Strategies to Target Myeloid Cells in Cancer.
Chaib M, Chauhan SC, Makowski L. Chaib M, et al. Front Cell Dev Biol. 2020 May 19;8:351. doi: 10.3389/fcell.2020.00351. eCollection 2020. Front Cell Dev Biol. 2020. PMID: 32509781 Free PMC article. Review. - Targeting Inhibition of Accumulation and Function of Myeloid-Derived Suppressor Cells by Artemisinin via PI3K/AKT, mTOR, and MAPK Pathways Enhances Anti-PD-L1 Immunotherapy in Melanoma and Liver Tumors.
Zhang M, Wang L, Liu W, Wang T, De Sanctis F, Zhu L, Zhang G, Cheng J, Cao Q, Zhou J, Tagliabue A, Bronte V, Yan D, Wan X, Yu G. Zhang M, et al. J Immunol Res. 2022 Jun 22;2022:2253436. doi: 10.1155/2022/2253436. eCollection 2022. J Immunol Res. 2022. PMID: 35785030 Free PMC article. - Myeloid-derived suppressor cells in hematologic malignancies: two sides of the same coin.
Yu S, Ren X, Li L. Yu S, et al. Exp Hematol Oncol. 2022 Jul 19;11(1):43. doi: 10.1186/s40164-022-00296-9. Exp Hematol Oncol. 2022. PMID: 35854339 Free PMC article. Review. - Regulating Histone Deacetylase Signaling Pathways of Myeloid-Derived Suppressor Cells Enhanced T Cell-Based Immunotherapy.
Adeshakin AO, Adeshakin FO, Yan D, Wan X. Adeshakin AO, et al. Front Immunol. 2022 Jan 24;13:781660. doi: 10.3389/fimmu.2022.781660. eCollection 2022. Front Immunol. 2022. PMID: 35140716 Free PMC article. Review. - An Integrated Deep Learning and Molecular Dynamics Simulation-Based Screening Pipeline Identifies Inhibitors of a New Cancer Drug Target TIPE2.
Zhang H, Li J, Saravanan KM, Wu H, Wang Z, Wu D, Wei Y, Lu Z, Chen YH, Wan X, Pan Y. Zhang H, et al. Front Pharmacol. 2021 Nov 23;12:772296. doi: 10.3389/fphar.2021.772296. eCollection 2021. Front Pharmacol. 2021. PMID: 34887765 Free PMC article.
References
- Bronte V., Brandau S., Chen S.H., Colombo M.P., Frey A.B., Greten T.F., Mandruzzato S., Murray P.J., Ochoa A., Ostrand-Rosenberg S., et al. . 2016. Recommendations for myeloid-derived suppressor cell nomenclature and characterization standards. Nat. Commun. 7:12150 10.1038/ncomms12150 - DOI - PMC - PubMed
- Cheng P., Corzo C.A., Luetteke N., Yu B., Nagaraj S., Bui M.M., Ortiz M., Nacken W., Sorg C., Vogl T., et al. . 2008. Inhibition of dendritic cell differentiation and accumulation of myeloid-derived suppressor cells in cancer is regulated by S100A9 protein. J. Exp. Med. 205:2235–2249. 10.1084/jem.20080132 - DOI - PMC - PubMed
Publication types
MeSH terms
Substances
LinkOut - more resources
Full Text Sources
Other Literature Sources
Medical
Molecular Biology Databases
Research Materials

