TREM2 Alzheimer's variant R47H causes similar transcriptional dysregulation to knockout, yet only subtle functional phenotypes in human iPSC-derived macrophages - PubMed (original) (raw)
TREM2 Alzheimer's variant R47H causes similar transcriptional dysregulation to knockout, yet only subtle functional phenotypes in human iPSC-derived macrophages
Hazel Hall-Roberts et al. Alzheimers Res Ther. 2020.
Abstract
Background: TREM2 is a microglial cell surface receptor, with risk mutations linked to Alzheimer's disease (AD), including R47H. TREM2 signalling via SYK aids phagocytosis, chemotaxis, survival, and changes to microglial activation state. In AD mouse models, knockout (KO) of TREM2 impairs microglial clustering around amyloid and prevents microglial activation. The R47H mutation is proposed to reduce TREM2 ligand binding. We investigated cell phenotypes of the R47H mutant and TREM2 KO in a model of human microglia, and compared their transcriptional signatures, to determine the mechanism by which R47H TREM2 disrupts function.
Methods: We generated human microglia-like iPSC-macrophages (pMac) from isogenic induced pluripotent stem cell (iPSC) lines, with homozygous R47H mutation or TREM2 knockout (KO). We firstly validated the effect of the R47H mutant on TREM2 surface and subcellular localization in pMac. To assess microglial phenotypic function, we measured phagocytosis of dead neurons, cell morphology, directed migration, survival, and LPS-induced inflammation. We performed bulk RNA-seq, comparing significant differentially expressed genes (DEGs; p < 0.05) between the R47H and KO versus WT, and bioinformatically predicted potential upstream regulators of TREM2-mediated gene expression.
Results: R47H modified surface expression and shedding of TREM2, but did not impair TREM2-mediated signalling, or gross phenotypes that were dysregulated in the TREM2 KO (phagocytosis, motility, survival). However, altered gene expression in the R47H TREM2 pMac overlapped by 90% with the TREM2 KO and was characterised by dysregulation of genes involved with immunity, proliferation, activation, chemotaxis, and adhesion. Downregulated mediators of ECM adhesion included the vitronectin receptor αVβ3, and consequently, R47H TREM2 pMac adhered weakly to vitronectin compared with WT pMac. To counteract these transcriptional defects, we investigated TGFβ1, as a candidate upstream regulator. TGFβ1 failed to rescue vitronectin adhesion of pMac, although it improved αVβ3 expression.
Conclusions: The R47H mutation is not sufficient to cause gross phenotypic defects of human pMac under standard culture conditions. However, overlapping transcriptional defects with TREM2 KO supports the hypothesised partial loss-of-function effects of the R47H mutation. Furthermore, transcriptomics can guide us to more subtle phenotypic defects in the R47H cells, such as reduced cell adhesion, and can be used to predict targets for therapeutic intervention.
Keywords: Alzheimer’s disease; Human pluripotent stem cells; Inflammation; Macrophages; Microglia; Phagocytosis; R47H; Synaptosome; TREM2; iPSC.
Conflict of interest statement
The authors declare that they have no competing interests.
Figures
Fig. 1
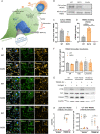
Reduced cell surface localization of R47H TREM2 does not impair antibody-mediated activation of TREM2 in pMac. a Schematic of microglia phenotypes investigated in this study. b, c Reduced cell surface expression of R47H TREM2. Cell surface proteins on pMac were biotinylated and pulled down, the level of TREM2 protein enrichment was measured by Western blotting vs whole cell lysate, probed on separate blots. c Means ± SEM, for N = 5 harvests measured on separate Western blots. 2-tailed paired t-test: ** p = 0.0011 for R47H versus WT. d Increased sTREM2 production from R47H TREM2 pMac. sTREM2 were measured from unstimulated pMac supernatants by ELISA. Means ± SEM, for N = 3 harvests measured on same ELISA plate, data for each harvest was normalised to the average cell count. 1-way ANOVA, with Dunnett’s post hoc test: p = 0.0005 R47H versus WT (***), p = 0.0066 KO versus WT (**). e, f Co-localization of TREM2 with subcellular compartment markers in fixed and permeabilized pMac, images are a confocal slice at 4 μm, taken with Opera Phenix microscope. Inset panels are × 3 magnification of a selected cell. Calnexin used as a marker for ER, TGN46 for TGN, and LAMP1 for lysosomes. f Co-localization expressed as a ratio of TREM2 intensity to compartment marker intensity, in regions automatically segmented by high marker staining. Means ± SEM, for N = 3 harvests, each in triplicate wells. 2-way ANOVA, with Bonferroni’s post hoc test, no significant differences. g, h TREM2-activating antibody stimulation (used at concentration of 2.4 μg/1 × 106 cells and 3.84 μg/mL, for 10 min) of both WT and R47H TREM2 pMac caused SYK phosphorylation, measured by Western blotting. No response seen in TREM2 antibody-stimulated TREM2 KO cells, or cells treated with a goat IgG isotype control. h Means ± SEM, for N = 3 harvests measured on separate Western blots. 2-way ANOVA, with Sidak’s post hoc test, pairwise comparisons to WT for each treatment: p < 0.001 for KO stimulated with TREM2 Ab versus WT (****). i Calcium response in response to TREM2 antibody is similar in WT and R47H TREM2 pMac, measured by peak Fluo4-AM fluorescence, normalised to minimum fluorescence and cell number. Means ± SEM, for N = 3 harvests. 2-way ANOVA, with Dunnett’s multiple comparison test, pairwise comparisons to WT for each treatment: p = 0.0049 for KO stimulated with TREM2 Ab versus WT (**)
Fig. 2
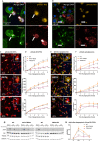
Phagocytosis of dead SH-SY5Ys and synaptosomes is reduced in TREM2 KO, but not R47H TREM2, relative to WT pMac. a After 3 h of phagocytosis of pHrodo-labelled dead SH-SY5Ys, immunofluorescence staining shows that TREM2 is highly recruited to the phagocytic cup (marked by white arrow) during engulfment of cells expressing the neuronal marker TUJ1, whereas in b TREM2 is lost before maturation to RAB9+ endosomes (marked by white arrow). c–f Phagocytosis is impaired in TREM2 KO pMac only. Representative images of phagocytosis of SH-SY5Ys (c) or synaptosomes (e) shown in yellow, by pMac (red cytoplasm and blue nucleus), taken at 3 h with INCell 6000. Inset is a section of the image magnified 3-fold. d, f Means were quantified for the parameters: number of spots per cell, sum of spot areas (μm2) per cell, percentage of cells containing phagocytosed particles per field. Data was normalised to mean for each genotype per experiment. Means ± SEM, for N = 3 harvests. Repeated-measures 2-way ANOVA, Dunnett’s post hoc test, pairwise comparisons to the WT for each time: *p < 0.05, **p < 0.01, ***p < 0.001. g, h Phagocytosis of dead SH-SY5Ys results in SYK phosphorylation, which is unaffected in R47H TREM2 cells but attenuated in TREM2 KO line, measured by Western blotting at 0.5, 1, and 2 h after phagocytosis initiation. h Means ± SEM, for N = 3 harvests. Repeated-measures 2-way ANOVA, with Dunnett’s post hoc test, pairwise comparisons to the WT for each time: p = 0.0008 at 0.5 h stimulation for KO versus WT (***)
Fig. 3
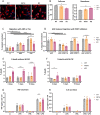
Divergent phenotypes in TREM2 KO and R47H TREM2 pMac, regarding cell morphology, migration, survival, and inflammatory responses. a, b TREM2 KO pMac are smaller and rounder than WT. Cell morphology measured by microscopy of pMac stained with CellTracker Deep Red, cells were fixed and imaged on INCell 6000 microscope. Representative images shown (a), and mean cell area (μm2) and roundness were automatically quantified from 9 fields per well in triplicate wells using Columbus software (b). Means ± SEM, for N = 3 harvests. 1-way ANOVA with Dunnett’s post hoc test: p = 0.019 for cell area in KO versus WT (*), p = 0.007 for roundness in KO versus WT (**). c, d TREM2 KO pMac migrate slower towards C5a, but not ADP, compared with WT. Cell migration measured by transwell assay. Migration of pMac towards 30 μM ADP or 3 nM C5a is compared to unstimulated migration over 6 h (c), and inhibitors used to unmask the contribution of purinergic receptors P2RY1 (3 μM MRS2179), P2RY12 (30 μM PSB0739), and P2RY13 (10 μM MRS2211) to ADP-induced migration (d). Data is expressed as the percentage of migrated cells and was normalised to average migration for the harvest. Means ± SEM, for N = 4 harvests. 2-way ANOVA with Dunnett’s post hoc test. Black annotations compare stimulation to unstimulated control, or ADP + purinergic inhibitors to the ADP-only control. Grey annotations compare R47H or KO versus WT for each stimulation. * p < 0.05, ** p < 0.01, *** p < 0.001, **** p < 0.0001, all unannotated comparisons are not significant. e, f TREM2 KO pMac exhibit increased cell death in the absence of M-CSF, whereas WT and R47H pMac remain viable. Survival after M-CSF withdrawal measured at 3, 7, and 10 days, with a comparison between M-CSF-deficient condition (e) to full-media controls (f) in the same plate. Means ± SEM, for N = 3 harvests. Repeated-measures 2-way ANOVA, with Dunnett’s post hoc test, pairwise comparisons to WT for each time: M-CSF-deficient KO versus WT at 3 days p = 0.0051 (**), at 7 days p = 0.003 (**), and at 10 days p = 0.0001 (***). Full media KO versus WT at 3 days p = 0.035 (*). g, h Comparable secretion of TNF and IL-6 by pMac in response to E. coli LPS (100 ng/mL, 4 h) ± priming by interferon-γ (100 ng/mL, 24 h prior to LPS). Concentration of TNF (g) and IL-6 (h) was measured by separate ELISAs of the same supernatants, normalised to cell number, and normalised to the average pg/mL/cell for the harvest. Means ± SEM, for N = 4 harvests. 2-way ANOVA, with Dunnett’s post hoc test, pairwise comparisons to WT for each stimulation: p = 0.0097 for TNF secreted from R47H versus WT with LPS ± IFNγ stimulation (**). As expected, IFNγ-priming enhances TNF and IL-6 secretion upon LPS stimulation, significance is not depicted for clarity, but p < 0.001 for IFNγ+LPS versus LPS, for TNF and IL-6 of all genotypes
Fig. 4
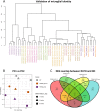
Transcriptomics reveal high overlap in dysregulated genes of R47H TREM2 and TREM2 KO pMac, relative to WT. a Validation of pMac “microglial identity” by dendrogram comparison to Abud et al. transcriptomes of iPS cells, iPSC-haematopoietic progenitor cells (iHPC), iPSC-microglia-like cells (iMGL), iMGL without TGFβ1 or without CD200 supplementation, iMGL co-cultured with rat cortical neurons, blood-derived monocytes, blood-derived dendritic cells, and primary foetal and adult human microglia [42]. b Plot of principal component analysis (PCA) with the first two principal components separating the RNA-seq samples by differentiation age and genotype. Ages represented by shapes, and genotypes represented by colour. c Venn diagram of differentially expressed genes (DEGs) identified relative to the WT line, showing the overlap between R47H TREM2 and TREM2 KO DEGs. DEGs are separately categorised as “upregulated” or “downregulated” relative to the WT
Fig. 5
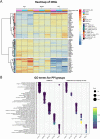
Top DEGs of R47H TREM2 and TREM2 KO pMac overlap; furthermore, the R47H DEGs that are shared with TREM2 KO represent numerous biological processes, distributed between five protein-protein interaction (PPI) modules. a Heatmap of top upregulated and top downregulated DEGs for R47H TREM2 and TREM2 KO, with the relative expression for each gene represented by colours on the corresponding row. A selection of “relevant genes” was also included. Unbiased clustering (dendrogram on the left) shows that genes separate into two major clusters based on whether they are upregulated or downregulated in TREM2 KO or R47H TREM2, and there is no genotype-specific segregation. b Five modules of functionally related DEGs identified by PPI network analysis of TREM2 KO DEGs, with enriched gene ontology (GO) terms shown. R47H DEGs were only included where they were also differentially expressed in TREM2 KO and were overlaid onto clusters identified using TREM2 KO data. Clusters identified numerically on the _x_-axis, with TREM2 KO on the left and R47H TREM2 on the right, showing a similar pattern of dysregulated cell functions. Number of DEGs represented by circle size, and p value represented by colour
Fig. 6
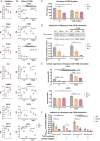
Extracellular matrix-adhesion modifiers and adhesion to vitronectin are dysregulated in R47H TREM2 and TREM2 KO pMac. TGFβ treatment does not rescue adhesion deficits. a Validation of selected RNA-seq hits by qRT-PCR of unstimulated pMac. Means ± SEM, for N = 7 harvests, including the 3 samples originally used for RNA-seq (open symbols) plus 4 samples harvested independently from a separate differentiation (filled symbols). Repeated-measures 1-way ANOVA, with Dunnett’s post hoc test, pairwise comparisons to the WT. b Effect of TGFβ-stimulation (50 ng/mL, 24 h) on mRNA levels of selected RNA-seq hits, measured by qRT-PCR. Means ± SEM, for N = 3 samples harvested independently to Fig. 5a. Two-way ANOVA, with Sidak’s post hoc test. c TREM2 KO pMac secrete reduced levels of TGFβ1 compared with WT, and TGFβ1 secretion is partly SYK-dependent. Total (inactive and active) TGFβ1 measured from supernatants by ELISA, cells treated ± OXSI-2 (2 μM, 24 h) to inhibit SYK. Means ± SEM, for N = 3 harvests. Two-way ANOVA, with Sidak’s post hoc test. d Fibronectin protein expression is reduced in both R47H TREM2 and TREM2 KO versus WT. Fibronectin measured by Western blotting of pMac ± TGFβ1 stimulation (50 ng/mL, 24 h). Means ± SEM, quantified for N = 3 harvests on separate blots. Two-way ANOVA, with Sidak’s post hoc test. TGFβ1 vs unstimulated was not significant. e αVβ3 complex formation is reduced in both R47H TREM2 and TREM2 KO versus WT. Intact surface integrins αVβ3 and αVβ5 measured by flow cytometry in pMac ± TGFβ1 stimulation (50 ng/mL, 24 h). Data is expressed as the difference in median fluorescence intensity of the specific antibody versus isotype control, normalised (by subtraction) to the average for the harvest. Means ± SEM, for N = 3 harvests. Two-way ANOVA, with Sidak’s post hoc test. f Adhesion to vitronectin is reduced for both R47H TREM2 and TREM2 KO versus WT, and treatment with TGFβ (50 ng/mL, 24 h prior to assay) increases αVβ3/5-dependent adhesion. Adhesion measured after 3 h by crystal violet colorimetric assay, and normalised to BSA-blocked wells (by division, and the result subtracted from 1). αVβ3/5 inhibitor (10 μM cilengitide) was added at the start of the assay to determine αVβ3/5-specific adhesion to vitronectin (striped bars). Means ± SEM, for N = 3 harvests. Two-way ANOVA, with Dunnett’s post hoc test. Black annotations compare stimulations to unstimulated control. Grey annotations compare R47H or KO versus WT for each condition. WT = grey circles, R47H = orange squares, TREM2 KO = burgundy triangles. *p < 0.05, **p < 0.01, ***p < 0.001, ****p < 0.0001, all unannotated comparisons are not significant
Similar articles
- Depressing time: Waiting, melancholia, and the psychoanalytic practice of care.
Salisbury L, Baraitser L. Salisbury L, et al. In: Kirtsoglou E, Simpson B, editors. The Time of Anthropology: Studies of Contemporary Chronopolitics. Abingdon: Routledge; 2020. Chapter 5. In: Kirtsoglou E, Simpson B, editors. The Time of Anthropology: Studies of Contemporary Chronopolitics. Abingdon: Routledge; 2020. Chapter 5. PMID: 36137063 Free Books & Documents. Review. - AD-linked R47H-TREM2 mutation induces disease-enhancing microglial states via AKT hyperactivation.
Sayed FA, Kodama L, Fan L, Carling GK, Udeochu JC, Le D, Li Q, Zhou L, Wong MY, Horowitz R, Ye P, Mathys H, Wang M, Niu X, Mazutis L, Jiang X, Wang X, Gao F, Brendel M, Telpoukhovskaia M, Tracy TE, Frost G, Zhou Y, Li Y, Qiu Y, Cheng Z, Yu G, Hardy J, Coppola G, Wang F, DeTure MA, Zhang B, Xie L, Trajnowski JQ, Lee VMY, Gong S, Sinha SC, Dickson DW, Luo W, Gan L. Sayed FA, et al. Sci Transl Med. 2021 Dec;13(622):eabe3947. doi: 10.1126/scitranslmed.abe3947. Epub 2021 Dec 1. Sci Transl Med. 2021. PMID: 34851693 Free PMC article. - Amelioration of signaling deficits underlying metabolic shortfall in TREM2R47H human iPSC-derived microglia.
Vasilopoulou F, Piers TM, Wei J, Hardy J, Pocock JM. Vasilopoulou F, et al. FEBS J. 2024 Dec 26. doi: 10.1111/febs.17353. Online ahead of print. FEBS J. 2024. PMID: 39726135 - Comparison of Two Modern Survival Prediction Tools, SORG-MLA and METSSS, in Patients With Symptomatic Long-bone Metastases Who Underwent Local Treatment With Surgery Followed by Radiotherapy and With Radiotherapy Alone.
Lee CC, Chen CW, Yen HK, Lin YP, Lai CY, Wang JL, Groot OQ, Janssen SJ, Schwab JH, Hsu FM, Lin WH. Lee CC, et al. Clin Orthop Relat Res. 2024 Dec 1;482(12):2193-2208. doi: 10.1097/CORR.0000000000003185. Epub 2024 Jul 23. Clin Orthop Relat Res. 2024. PMID: 39051924 - Impact of residual disease as a prognostic factor for survival in women with advanced epithelial ovarian cancer after primary surgery.
Bryant A, Hiu S, Kunonga PT, Gajjar K, Craig D, Vale L, Winter-Roach BA, Elattar A, Naik R. Bryant A, et al. Cochrane Database Syst Rev. 2022 Sep 26;9(9):CD015048. doi: 10.1002/14651858.CD015048.pub2. Cochrane Database Syst Rev. 2022. PMID: 36161421 Free PMC article. Review.
Cited by
- Generation of an hiPSC-Derived Co-Culture System to Assess the Effects of Neuroinflammation on Blood-Brain Barrier Integrity.
Bull D, Schweitzer C, Bichsel C, Britschgi M, Gutbier S. Bull D, et al. Cells. 2022 Jan 26;11(3):419. doi: 10.3390/cells11030419. Cells. 2022. PMID: 35159229 Free PMC article. - INPP5D modulates TREM2 loss-of-function phenotypes in a β-amyloidosis mouse model.
Iguchi A, Takatori S, Kimura S, Muneto H, Wang K, Etani H, Ito G, Sato H, Hori Y, Sasaki J, Saito T, Saido TC, Ikezu T, Takai T, Sasaki T, Tomita T. Iguchi A, et al. iScience. 2023 Mar 13;26(4):106375. doi: 10.1016/j.isci.2023.106375. eCollection 2023 Apr 21. iScience. 2023. PMID: 37035000 Free PMC article. - Role of Vitronectin and Its Receptors in Neuronal Function and Neurodegenerative Diseases.
Ruzha Y, Ni J, Quan Z, Li H, Qing H. Ruzha Y, et al. Int J Mol Sci. 2022 Oct 16;23(20):12387. doi: 10.3390/ijms232012387. Int J Mol Sci. 2022. PMID: 36293243 Free PMC article. Review. - iPSC-derived microglia carrying the TREM2 R47H/+ mutation are proinflammatory and promote synapse loss.
Penney J, Ralvenius WT, Loon A, Cerit O, Dileep V, Milo B, Pao PC, Woolf H, Tsai LH. Penney J, et al. Glia. 2024 Feb;72(2):452-469. doi: 10.1002/glia.24485. Epub 2023 Nov 15. Glia. 2024. PMID: 37969043 - Pharmacological Inhibition of Spleen Tyrosine Kinase Suppressed Neuroinflammation and Cognitive Dysfunction in LPS-Induced Neurodegeneration Model.
Kim MW, Choe K, Park JS, Lee HJ, Kang MH, Ahmad R, Kim MO. Kim MW, et al. Cells. 2022 May 28;11(11):1777. doi: 10.3390/cells11111777. Cells. 2022. PMID: 35681471 Free PMC article.
References
Publication types
MeSH terms
Substances
Grants and funding
- MR/L023784/1/MRC_/Medical Research Council/United Kingdom
- G0900747 91070/MRC_/Medical Research Council/United Kingdom
- 090532/Z/09/Z/WT_/Wellcome Trust/United Kingdom
- MR/M024962/1/MRC_/Medical Research Council/United Kingdom
- G0900747/MRC_/Medical Research Council/United Kingdom
- MC_PC_16034/MRC_/Medical Research Council/United Kingdom
- J-0901/PUK_/Parkinson's UK/United Kingdom
- WT_/Wellcome Trust/United Kingdom
- MC_EX_MR/N50192X/1/MRC_/Medical Research Council/United Kingdom
- 203141/Z/16/Z/WT_/Wellcome Trust/United Kingdom
- MR/N013255/1/MRC_/Medical Research Council/United Kingdom
LinkOut - more resources
Full Text Sources
Medical
Molecular Biology Databases
Research Materials
Miscellaneous
