PRMT1 promotes the tumor suppressor function of p14ARF and is indicative for pancreatic cancer prognosis - PubMed (original) (raw)
. 2021 Jul 1;40(13):e106777.
doi: 10.15252/embj.2020106777. Epub 2021 May 17.
Daniela Happel 1, Caroline Bouchard 1, Marion Meixner 1, Yesim Verel-Yilmaz 2, Hartmann Raifer 3 4, Lena Holembowski 1, Eberhard Krause 5, Elisabeth Kremmer 6, Regina Feederle 7, Corinna U Keber 8, Michael Lohoff 4, Emily P Slater 2, Detlef K Bartsch 2, Uta-Maria Bauer 1
Affiliations
- PMID: 33999432
- PMCID: PMC8246066
- DOI: 10.15252/embj.2020106777
PRMT1 promotes the tumor suppressor function of p14ARF and is indicative for pancreatic cancer prognosis
Antje Repenning et al. EMBO J. 2021.
Abstract
The p14ARF protein is a well-known regulator of p53-dependent and p53-independent tumor-suppressive activities. In unstressed cells, p14ARF is predominantly sequestered in the nucleoli, bound to its nucleolar interaction partner NPM. Upon genotoxic stress, p14ARF undergoes an immediate redistribution to the nucleo- and cytoplasm, where it promotes activation of cell cycle arrest and apoptosis. Here, we identify p14ARF as a novel interaction partner and substrate of PRMT1 (protein arginine methyltransferase 1). PRMT1 methylates several arginine residues in the C-terminal nuclear/nucleolar localization sequence (NLS/NoLS) of p14ARF . In the absence of cellular stress, these arginines are crucial for nucleolar localization of p14ARF . Genotoxic stress causes augmented interaction between PRMT1 and p14ARF , accompanied by arginine methylation of p14ARF . PRMT1-dependent NLS/NoLS methylation promotes the release of p14ARF from NPM and nucleolar sequestration, subsequently leading to p53-independent apoptosis. This PRMT1-p14ARF cooperation is cancer-relevant and indicative for PDAC (pancreatic ductal adenocarcinoma) prognosis and chemotherapy response of pancreatic tumor cells. Our data reveal that PRMT1-mediated arginine methylation is an important trigger for p14ARF 's stress-induced tumor-suppressive function.
Keywords: apoptosis; arginine methylation; pancreatic cancer; post-translational modification; tumor suppression.
© 2021 The Authors. Published under the terms of the CC BY NC ND 4.0 license.
Conflict of interest statement
The authors declare that they have no conflict of interest.
Figures
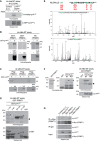
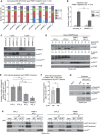
Figure 1. Arginine methylation of p14ARF by PRMT1
- For in vivo methyltransferase (MT) assay, HEK293 cells were transfected with either empty vector (e.v., control) or EGFP‐tagged p14ARF‐containing plasmid. Subsequently, cells were treated with the global methyltransferase inhibitor adenosine dialdehyde, AdOx (+) or left untreated (−) for 72 h and then cultured in the presence of L‐[3H‐methyl]‐methionine. Cell lysates were subjected to α‐GFP immunoprecipitation (IP) and then assayed by fluorography (upper panel) and immunoblotting using α‐GFP antibody (lower panel). EGFP‐epitope tagged p14ARF typically migrated as a doublet band, indicated by the bracket. Corresponding Appendix Fig S1 confirms p14ARF overexpression in the cell lysates and hypomethylation caused by AdOx treatment.
- Recombinant GST‐tagged substrates (p14ARF, GAR) and PRMT1/PRMT4 enzyme purified from bacteria or PRMT5 overexpressed/immunoprecipitated from HeLa cells (HA‐tagged PRMT5/Myc‐tagged MEP50) were subjected to in vitro methyltransferase (MT) assays in the presence of [14C‐methyl]‐SAM. Reactions were separated by SDS–PAGE, blotted, and assayed by autoradiography. GST‐GAR, histone H3, and bulk histones served as a positive control for PRMT1, PRMT4, and PRMT5 activity, respectively. The two depicted negative controls (−) for PRMT1 are identical. The asterisks indicate the methylated p14ARF protein. Corresponding autoradiography results show representative images and derive from the same blots and exposure times with white lines indicating where tracks were cut. Size markers (in kDa) are shown on the right.
- Recombinant GST‐tagged p14ARF purified from bacteria and Flag‐tagged PRMT1, PRMT4, or PRMT5 enzyme purified from baculoviral infected Sf9 cells were subjected to in vitro methyltransferase (MT) assays in the presence of [14C‐methyl]‐SAM. Reactions were separated by SDS–PAGE, blotted and assayed by autoradiography. Histone proteins H4, H3 and bulk histones served as a positive control for PRMT1, PRMT4 and PRMT5 activity, respectively. The asterisk indicates the methylated p14ARF protein. Size markers (in kDa) are shown on the right.
- GST‐tagged full‐length ORF (aa 1–132) and deletion constructs (aa 1–64, aa 65–132, and aa 31–132) of p14ARF as well as GST alone were subjected to in vitro MT assays in the presence of GST‐PRMT1 as described in (B). Methylation activities were detected by autoradiography (upper panel). Asterisks indicate methylated p14ARF proteins, whereas the arrowhead marks p14ARF‐unrelated background signals (likely deriving from PRMT1 automethylation). Amounts of p14ARF proteins and GST alone were visualized by immunoblotting using α‐GST antibody (lower panel). Asterisks highlight the expected size and location of the different proteins. Size markers (in kDa) are shown on the left.
- NLS/NoLS of p14ARF (aa 85–101) is depicted at the top, with the PRMT1‐methylated arginine residues distinguished in green and mutations to glycine (G), phenylalanine (F), or lysine (K) in red. For mass spectrometry, GST‐tagged p14ARF (full‐length protein) was in vitro methylated by PRMT1, separated by SDS–PAGE, in‐gel digested with trypsin and analyzed by LC‐MS/MS. Fragment ion spectrum resulted from the doubly charged precursor ion of the R99‐methylated (upper panel) and the R96‐methylated (lower panel) p14ARF peptides showing y‐ions and b‐ions by consecutive fragmentation reactions. Relevant ions were labeled according to the accepted nomenclature. Dimethylation of R99 was confirmed by detection of methylated N‐terminal b‐ions and unmethylated C‐terminal y‐ions. Dimethylation of R96 was detected in the mass of the b7, y6 and y7 ions.
- Full‐length GST‐tagged wild‐type (wt) and RG mutant p14ARF protein, GST alone as well as GST‐PRMT1 were purified from bacteria, as visualized by SDS–PAGE and Coomassie Blue staining (left and middle panel), with asterisks indicating the corresponding PRMT1 and p14ARF protein bands. GST and GST‐p14ARF proteins (wt, RG) were subjected to in vitro MT assays in the presence of GST‐PRMT1 as described in (B). Methylation activities were detected subsequent to protein blotting by autoradiography (upper right panel). The asterisk highlights the methylated p14ARF wt protein, whereas the arrowhead indicates p14ARF‐unrelated background signals (likely deriving from PRMT1 automethylation). Amounts of p14ARF proteins were detected by immunostaining of the autoradiographed blot using α‐p14ARF antibody (lower right panel). Size markers (in kDa) are shown on the left.
- U2OS cells were transfected with the indicated plasmids (e.v., empty vector/control). Immunoprecipitation (IP) from cell lysates was performed using α‐Myc antibody (exogenous PRMT1) or IgG as negative control. IP reactions and input lysates were analyzed by immunoblotting using the indicated antibodies.
Source data are available online for this figure.
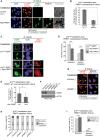
Figure 2. PRMT1‐dependent redistribution of nucleolar p14ARF
- A, B
HeLa cells were transfected with empty vector (e.v., control) or Myc‐tagged wild‐type PRMT1‐containing plasmid. Immunofluorescence (IF) staining was performed using α‐p14ARF (red, endogenous p14ARF), α‐Myc (green, exogenous PRMT1) antibodies, DAPI (blue, nuclei/DNA), and Phalloidin (gray, cytoplasm/F‐actin). In (A), representative IF results are shown, with asterisks indicating cells with exclusive nucleolar and arrowheads indicating cells with predominantly nucleo‐/cytoplasmic p14ARF localization. The merge displays the combination of p14ARF and PRMT1 staining. Scale bars: 15 μm. The quantification of exclusive nucleolar p14ARF was performed by cell counting (percentage of cells) and is shown for three independent experiments in (B) (mean ± SD). - C, D
U2OS cells were transfected with EGFP‐tagged p14ARF alone or in combination with Myc‐tagged wild‐type PRMT1‐containing plasmids. p14ARF‐EGFP (green), DAPI (blue, nuclei/DNA), and PRMT1 (red, using α‐Myc antibody) were visualized by fluorescence microscopy, for which representative results are shown in (C), with the lower images displaying a magnification as indicated in the upper images by the rectangles. Scale bars: 10 μm. The subcellular distribution of p14ARF‐EGFP (exclusively nucleolar or not‐exclusively nucleolar but predominantly nucleo‐/cytoplasmic) was quantified in p14ARF‐positive and p14ARF/Myc‐PRMT1‐double‐positive cells by cell counting (percentage of cells) for three independent experiments in (D) (mean ± SD, ***P ≤ 0.001 using Welch´s _t_‐test). - E
U2OS cells were transfected with EGFP‐tagged p14ARF alone or in combination with Myc‐tagged wild‐type (wt) or catalytically inactive (mut) PRMT1‐containing plasmids. The cellular distribution of p14ARF‐EGFP was quantified as in (D). The relocalization of p14ARF out of the nucleolus upon overexpression of PRMT1 (wt or mut) was determined by cell counting (percentage of cells) for four independent experiments (mean ± SD, *P ≤ 0.05 using the paired _t_‐test). - F–I
HeLa cells were transfected with the indicated siRNAs (two control/non‐targeting siRNAs and three PRMT1‐specific siRNAs). PRMT1 depletion was verified by immunoblotting using α‐PRMT1 and α‐β‐TUBULIN (loading control) antibodies ((F); depicted staining results derive from the same blot as well as exposure times with white lines indicating where tracks were cut). The cellular p14ARF distribution was determined by immunofluorescence staining (IF) using α‐p14ARF antibody. Representative IF images for the siControl_1 and siPRMT1_1 condition are shown in (G) (endogenous p14ARF in red and the merge additionally with DAPI in blue for nuclei/DNA). Scale bars: 15 μm. The subcellular localization of p14ARF (exclusively nucleolar or not‐exclusively nucleolar but predominantly nucleo‐/cytoplasmic) was quantified by cell counting (percentage of cells) for all used siRNAs in (H) and for siControl_1/siPRMT1_1 from three independent experiments in (I) (mean ± SD, ***P ≤ 0.001 using Welch´s _t_‐test).
Figure 3. Involvement of the PRMT1‐targeted arginines in p14ARF’s nucleolar localization
- A, B
U2OS cells were transfected with EGFP‐tagged wild‐type (wt) or mutant (RG, RF, RK) p14ARF‐containing plasmids. p14ARF‐EGFP (green), endogenous NPM as a nucleolar marker (red, using α‐NPM antibody), DAPI (blue, nuclei/DNA), and Phalloidin (gray, cytoplasm/F‐actin) were visualized by fluorescence microscopy, for which representative results are shown in (A). Scale bars: 10 μm. The subcellular distribution of p14ARF‐EGFP (exclusively nucleolar, not‐exclusively nucleolar but additionally nucleo‐/cytoplasmic or exclusively cytoplasmic) was quantified by cell counting (percentage of cells) for three independent experiments in (B) (mean ± SD, **P ≤ 0.005 using Welch´s _t_‐test). - C
U2OS cells were transfected with EGFP‐tagged wild‐type (wt) or mutant (RK) p14ARF, either alone or in combination with Myc‐tagged wild‐type PRMT1‐containing plasmids. Cells with predominant nucleo‐/cytoplasmic localization of p14ARF‐EGFP (for both wt and RK) were quantified in the absence or presence of PRMT1 overexpression, i.e., in p14ARF‐positive as well as p14ARF/Myc‐PRMT1‐double‐positive cells, by immunofluorescence staining and cell counting. Relocalization of p14ARF wt and RK into the nucleo/cytoplasm upon overexpression of PRMT1 was defined in percentage of cells for five independent experiments (mean ± SD). - D
HeLa cells were transfected with empty vector (e.v., control) or Myc‐tagged wild‐type PRMT1‐containing plasmid. Immunoprecipitation (IP) of endogenous p14ARF or NPM was performed from cell lysates using the corresponding antibodies or IgG as negative control. IP reactions and input lysates were analyzed by immunoblotting using the indicated antibodies. Staining results of the IP reactions derive from the same blot and exposure times with the white lines indicating where tracks were cut. - E
Indicated NLS/NoLS p14ARF peptides (aa 91–99 or aa 92–103) either unmodified or premodified (asymmetric dimethylation of R96 in peptide aa 91–99 and of R96/R99 in peptide aa 92–103) were covalently coupled to Sulfolink‐beads and incubated with recombinant, baculoviral purified Flag‐tagged NPM. Pull‐down reactions and input of NPM protein were resolved by SDS–PAGE and analyzed by α‐NPM immunoblotting.
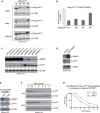
Figure 4. Influence of PRMT1 and PRMT1‐targeted arginines on p14ARF protein stability
- A, B
U2OS, HeLa, and HEK293 cells were transfected with Flag‐tagged wild‐type (wt) or mutant (RG, RF, RK) p14ARF‐containing plasmids. Overexpression was analyzed by immunoblotting using α‐Flag (exogenous p14ARF proteins) and α‐β‐TUBULIN (loading control) antibodies (A). As visualized here, p14ARF with the Flag‐epitope tagged reproducibly showed a clear migration difference between wt and mutant p14ARF proteins, with the mutants (especially the RK mutant) migrating slowlier than wt protein in the SDS–PAGE. The staining signals of the p14ARF bands were densitometrically quantified and normalized to the respective β‐TUBULIN signal, as specified by the numbers below the blots, with the protein signals of p14ARF wt set to 1. Transcript levels of wt and mutant p14ARF were determined by RT–qPCR in U2OS cells (B) as well as in HeLa and HEK293 cells (Appendix Fig S3B and C). Values were normalized to GAPDH expression and presented relative to wt p14ARF, mean ± SD of triplicates. - C
HeLa cells were transfected with the indicated siRNAs (five control/non‐targeting siRNAs and four PRMT1‐specific siRNAs). PRMT1 depletion and endogenous p14ARF protein levels were analyzed by immunoblotting using α‐PRMT1, α‐p14ARF and α‐β‐TUBULIN (loading control) antibodies. The p14ARF signals were densitometrically quantified and normalized to the respective β‐TUBULIN signal, as specified by the numbers below the blot, with the siControl_2 condition set to 1. Transcript levels of p14ARF were determined by RT–qPCR (Appendix Fig S3D). - D
HeLa cells were infected with recombinant adenovirus encoding GFP (control) or wild‐type PRMT1. PRMT1 overexpression and endogenous p14ARF protein levels were analyzed by immunoblotting using α‐PRMT1, α‐p14ARF, and α‐CDK2 (loading control) antibodies. The p14ARF signals were densitometrically quantified and normalized to the respective CDK2 signal, as specified by the numbers below the blot, with the control condition set to 1. - E–G
HeLa cells expressing a doxycycline‐inducible shRNA targeting PRMT1 were treated or not with doxycycline (Dox) for 6 days. PRMT1 depletion was monitored by immunoblotting using the indicated antibodies (E). The p14ARF signals were densitometrically quantified and normalized to the respective β‐TUBULIN signal, as specified by the numbers below the blot, with the ‐Dox condition set to 1. PRMT1‐proficient (−Dox) and PRMT1‐depleted cells (+Dox) were further treated with the protein synthesis inhibitor cycloheximide (CHX) and harvested after 0, 0.5, 1, 2, 3, 4, and 6 h. Cell lysates were subjected to immunoblotting using α‐p14ARF and α‐β‐TUBULIN (loading control) antibodies and conventional ECL detection (F). For precise quantification of the p14ARF protein stability in the −/+ Dox conditions during the CHX time course, immunoblotting was performed with independent cell lysates and primary antibodies, as in (F), which were then detected using fluorescence dye‐coupled secondary antibodies and the LI‐COR Odyssey system. The quantitative p14ARF signals were normalized to the corresponding quantitative β‐TUBULIN signals and displayed in (G). The CHX‐untreated samples (0 h) were set to 100% for each condition.
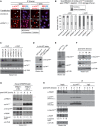
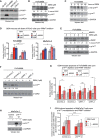
Figure 5. PRMT1‐dependent p14ARF methylation in response to DNA damage
- A–C
HeLa cells were transfected with the indicated siRNAs (two control/non‐targeting siRNAs and two PRMT1‐specific siRNAs) and irradiated at 150 J/cm2 UVC or not irradiated. After 24 h, the cellular distribution of endogenous p14ARF was determined by immunofluorescence (IF) staining using α‐p14ARF antibody (red, endogenous p14ARF) and in the merge additionally DAPI (blue, nuclei/DNA). Representative IF results are shown for two conditions (siControl_4 and siPRMT1_1) in (A), with asterisks indicating exclusively nucleolar and arrowheads indicating not‐exclusively nucleolar but additionally or predominantly nucleo‐/cytoplasmic p14ARF localization. Scale bars: 15 μm. The subcellular distribution of p14ARF, as determined by IF, was quantified by cell counting (percentage of cells) for all conditions (B). PRMT1 depletion and p14ARF protein levels were analyzed by immunoblotting using the indicated antibodies (C). The p14ARF signals were densitometrically quantified and normalized to the respective β‐TUBULIN signal, as specified by the numbers below the blot, with the siControl_4 condition set to 1. - D
GST‐tagged p14ARF and PRMT1 proteins purified from bacteria were subjected to an in vitro methyltransferase (MT) assay in the presence of SAM. Reactions were separated by SDS–PAGE and analyzed by immunoblotting using α‐me‐p14ARF and α‐p14ARF antibodies. - E
U2OS cells were transfected with Flag‐tagged wild‐type (wt) or mutant (RK) p14ARF‐containing plasmids. Methylation and overexpression of p14ARF were analyzed by immunoblotting using α‐me‐p14ARF, α‐p14ARF, and α‐β‐TUBULIN (loading control) antibodies. The me‐p14ARF antibody predominantly recognizes the p14ARF protein on the immunoblot, but weakly also other protein bands with higher molecular weights. - F
HeLa cells were irradiated at 150 J/cm2 UVC. After 0, 8, 16, and 24 h, methylation of endogenous p14ARF was analyzed by immunoblotting using α‐me‐p14ARF, α‐p14ARF, and α‐β‐TUBULIN (loading control) antibodies. The methylated p14ARF and the p14ARF signals were densitometrically quantified and normalized to the respective β‐TUBULIN signal, as specified by the numbers below the blots, with the not irradiated condition (0 h) set to 1. - G
HeLa cells either CRISPR/Cas9 control (CTR) or PRMT1‐deleted (KO_1) were irradiated at 150 J/cm2 UVC. After 0, 2, and 4 h, cell lysates were analyzed by immunoblotting using the indicated antibodies. Depicted staining results derive from the same blot and exposure times with white lines (between CTR and KO_1) indicating where tracks were cut. The percentage of PARP cleavage was densitometrically quantified and is indicated below the blot. - H
HeLa cells were irradiated at 150 J/cm2 UVC. After 0, 2, 4, and 6 h, immunoprecipitation (IP) of endogenous p14ARF was performed from cell lysates using α‐p14ARF antibody or IgG as negative control. IP reactions and input lysates were analyzed by immunoblotting using the indicated antibodies. Short and long exposure times are indicated. The p14ARF and the methylated p14ARF signals were densitometrically quantified and normalized to the respective β‐TUBULIN signal, as specified by the numbers below the blots, with the not irradiated condition (0 h) set to 1. The percentage of PARP cleavage was also densitometrically quantified and is indicated below the blot.
Figure 6. Apoptosis regulation by PRMT1‐mediated arginine methylation of p14ARF
- A–C
HeLa cells were transfected with the indicated siRNAs (two control/non‐targeting siRNAs and two PRMT1‐specific siRNAs) and irradiated at 150 J/cm2 UVC or not irradiated. After 24 h, cell cycle distribution was analyzed by flow cytometry using propidium iodide (PI) DNA staining for a representative experiment ((A), Appendix Fig S8). The subG1 fraction of the siControl_4 and siPRMT1_4 condition was quantified for three independent experiments in (B) (mean ± SD, **P ≤ 0.005 using Welch´s _t_‐test). PRMT1 depletion and p14ARF methylation of the samples (from (A)) were monitored by immunoblotting using the indicated antibodies (C). The p14ARF and the methylated p14ARF signals were densitometrically quantified and normalized to the respective β‐TUBULIN signal, as specified by the numbers below the blots, with siControl_4 condition set to 1. - D
CRISPR/Cas9 control (CTR_1 and CTR_2) or PRMT1‐deleted (KO_1 and KO_2) HeLa cell lines were irradiated at 150 J/cm2 UVC. After 0, 2, and 4 h, cell lysates were analyzed by immunoblotting using the indicated antibodies. The percentage of PARP cleavage was densitometrically quantified and is specified below the blot. - E
CRISPR/Cas9 control (CTR_1 and CTR_2) or PRMT1‐deleted (KO_1 and KO_2) HeLa cell lines were irradiated at 150 J/cm2 UVC. After 4 h, the apoptotic cell fraction was analyzed by flow cytometry using FITC‐labeled Annexin V and propidium iodide (PI). The increase in the apoptotic cell fraction upon UVC irradiation was quantified for three independent experiments (mean ± SD, **P ≤ 0.005 and *P ≤ 0.05 using Welch´s _t_‐test). - F
HeLa CRISPR/Cas9 PRMT1 deleted (KO_1) cells were transfected with Flag‐tagged‐mutant RK or RF p14ARF‐containing plasmid and subsequently irradiated at 150 J/cm2 UVC. After 4 h, the apoptotic cell fraction was quantified by flow cytometry using FITC‐labeled Annexin V and propidium iodide (PI) for seven independent experiments (mean ± SD, *P ≤ 0.05 using the paired _t_‐test). - G
GST alone, GST‐tagged wild‐type (wt), and mutant (RF) p14ARF proteins were coupled to Glutathione beads and incubated with baculoviral expressed, purified Flag‐tagged p32. Pull‐down reactions and input of p32 protein were resolved by SDS–PAGE and analyzed by immunoblotting using α‐Flag and α‐p14ARF antibodies. Short and long exposure times are specified. Staining results derive from the same blot and exposure times with white lines indicating where tracks were cut. - H
CRISPR/Cas9 control (CTR_1 and CTR_2) or PRMT1‐deleted (KO_1 and KO_2) HeLa cell lines were irradiated at 150 J/cm2 UVC or not irradiated. After 4 h, immunoprecipitations (IP) of endogenous p14ARF were performed from cell lysates using α‐p14ARF antibody or IgG as negative control. IP reactions and input lysates were analyzed by immunoblotting using the indicated antibodies. Short and long exposure times are specified.
Figure 7. Prognostic relevance of PRMT1 for clinical PDAC outcome
- Kaplan–Meier plot was generated using the transcriptome data set of PDAC from TGCA and OncoLnc to visualize the survival of PDAC patients with low or high PRMT1 transcript levels and short‐term (< 500 days, left plot) and long‐term survival (> 500 days, right plot).
- Representative immunohistochemistry (IHC) stainings of PRMT1 (brown) are shown for normal human pancreatic tissue and three PDAC specimens deriving from the cohort of 75 patients. Based on the immunostaining intensity and the percentage of stained tumor cells, all specimens were divided into three PRMT1 expression scores: not elevated, moderately elevated, and highly elevated PRMT1 expression in tumor cells in comparison with normal pancreas. Right images are magnifications of the left images, as indicated by the black rectangles. Scale bars in the left images: 100 μm. Scale bars in the right images: 50 μm.
- The pie chart depicts the percentage of patients of the PDAC cohort (n = 75) belonging to the three PRMT1 expression scores: not elevated, moderately elevated, and highly elevated PRMT1 expression.
- Patients of the PDAC cohort were grouped according to their survival time in months into three survival groups: short‐term (≤ 12 months), medium‐term (13–23 months), and long‐term survivors (≥ 24 months). Subsequently, the percentage of patients belonging to the three different PRMT1 expression scores (legend as in (C)) are displayed for each survival group.
- Immunofluorescence (IF) stainings of the 75 PDAC specimens were performed using α‐p14ARF (red), α‐CK8/18 (green, staining ductal cells in normal pancreas and neoplastic cells in PDAC) antibodies and DAPI (blue, nuclei/DNA). Representative IF images are shown for normal human pancreatic tissue, two PDAC specimens displaying no p14ARF expression and three PDAC specimens displaying strong p14ARF expression in tumor cells. Left and corresponding right images show the same tissue section. Asterisks indicate nucleolar p14ARF localization in neoplastic cells of PDAC. The last image pair shows a magnification of the image pair above (indicated by the rectangle). Scale bars: 35 μm.
- p14ARF‐positive patients of the PDAC cohort were grouped according to their survival time in month into two survival groups: short‐term (≤ 12 months) and long‐term survivors (≥ 24 months). Subsequently, the percentages of patients with either not/moderately elevated PRMT1 expression or highly elevated PRMT1 expression are displayed for the two survival groups.
Figure 8. Impact of PRMT1 on chemotherapy response and apoptosis induction of PDAC cell lines
- A
Cell lysates of the indicated human pancreatic tumor cell lines (S2‐007, PaTu8988t, MiaPaCa‐2, Panc1) were resolved by SDS–PAGE and analyzed by immunoblotting for p14ARF (α‐p14ARF) and PRMT1 (α‐PRMT1) protein levels. GAPDH staining served as loading control. - B
PaTu8988t cells were treated with 0, 1, 3, and 10 μM gemcitabine (GEM). After 48 h, cell lysates were analyzed by immunoblotting using the indicated antibodies. The p14ARF signals were densitometrically quantified and normalized to the respective GAPDH signal, as specified by the numbers below the blots, with the untreated condition (− GEM) set to 1. The percentage of PARP cleavage was also densitometrically quantified and is indicated below the blot. - C
PaTu8988t cells were treated with 3 μM gemcitabine (GEM) or left untreated (0 h). After 0, 6, 12, 24, and 48 h, methylation of endogenous p14ARF was analyzed by immunoblotting using α‐me‐p14ARF, α‐p14ARF, and α‐GAPDH (loading control) antibodies. The methylated p14ARF and the p14ARF signals were densitometrically quantified and normalized to the respective GAPDH signal, as specified by the numbers below the blots, with the untreated condition (0 h) set to 1. - D, E
PaTu8988t and MiaPaCa‐2 cells were treated (+) with 20 μM MS023 or left untreated (−) for 3 days. For the last 2 days, the cells were additionally exposed to 0, 1, or 3 μM gemcitabine (GEM). Subsequently, cell death was quantified by flow cytometry (in (D)) using FITC‐labeled Annexin V and propidium iodide (PI) for four independent experiments (mean ± SD, *P ≤ 0.05 using Welch´s _t_‐test). Additionally, PaTu8988t cell lysates were analyzed by immunoblotting using the indicated antibodies. A representative result is displayed in (E). The p14ARF signals were densitometrically quantified and normalized to the respective GAPDH signal, as specified by the numbers below the blots, with the untreated condition (− GEM, − MS013) set to 1. The percentage of PARP cleavage was also densitometrically quantified and is indicated below the blot. - F, G
PaTu8988t were transfected with the indicated siRNAs (two control/non‐targeting siRNAs and two p14ARF‐specific siRNAs) and treated (+) with 20 μM MS023 or left untreated (−) for 3 days. For the last 2 days, the cells were additionally exposed 1 μM gemcitabine (+ GEM) or not (− GEM). p14ARF depletion was monitored by immunoblotting using the indicated antibodies. A representative result is displayed in (F). The p14ARF signals in the siControl conditions were densitometrically quantified and normalized to the respective CDK2 signal, as specified by the numbers below the blot, with the untreated condition (− GEM) of the siControl_2 sample set to 1. Apoptosis was quantified by flow cytometry (G) using FITC‐labeled Annexin V and propidium iodide (PI) for six independent experiments (mean ± SD, **P ≤ 0.005, *P ≤ 0.05, ns: not significant using Welch´s _t_‐test). - H, I
MiaPaCa‐2 cells were transfected with empty vector (e.v., control) or Flag‐tagged wild‐type (wt) p14ARF‐containing plasmid and treated (+) with 20 μM MS023 or left untreated (−) for 3 days. For the last 2 days, the cells were additionally exposed to 1 μM gemcitabine (+ GEM) or not (− GEM). p14ARF overexpression was monitored by immunoblotting using the indicated antibodies. A representative result is displayed in (H). The p14ARF signals in the overexpression conditions were densitometrically quantified and normalized to the respective GAPDH signal, as specified by the numbers below the blot, with the untreated condition (− GEM) set to 1. Apoptosis was analyzed by flow cytometry (I) using FITC‐labeled Annexin V and propidium iodide (PI). The increase in the apoptotic cell fraction upon gemcitabine and/or MS023 was quantified for four independent experiments (mean ± SD, ***P ≤ 0.001, *P ≤ 0.05 using Welch´s _t_‐test).
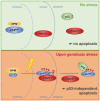
Figure 9. Model for the regulation of the tumor suppressor protein p14ARF by PRMT1
In unstressed cells, p14ARF is predominantly sequestered in the nucleoli, bound to its nucleolar interaction partner NPM. Upon genotoxic stress, the interaction between p14ARF and PRMT1 is reinforced and the C‐terminal NLS/NoLS of p14ARF is methylated by PRMT1. This stress‐induced arginine methylation promotes the release of p14ARF from NPM and nucleolar sequestration, leading to p53‐independent apoptosis.
Similar articles
- Nucleolar p14(ARF) overexpression in Reed-Sternberg cells in Hodgkin's lymphoma: absence of p14(ARF)/Hdm2 complexes is associated with expression of alternatively spliced Hdm2 transcripts.
García JF, Villuendas R, Sánchez-Beato M, Sánchez-Aguilera A, Sánchez L, Prieto I, Piris MA. García JF, et al. Am J Pathol. 2002 Feb;160(2):569-78. doi: 10.1016/S0002-9440(10)64876-6. Am J Pathol. 2002. PMID: 11839577 Free PMC article. - [Expression of proteins in p53 (p14ARF-mdm2-p53-p21WAF/CIP1) pathway and their significance in exocrine pancreatic carcinoma].
Yu GZ, Zhu MH, Ni CR, Li FM, Zheng JM, Gong ZJ. Yu GZ, et al. Zhonghua Bing Li Xue Za Zhi. 2004 Apr;33(2):130-4. Zhonghua Bing Li Xue Za Zhi. 2004. PMID: 15132849 Chinese. - p14ARF forms meso-scale assemblies upon phase separation with NPM1.
Gibbs E, Miao Q, Ferrolino M, Bajpai R, Hassan A, Phillips AH, Pitre A, Kümmerle R, Miller S, Nagy G, Leite W, Heller W, Stanley C, Perrone B, Kriwacki R. Gibbs E, et al. Nat Commun. 2024 Nov 11;15(1):9531. doi: 10.1038/s41467-024-53904-z. Nat Commun. 2024. PMID: 39528457 Free PMC article. - DNA damage, p14ARF, nucleophosmin (NPM/B23), and cancer.
Gjerset RA. Gjerset RA. J Mol Histol. 2006 Sep;37(5-7):239-51. doi: 10.1007/s10735-006-9040-y. Epub 2006 Jul 20. J Mol Histol. 2006. PMID: 16855788 Review. - B23 and ARF: friends or foes?
Lindström MS, Zhang Y. Lindström MS, et al. Cell Biochem Biophys. 2006;46(1):79-90. doi: 10.1385/CBB:46:1:79. Cell Biochem Biophys. 2006. PMID: 16943625 Review.
Cited by
- Elongin B promotes breast cancer progression by ubiquitinating tumor suppressor p14/ARF.
Sui XY, Ma XY, Hou Y, Cao SW, Wang ZQ, Jia LJ, Fan L, Shao ZM, Zhang WJ. Sui XY, et al. Cell Biol Toxicol. 2024 Apr 23;40(1):24. doi: 10.1007/s10565-024-09864-7. Cell Biol Toxicol. 2024. PMID: 38653919 Free PMC article. - [PRMT1 inhibits apoptosis of nasopharyngeal carcinoma cells by promoting RRM2 expression].
Zhou L, Wu J, Zhang M, Zhao B, Ma S. Zhou L, et al. Nan Fang Yi Ke Da Xue Xue Bao. 2022 Dec 20;42(12):1783-1790. doi: 10.12122/j.issn.1673-4254.2022.12.05. Nan Fang Yi Ke Da Xue Xue Bao. 2022. PMID: 36651245 Free PMC article. Chinese. - PRMT1 Regulates EGFR and Wnt Signaling Pathways and Is a Promising Target for Combinatorial Treatment of Breast Cancer.
Suresh S, Huard S, Brisson A, Némati F, Dakroub R, Poulard C, Ye M, Martel E, Reyes C, Silvestre DC, Meseure D, Nicolas A, Gentien D, Fayyad-Kazan H, Le Romancer M, Decaudin D, Roman-Roman S, Dubois T. Suresh S, et al. Cancers (Basel). 2022 Jan 8;14(2):306. doi: 10.3390/cancers14020306. Cancers (Basel). 2022. PMID: 35053470 Free PMC article. - Methylation of BRD4 by PRMT1 regulates BRD4 phosphorylation and promotes ovarian cancer invasion.
Liu Y, Liu H, Ye M, Jiang M, Chen X, Song G, Ji H, Wang ZW, Zhu X. Liu Y, et al. Cell Death Dis. 2023 Sep 22;14(9):624. doi: 10.1038/s41419-023-06149-5. Cell Death Dis. 2023. PMID: 37737256 Free PMC article. - Design and Synthesis of Novel PRMT1 Inhibitors and Investigation of Their Effects on the Migration of Cancer Cell.
Wang C, Dong L, Zhao Z, Zhang Z, Sun Y, Li C, Li G, You X, Yang X, Wang H, Hong W. Wang C, et al. Front Chem. 2022 Jun 8;10:888727. doi: 10.3389/fchem.2022.888727. eCollection 2022. Front Chem. 2022. PMID: 35755248 Free PMC article.
References
- Anaya J (2016) OncoLnc: linking TCGA survival data to mRNAs, miRNAs, and lncRNAs. PeerJ Comput Sci 2: e67
- Ayrault O, Olivier A, Karayan L, Lucie K, Riou J‐F, Jean‐François R, Larsen C‐J, Christian‐Jacques L, Séité P, Paule S (2003) Delineation of the domains required for physical and functional interaction of p14ARF with human topoisomerase I. Oncogene 22: 1945–1954 - PubMed
Publication types
MeSH terms
Substances
LinkOut - more resources
Full Text Sources
Other Literature Sources
Medical
Research Materials
Miscellaneous
