Visualizing the Current Landscape of the Fintech Industry (original) (raw)
Visualizing the Current Landscape of the Fintech Industry
Since the introduction of the first credit card with a magnetic stripe in 1966, financial technology has come a long way. Silicon Valley may not have birthed the term “fintech”, but it has certainly helped catapult its applications into the mainstream.
Leveraging everything from basic apps to the blockchain, the changing dynamics of fintech are creating new investment opportunities everyday, growing its appetite with every new megadeal.
Today’s graphic from Raconteur highlights the global growth of the fintech industry, the services with the most staying power, and major M&A developments of the past year as traditional institutions scramble to deal with this digital disruption.
How Fintech Levels the Playing Field
Over the past five years, digitally-enabled financial technology services have delivered convenient and cheaper access to financial services to millions of consumers.
What draws consumers towards using fintech?
- Attractive rates and fees (27%)
- Easy access and account setup (20%)
- Variety of innovative products and services (18%)
- Better service quality and product features (12%)
This new implementation of technology is democratizing financial services for the masses, a strong contrast to accessing them through traditional brick-and-mortar institutions.
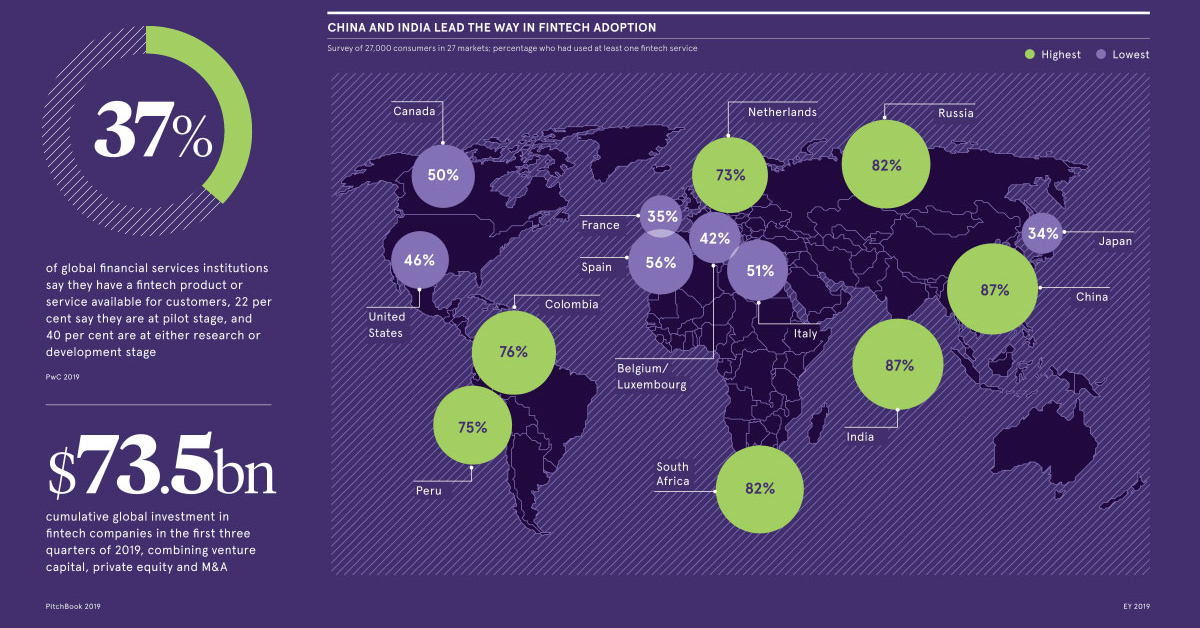
How Fintech Fares Across Borders
On average, 64% of the world’s digitally active population has used at least one fintech service. But China and India surpass this benchmark by a mile—in a survey of 27,000 consumers across 27 markets, both countries demonstrated a 87% fintech adoption rate.
Russia and South Africa are in close second, with 82% adoption respectively. On the other hand, France and Japan are tied at the low end of the spectrum with only 35% fintech adoption.
The trajectory of mobile payments and digital wallets in China can help put high Asian adoption rates in perspective. Thanks to services like Alipay and WeChat, 890 million unique mobile payment users are essentially transforming China from a cash economy to a digital one.
Which Services Have Caught Consumer Attention?
Just like “Googling” is synonymous with looking up information online, the term “Venmo-ing” has become an American verb for paying someone back via a digital wallet.
That’s why it’s no surprise that money transfer and payments are by far the most rapidly growing fintech services, shooting up from 18% to 75% global adoption in just four years. Here’s how global average adoption rates differ by fintech service, across time:
| Fintech Category | 2015 | 2017 | 2019 |
|---|---|---|---|
| 💸 Money transfer and payments | 18% | 50% | 75% |
| 💰 Savings and investments | 17% | 20% | 34% |
| 📋 Budgeting and financial planning | 8% | 10% | 29% |
| 🛡️ Insurance | 8% | 24% | 48% |
| 💳 Borrowing | 6% | 10% | 27% |
Source: EY Global Fintech Adoption Index 2019
Insurtech has steadily gained traction in the market. Digital insurance solutions provide personalized and on-demand coverage plans for clients, using bots and machine learning to assess risk levels. As a result, this sub-segment has been attracting large funding rounds due to the time—and money—it helps free up for firms.
According to CapGemini, incumbents in the financial industry see wallets and mobile payments from fintech providers as the most significant offerings impacting their companies. That may be why they’re resorting to big moves to protect their business.
Deals and More Deals
Major financial institutions made some serious plays in 2019, in the way of mergers and acquisitions of fintech companies:
- FIS bought the payments processing company Worldpay for 35billion,valuingthecompanyat∗∗35 billion, valuing the company at 35billion,valuingthecompanyat∗∗43 billion when debt is included. (Reuters)
- The London Stock Exchange Group plans to acquire financial markets data provider Refinitiv for $27 billion, in the hopes of rivaling Bloomberg. (Reuters)
- Global Payments bought the payments processing company Total System Services for $21.5 billion, planning to provide services to over 1,300 financial institutions. (Bloomberg)
- Fiserv acquired payments processing company First Data for $22 billion—the two companies combined are a backbone of Wall Street’s financial technology. (WSJ)
- Visa purchased the payments authentication company Plaid for $5.3 billion in January 2020, in hopes of strengthening its relations with financial institutions. (CNBC)
As billions of dollars exchange hands, it’s been noted that many of these plays were made by established incumbents to curb the threat posed by fintech startups.
At the same time, however, it’s also clear that traditional institutions want to tap into what fintech startups are doing right.
apps
Ranked: The Biggest Social Media Platforms in 2026
Billions of people use social media today. The biggest three platforms, however, are all owned by just one company.


Published
6 days ago
on
May 11, 2026

Ranked: The Biggest Social Media Platforms in 2026
See visuals like this from many other data creators on our Voronoi app. Download it for free on iOS or Android and discover incredible data-driven charts from a variety of trusted sources.
Key Takeaways
- Meta owns five of the world’s 15 largest social media platforms, including Facebook, Instagram, and WhatsApp.
- Facebook remains the world’s biggest social network with 3.1 billion monthly active users.
- Chinese-owned platforms TikTok, WeChat, and Douyin collectively reach over 4 billion users worldwide.
The world’s largest social media platforms now rival countries in scale, with several apps serving more than one billion monthly users.
This graphic highlights the world’s most popular social media platforms using 2026 data from Salesforce, which counts the number of monthly active users for each platform.
Facebook remains the world’s biggest social media platform with more than 3.1 billion monthly users, reflecting roughly 40% of the global population.
Meta Controls the World’s Largest Social Platforms
Facebook, created in 2004, is owned by Meta (formerly Facebook Inc.), one of the world’s largest companies by market capitalization.
Yet Meta’s dominance extends well beyond Facebook, as it also owns runners-up Instagram and WhatsApp (both 3 billion). Meta acquired Instagram for just $1 billion in 2012, and acquired WhatsApp two years later for nearly $20 billion.
The table below lists the 15 most popular social media platforms worldwide alongside their owners and monthly active users.
| Rank | Platform | Owner | Label |
|---|---|---|---|
| 1 | 🇺🇸 Meta | 3.1B | |
| 2 | 🇺🇸 Meta | 3B | |
| 3 | 🇺🇸 Meta | 3B | |
| 4 | YouTube | 2.5B | |
| 5 | TikTok | 🇨🇳 ByteDance | 2B |
| 6 | 🇨🇳 Tencent | 1.4B | |
| 7 | Messenger | 🇺🇸 Meta | 1B |
| 8 | Telegram | 🇦🇪 Telegram | 1B |
| 9 | Snapchat | 🇺🇸 Snap Inc. | 900M |
| 10 | 🇺🇸 Reddit Inc. | 850M | |
| 11 | Douyin | 🇨🇳 ByteDance | 755M |
| 12 | X (Twitter) | 🇺🇸 X Corp. | 650M |
| 13 | 🇺🇸 Pinterest Inc. | 578M | |
| 14 | Threads | 🇺🇸 Meta | 400M |
| 15 | 🇺🇸 Microsoft | 310M |
While Facebook is popular with people of all ages, Instagram has become especially popular among young adults and millennials. Meanwhile, WhatsApp has become the world’s most widely used messaging app and is essential for communication in countries like Brazil and India.
Beyond the Big 3, Meta also owns Messenger (1 billion), another popular messaging app integrated with Facebook, as well as Threads (400 million), an Instagram offshoot designed to compete with X and its roughly 650 million users.
China’s Emergence in Social Media
While most of the world’s top social media platforms have historically been American, Chinese companies have rapidly expanded their influence in recent years.
Within China itself, Tencent’s WeChat (1.4 billion) has become the country’s primary digital platform, extending beyond messaging to include payments, shopping, and gaming.
Then there’s ByteDance, which has reshaped the global social media landscape. The company created Douyin (755 million) for the Chinese market and its international counterpart TikTok (2 billion), which has become one of the world’s fastest-growing social platforms.
TikTok’s widespread popularity, especially among younger users, has also triggered regulatory scrutiny and restrictions in countries including India and the United States.
Following growing U.S. restrictions on TikTok, ByteDance agreed to enter a joint venture with American companies in 2025.
Social Media Has Expanded Beyond Networking
When social media first originated in the 2000s, it was designed for young adults to stay connected. Facebook famously wanted to put the entire college experience online. However, since then social media has extended far beyond its initial purpose.
YouTube (2.5 billion) is the largest video-sharing site in the world, while Reddit (850 million) has become a massive online forum for people to congregate around shared interests.
Finally, there’s LinkedIn (310 million). The social networking platform was acquired by Microsoft for over $26 billion in 2016 and is today a central hub for working professionals in various sectors to connect, network, and find or advertise jobs.
Learn More on the Voronoi App 
Is there a generational component? Find out with What are Gen Z’s Favorite Social Media Platforms? on Voronoi.Use This Visualization
Millennials
Mapped: Europe’s Social Media Gap by Country
An overwhelming majority of Europeans are on social media today. Germans and Italians, however, are more reluctant.

Published
2 weeks ago
on
May 2, 2026

Mapped: Europe’s Social Media Gap by Country
See visuals like this from many other data creators on our Voronoi app. Download it for free on iOS or Android and discover incredible data-driven charts from a variety of trusted sources.
Key Takeaways
- Social media use in Europe ranges from 56% in Italy to 90% in Denmark.
- Northern Europe leads adoption, with several countries above 80%.
- Germany (59%) and Italy (56%) trail the European average of 74%.
Social media use across Europe varies sharply by country, creating a clear gap between the continent’s most and least connected populations.
This map shows the share of adults active on social networking sites across Europe, based on 2025 data from Eurostat and Ofcom. Being “active” in this case involves creating a profile, posting messages, sharing, commenting, or otherwise contributing to a social networking site.
While adoption exceeds 80% in several northern countries, it drops to 56% in Italy and 59% in Germany, two of Europe’s largest economies. Overall, the European average sits at 74%, masking these wide differences in usage.
Northern Europe’s Social Media Craze
Northern Europe stands out as the region with the highest social media adoption rates.
Denmark leads the continent in social media use (90%), followed closely by Norway (89%). Sweden and the Baltic states of Estonia, Latvia, and Lithuania trail slightly behind in the 70–79% range.
This data table shows social media usage rates across European countries.
| Rank | Country | Social Media Use (% of Adults) |
|---|---|---|
| 1 | 🇩🇰 Denmark | 90 |
| 2 | 🇬🇧 UK | 89 |
| 3 | 🇳🇴 Norway | 89 |
| 4 | 🇨🇾 Cyprus | 87 |
| 5 | 🇲🇪 Montenegro | 84 |
| 6 | 🇲🇹 Malta | 82 |
| 7 | 🇫🇮 Finland | 81 |
| 8 | 🇳🇱 Netherlands | 81 |
| 9 | 🇹🇷 Turkey | 80 |
| 10 | 🇮🇪 Ireland | 80 |
| 11 | 🇷🇴 Romania | 80 |
| 12 | 🇱🇻 Latvia | 79 |
| 13 | 🇭🇺 Hungary | 79 |
| 14 | 🇲🇰 North Macedonia | 78 |
| 15 | 🇷🇸 Serbia | 76 |
| 16 | 🇸🇪 Sweden | 75 |
| 17 | 🇨🇭 Switzerland | 74 |
| 18 | 🇬🇷 Greece | 73 |
| 19 | 🇪🇪 Estonia | 73 |
| 20 | 🇧🇬 Bulgaria | 71 |
| 21 | 🇫🇷 France | 71 |
| 22 | 🇵🇹 Portugal | 71 |
| 23 | 🇱🇹 Lithuania | 70 |
| 24 | 🇨🇿 Czechia | 70 |
| 25 | 🇪🇸 Spain | 70 |
| 26 | 🇦🇹 Austria | 68 |
| 27 | 🇧🇪 Belgium | 68 |
| 28 | 🇱🇺 Luxembourg | 67 |
| 29 | 🇸🇮 Slovenia | 65 |
| 30 | 🇵🇱 Poland | 63 |
| 31 | 🇸🇰 Slovakia | 62 |
| 32 | 🇭🇷 Croatia | 62 |
| 33 | 🇩🇪 Germany | 59 |
| 34 | 🇮🇹 Italy | 56 |
Northern Europe’s high usage reflects early and widespread adoption of digital technologies.
Estonia, for example, has earned the moniker “e-Estonia” due to its tech-savvy society and government, while companies ranging from Finland’s Nokia to Sweden’s Spotify rank among Europe’s leading digital success stories.
Even with this reputation, some Scandinavian governments are considering social media bans for children. Denmark, as the continental leader in online activity, is weighing a ban on children’s creation of social media profiles before age 15, or 13–14 with parental consent.
Social Media in Western Europe
Western Europe has long included some of the continent’s most globalized countries. In 2005, university students in the United Kingdom were the first outside North America to join Facebook. Today, 89% of UK adults are active on social media.
However, beyond the UK, social media activity is more limited than in the Nordics. France counts 71% of its adult population on social networking sites, just ahead of Spain and Portugal (both 70%).
For their part, the Benelux countries show an interesting contrast: 81% of Dutch adults use social media, compared to 67–68% in Belgium and Luxembourg.
Italians: The Least Online Europeans
Italy has the lowest social media usage rate in Europe, with just 56% of adults active on social networks. This represents a gap of more than 30 percentage points compared to countries like Denmark, Norway, or the UK.
The contrast also appears generational, as over three-quarters of Italian teens self-report being addicted to their phones.
Germany (59%) is the only country near Italy’s low rate of social media usage. German society appears more divided on the benefits and drawbacks of social networking sites, with nearly half of surveyed Germans in 2025 saying they would rather live in a world without social media.
Learn More on the Voronoi App
To learn more about this topic, check out the What are Gen Z’s Favorite Social Media Platforms? on Voronoi.