NOAA Weather Radio Local Transmitters (original) (raw)
 |
 |
 |
 |
 |
 |
|---|
Traveling outside the local area? Click here for nationwide transmitter information and broadcast coverage maps.
Current NWR transmitter outages/degraded service
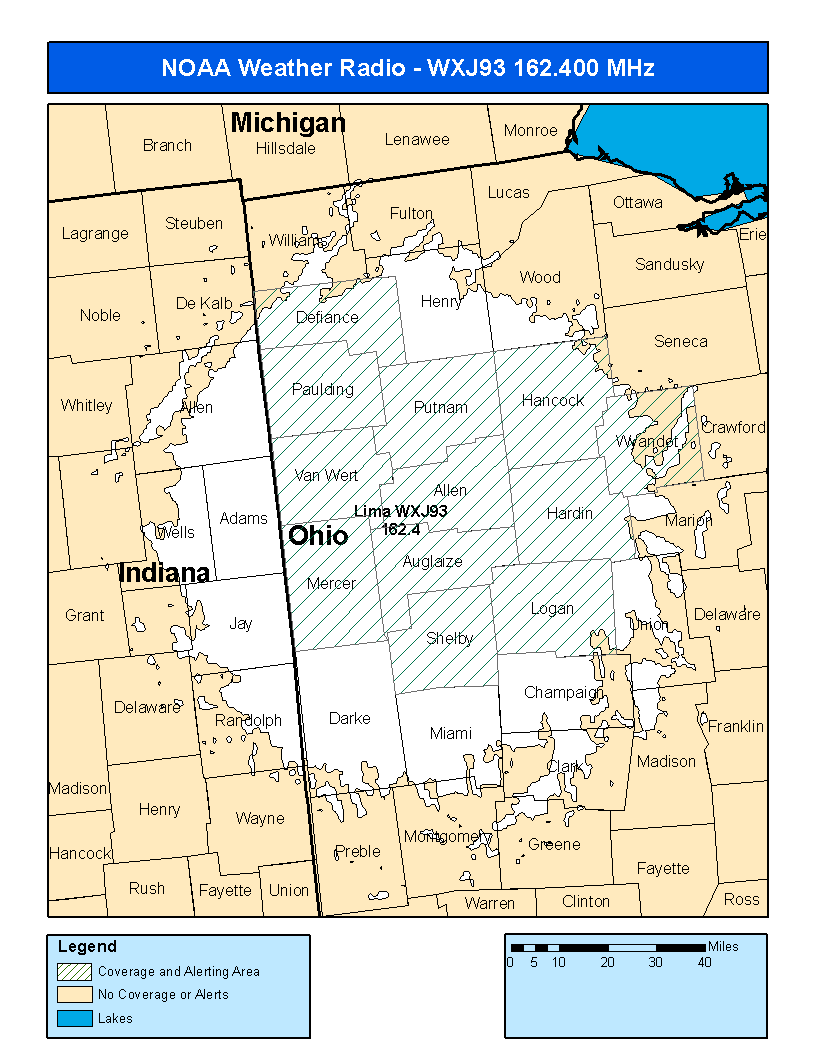
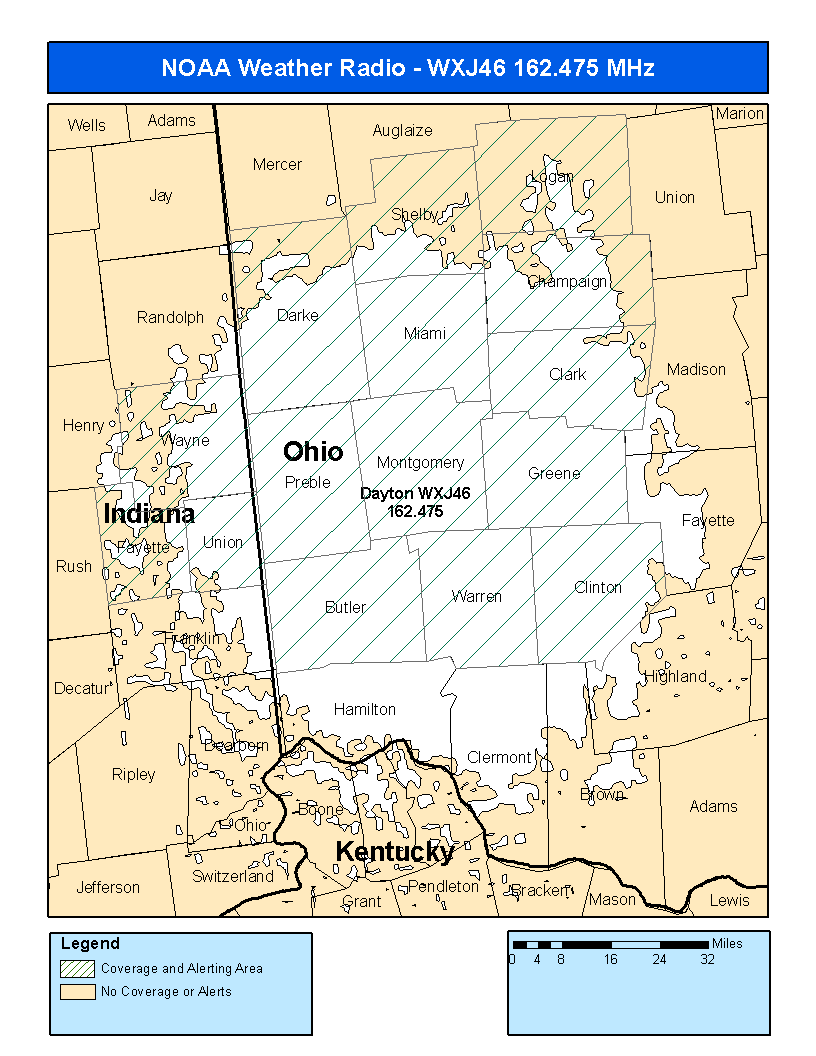
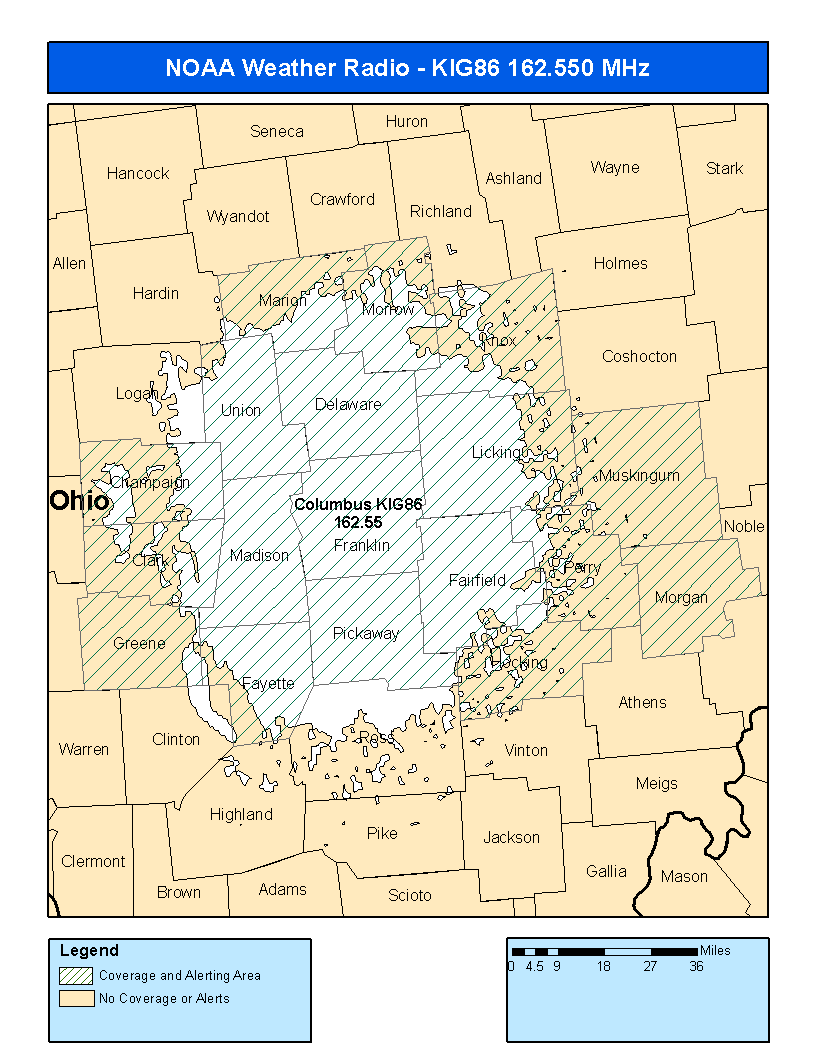
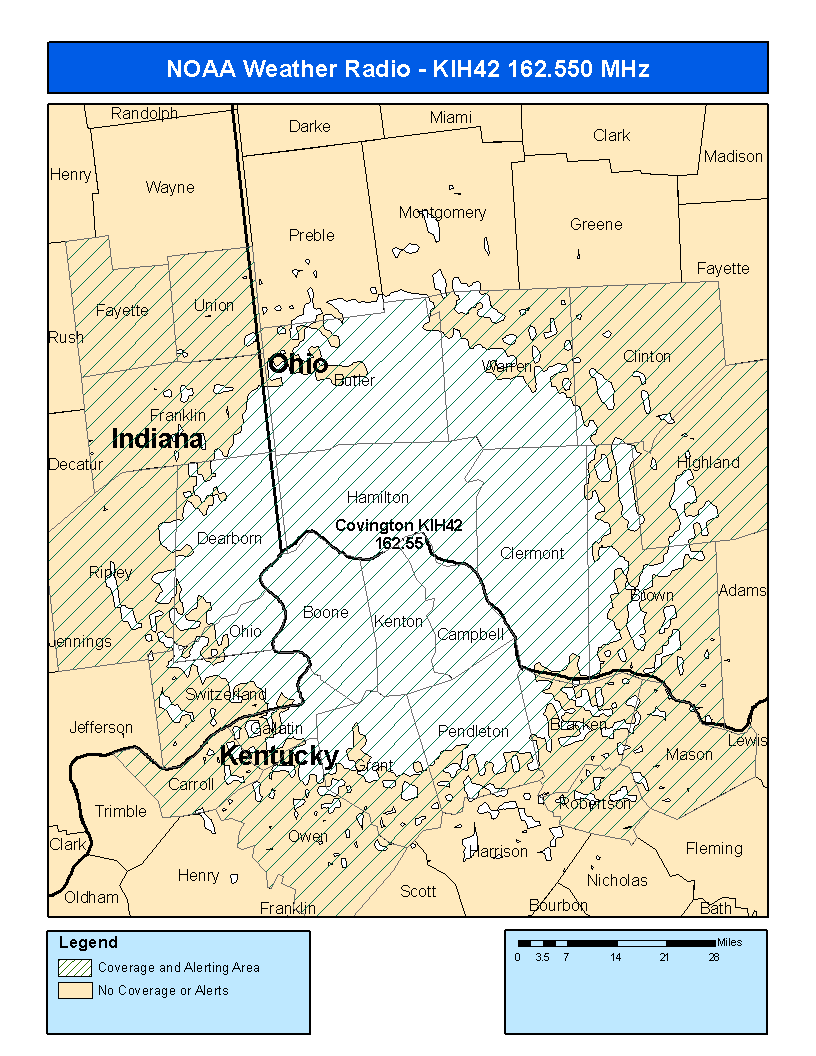
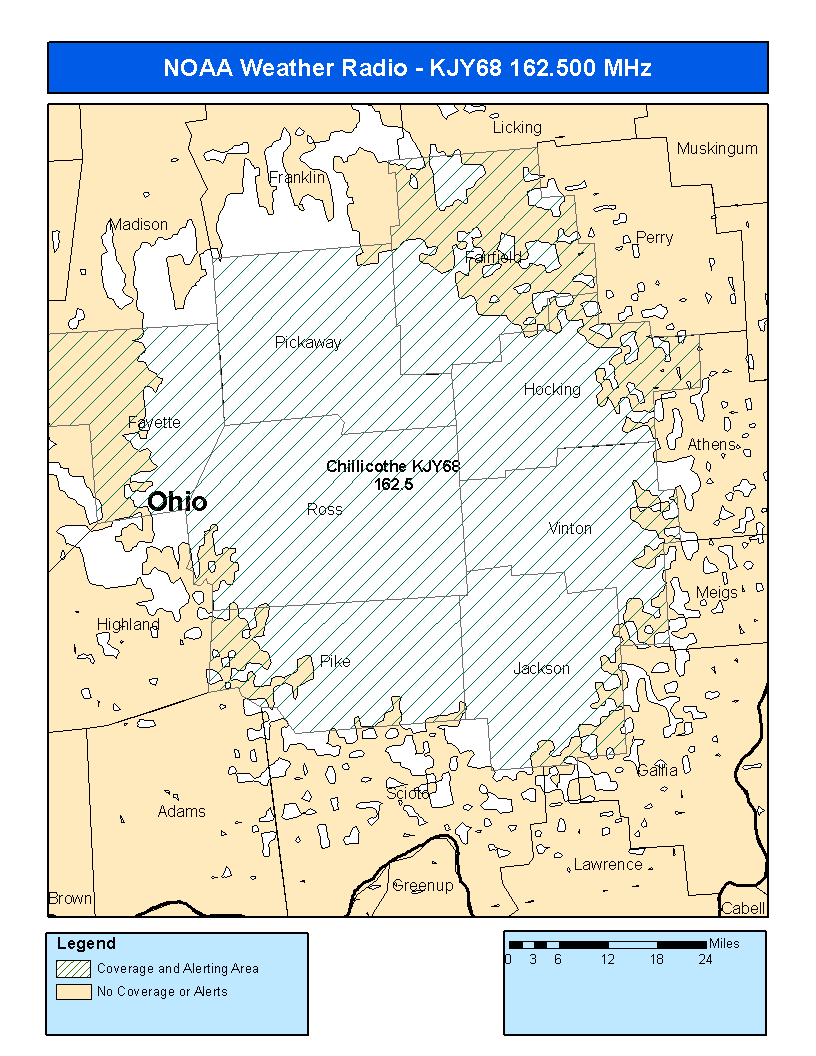
Coverage Map Notes:
The coverage statistics and maps shown above are calculated using a computer model and station data assuming ideal conditions. Coverage may be 5 to 10 percent below the computer predicted coverage for the following reasons:
- The computer model is sensitive to antenna performance. Antenna performance is a function of local conditions, causing signals to be stronger signal level in some directions than others.
- Placement of NWR antennas is dictated by the tower owner, which may result in a less than ideal set up.
- The antenna may be affected by nearby structures or bodies of water.
- In some special instances, the antenna may have been intentionally adjusted to be "directional" and provide better coverage to a specific area to the detriment of other areas.
- Because of variations in local site conditions, the performance of an individual transmitter and antenna may be less than predicted or expected.
- Seasonal environmental conditions, such as icing or heavy rain, affect performance of a transmitter station and its various components, particularly those subject to continuous weather exposure.
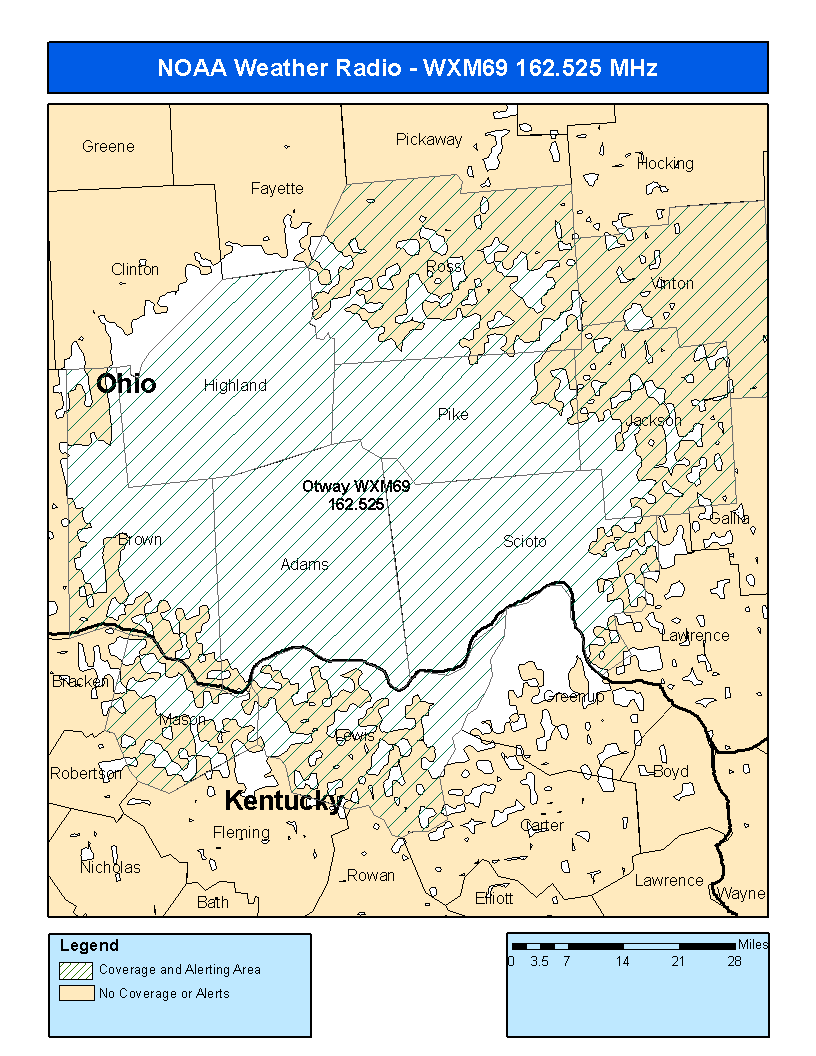
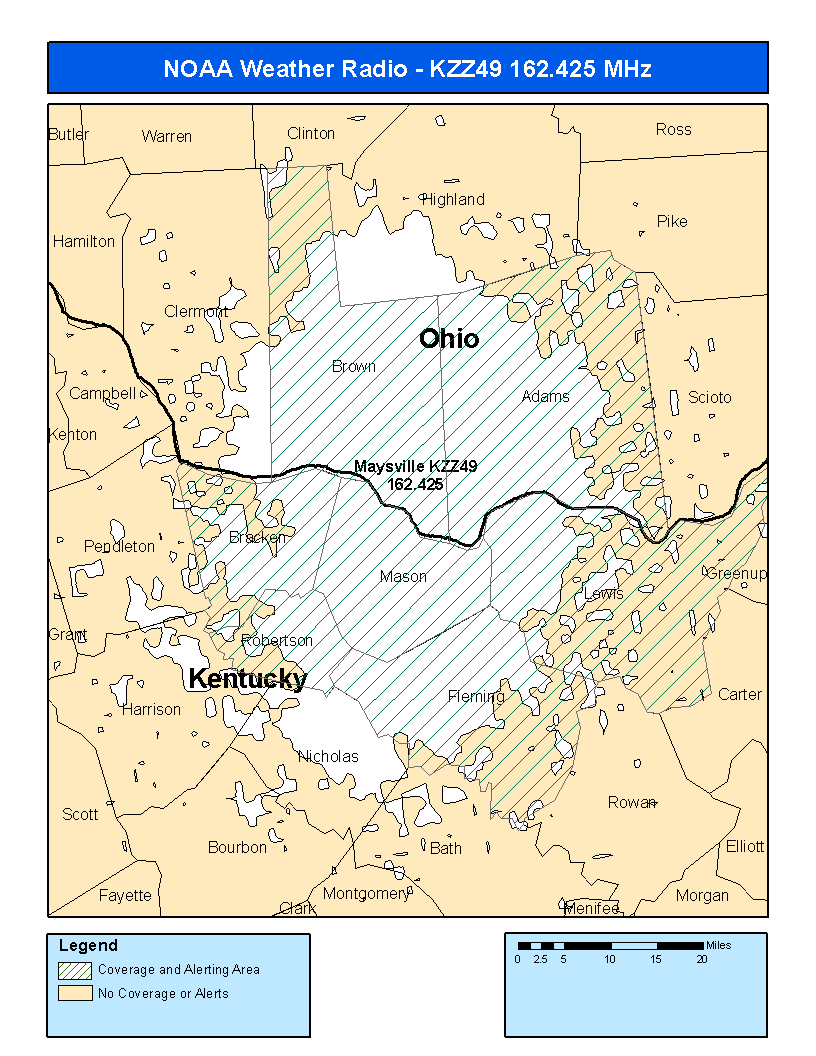
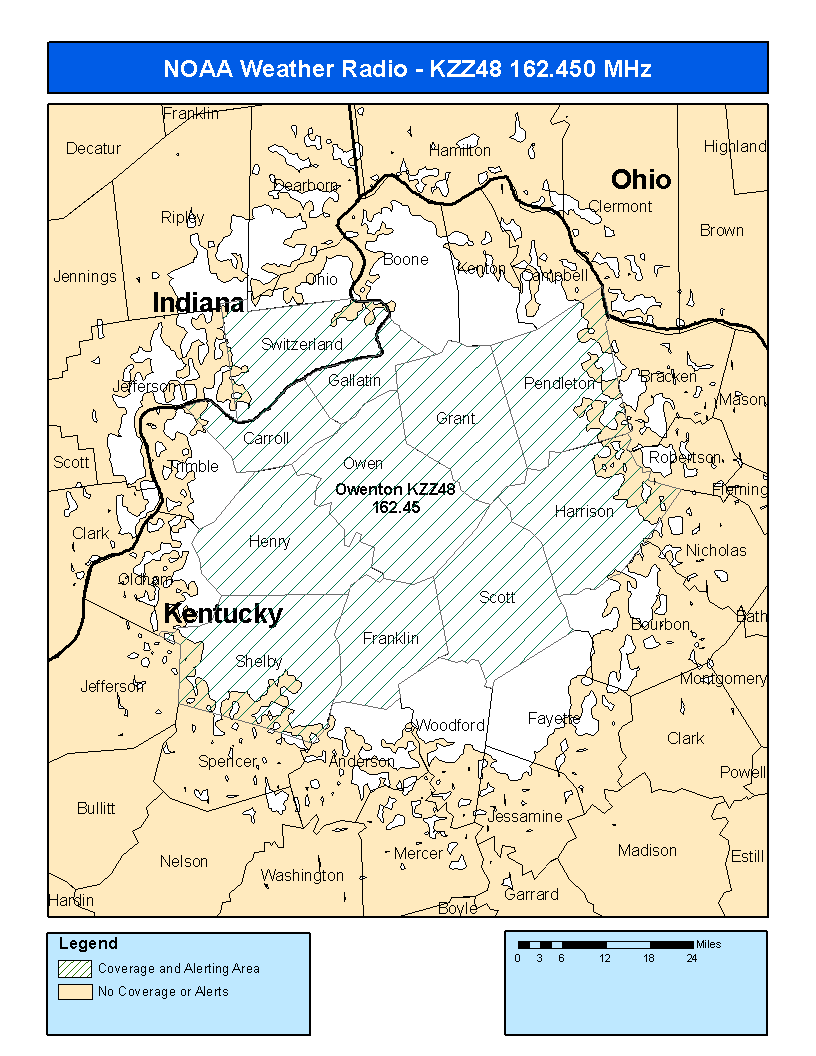
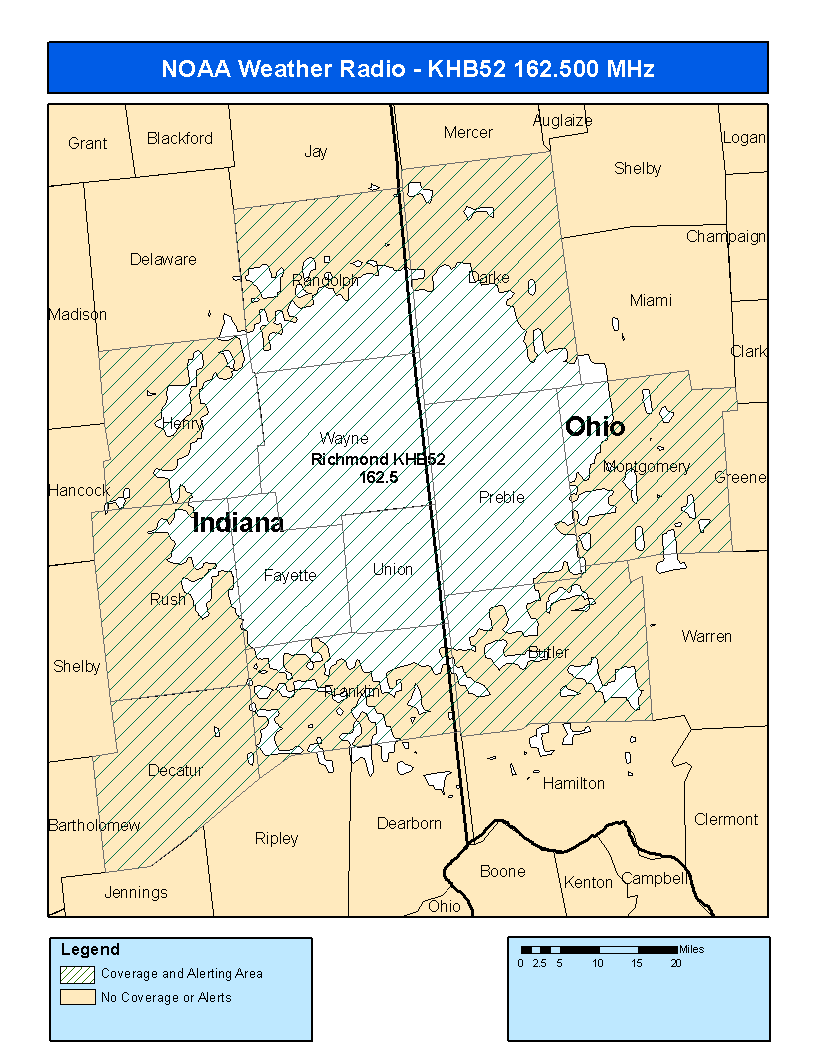
- The coverage maps are shown in a single color format, which relates to an estimated signal level (white areas indicate reliable broadcast coverage with signal levels greater than 18dBuV).
