Pancreatic cancer mortality in China (1991-2000) (original) (raw)
![]()

BPG is committed to discovery and dissemination of knowledge
![]()
This Article

Citation of this article
Wang L, Yang GH, Lu XH, Huang ZJ, Li H. Pancreatic cancer mortality in China (1991-2000). World J Gastroenterol 2003; 9(8): 1819-1823 [PMID: 12918128 DOI: 10.3748/wjg.v9.i8.1819]
Corresponding Author of This Article
Li Wang, Graduate School of Peking Union Medical College, 9 Dongdan 3 Tiao, Beijing, 100730, China. wangli0528@vip.sina.com
Article-Type of This Article
Clinical Research
Open-Access Policy of This Article
This article is an open-access article which was selected by an in-house editor and fully peer-reviewed by external reviewers. It is distributed in accordance with the Creative Commons Attribution Non Commercial (CC BY-NC 4.0) license, which permits others to distribute, remix, adapt, build upon this work non-commercially, and license their derivative works on different terms, provided the original work is properly cited and the use is non-commercial. See: http://creativecommons.org/licenses/by-nc/4.0/
Times Cited Counts in Google of This Article
Number of Hits and Downloads for This Article
- Total Article Views (3758)
All Articles published online
Aug 15, 2003 (publication date) through Oct 20, 2024
Times Cited of This Article
Journal Information of This Article
Publication Name
World Journal of Gastroenterology
ISSN
1007-9327
Publisher of This Article
Baishideng Publishing Group Inc, 7041 Koll Center Parkway, Suite 160, Pleasanton, CA 94566, USA
Clinical Research Open Access
Copyright ©The Author(s) 2003. Published by Baishideng Publishing Group Inc. All rights reserved.
World J Gastroenterol. Aug 15, 2003; 9(8): 1819-1823
Published online Aug 15, 2003. doi: 10.3748/wjg.v9.i8.1819
Pancreatic cancer mortality in China (1991-2000)
Li Wang, Hui Li, Department of Epidemiology, School of Basic Medical Sciences, PUMC, Institute of Basic Medical Sciences, CAMS, Beijing, 100005, China
Gong-Huan Yang, Zheng-Jing Huang, Institute of Epidemiology and Microbiology, Center for Disease Control and Prevention of China, Beijing, 100050, China
Xing-Hua Lu, Department of Internal Medicine, Peking Union Hospital, Beijing, 100730, China
ORCID number: $[AuthorORCIDs]
Author contributions: All authors contributed equally to the work.
Supported by the Ministry of Public Health, No. 20010102
Correspondence to: Li Wang, Graduate School of Peking Union Medical College, 9 Dongdan 3 Tiao, Beijing, 100730, China. wangli0528@vip.sina.com
Telephone: +86-10- 65237943 Fax: +86-10-65284767
Received: March 2, 2003
Revised: March 6, 2003
Accepted: March 29, 2003
Published online: August 15, 2003
Abstract
AIM: To describe the mortality rate of pancreatic cancer and its distribution in China during the period of 1991-2000.
METHODS: Based on the data of demography and death collected through China’s Disease Surveillance Point System (DSPS) over the period of 1991-2000, the distribution of death rate of pancreatic cancer was described in terms of age group, gender, calendar year, rural/urban residence and administrative district.
RESULTS: A total of 1619 death cases attributed to pancreatic cancer (975 men and 644 women) were reported by DSPS during 1991-2000. The reported, adjusted and age-standardized mortality rates increased from 1.46, 1.75, and 2.18 per 100000 populations in 1991 to 2.38, 3.06, and 3.26 per 100000 populations in 2000. The majority (69.62%) of the deaths of pancreatic cancer were seen in the age group of 60 years and older. The mortality rate was higher in men than in women, but the male to female death rate ratios decreased during the 10 years. Our data also showed that the death rate of pancreatic cancer in urban areas was about 2-4 fold higher than that in rural areas, and in Northeast and East China, the death rates were higher than those in the other 5 administrative districts.
CONCLUSION: The death rate due to pancreatic cancer was rising during the period of 1991-2000 and the peak mortality of pancreatic cancer might arrive in China.
Key Words: $[Keywords]
- Citation: Wang L, Yang GH, Lu XH, Huang ZJ, Li H. Pancreatic cancer mortality in China (1991-2000). World J Gastroenterol 2003; 9(8): 1819-1823
- URL: https://www.wjgnet.com/1007-9327/full/v9/i8/1819.htm
- DOI: https://dx.doi.org/10.3748/wjg.v9.i8.1819
INTRODUCTION
Pancreatic cancer is one of the most formidable malignant tumors worldwide. It is difficult to diagnose at early stage, unresectable at the time of diagnosis with extremely poor survival rate due to its inaccessible location, proximity to other vital organs, and inherently aggressive pattern of growth[1,2]. The death to incidence ratio of pancreatic cancer is approximately 0.98-0.99:1[3,10]. With more than 27000 people died from pancreatic cancer each year, it is the fourth leading cause of cancer death in the United States[4]. Some sporadic reports have shown that the mortality rates of pancreatic cancer in China have increased constantly over the last decades[5-7]. But there is little descriptive documentation countrywide on its epidemiology. By analyzing the death data from China’s Disease Surveillance Point System (DSPS), we presented the first report on the mortality from pancreatic cancer and its distribution among the surveillance population during the period of 1991-2000 in China.
MATERIALS AND METHODS
Materials
All mortality data were collected from the population who resided in 145 DSPs (Disease Surveillance Points) of China. The DSPS was originated in the beginning of 1980s for the surveillance of morbidity and mortality, and the present system was established in 1989. DSPs were selected from an official list of all neighborhoods in urban areas and villages in rural areas using stratified multistage sampling. The strata was involved in geographic areas (urban or rural status: within the rural areas, stratification into 4 levels based on indicators of mortality and socioeconomic status). In 1989, 145 surveillance points with a total population of around 10 million under surveillance (Table 1) were chosen, and scattered in 31 provinces, autonomous regions, or municipalities in China. Comparisons among the DSP population and the whole population over the country showed no significant differences in terms of socioeconomic conditions, population constitution, and health status. Such comparisons were made annually[8].
Table 1 Population distribution by age group in DSPs during 1991-2000 in China (10000)a.
| Age group | 1991 | 1992 | 1993 | 1994 | 1995 | 1996 | 1997 | 1998 | 1999 | 2000 |
|---|---|---|---|---|---|---|---|---|---|---|
| 0- | 18.52 | 15.74 | 13.84 | 13.56 | 11.47 | 11.60 | 12.00 | 10.40 | 9.92 | 10.17 |
| 1- | 72.69 | 66.59 | 64.06 | 64.94 | 57.60 | 60.96 | 61.20 | 52.76 | 49.51 | 50.16 |
| 5- | 88.94 | 83.27 | 79.72 | 83.66 | 76.27 | 80.52 | 82.40 | 70.60 | 66.62 | 69.51 |
| 10- | 91.70 | 87.86 | 81.64 | 83.12 | 75.32 | 79.54 | 87.59 | 73.59 | 73.60 | 79.71 |
| 15- | 106.24 | 96.25 | 90.63 | 94.48 | 82.97 | 90.43 | 94.27 | 81.45 | 78.51 | 83.92 |
| 20- | 105.41 | 101.42 | 97.64 | 101.40 | 88.72 | 95.43 | 98.82 | 83.81 | 81.04 | 83.31 |
| 25- | 99.66 | 98.06 | 93.77 | 95.82 | 86.55 | 92.23 | 97.02 | 83.60 | 81.07 | 83.60 |
| 30- | 82.29 | 80.92 | 77.13 | 81.59 | 75.30 | 82.17 | 84.81 | 73.89 | 73.50 | 76.26 |
| 35- | 77.87 | 77.00 | 75.00 | 76.67 | 68.58 | 73.37 | 76.82 | 68.56 | 67.84 | 70.99 |
| 40- | 60.53 | 61.85 | 60.06 | 63.28 | 60.86 | 65.06 | 67.89 | 61.70 | 59.62 | 60.93 |
| 45- | 48.19 | 48.48 | 47.51 | 50.14 | 47.67 | 51.95 | 54.45 | 50.14 | 49.87 | 52.72 |
| 50- | 44.32 | 43.93 | 42.62 | 44.74 | 41.93 | 44.51 | 46.30 | 41.76 | 41.83 | 44.05 |
| 55- | 40.80 | 40.08 | 39.46 | 40.59 | 37.76 | 40.99 | 41.62 | 37.14 | 37.10 | 38.55 |
| 60- | 33.19 | 32.92 | 32.91 | 33.93 | 31.45 | 34.80 | 35.64 | 32.22 | 31.98 | 33.01 |
| 65- | 25.73 | 25.45 | 25.94 | 26.65 | 24.50 | 27.56 | 28.54 | 26.10 | 25.93 | 27.17 |
| 70- | 17.85 | 18.32 | 18.31 | 19.16 | 17.60 | 19.66 | 19.82 | 18.13 | 18.18 | 18.95 |
| 75- | 11.18 | 11.64 | 11.73 | 12.33 | 11.24 | 12.21 | 12.39 | 11.25 | 11.28 | 11.86 |
| 80- | 5.92 | 6.33 | 6.14 | 6.64 | 5.86 | 6.77 | 6.66 | 6.09 | 6.35 | 6.55 |
| 85+ | 2.81 | 2.59 | 2.90 | 3.08 | 3.17 | 3.67 | 3.38 | 3.13 | 3.30 | 3.51 |
| Total | 1033.84 | 998.70 | 961.01 | 995.78 | 904.82 | 973.43 | 1011.62 | 886.32 | 867.05 | 904.93 |
The obtained information related to death in China was based on the causes of death reported by qualified physicians on medical death certificates. The underlying causes of death were ascertained following the procedures specified by the World Health Organization in the (Manual of the International Statistical Classification of Diseases, Injuries, and Causes of Death), ninth revision (ICD-9). If the death causes of the deceased were either uncertain, or out of accord with the classification standards or could not be coded with ICD-9, the registry staff would clarify and/or justify the causes of death through interviewing the relatives of the patient or consulting his or her physicians.
Evaluation on data quality
Since the beginning of the disease surveillance, the National Center of DSPs had developed a series of quality control and evaluation system to examine data quality from DSPs every year, to assure that the surveillance data over the period of 1991-2000 were reliable and valuable for estimating the mortality of surveillance population. The quality of the data was evaluated as follows: (1) The demographic data and distribution of population by age and gender were credible and suitable for a denominator for calculating the rates since the United Nations Integrated Index of Population[9] fluctuates between 15 and 20. (2) The cases with uncertain death causes accounted for around 5% of all death cases. (3) Three types of medical evidences from medical records or files were used for the diagnosis and classification of the causes of death, including autopsy or biopsy, laboratory or radiology tests (clinical diagnosis), and inference after death (without certain documentation from biopsy or radiology test, but making highly suspicious diagnosis in terms of clinical symptoms, signs and some laboratory tests). Cases of pancreatic cancer, diagnosed using pathological test and clinical test, accounted for 31.56% and 64.13% respectively, the remaining (4.31%) was determined by inference diagnosis. The percentage of cases diagnosed at different levels of hospitals was as follows: 92% by hospitals of county grade and above (36.4% by provincial grade and 29.1% by municipal grade). This showed that the diagnosed death causes were credible and could be used for data analysis. (4) Validation was undertaken through periodic under-reporting surveys. A stratified three-stage cluster sampling design was adopted by each DSP to obtain the under-reporting rate. The overall under-reporting rate for mortality fluctuated between 12.25% and 22.46%.
Analysis methods
Based on the surveillance data from the DSPs during the period of 1991-2000, the distribution of death rate of pancreatic cancer was described by age group, gender, calendar year, rural/urban residence and administrative district. The reported death rate was expressed as the reported number of deaths of pancreatic cancer per 100000 populations per year. The adjusted death rate was calculated with the formula, reported death rate/(1-under-reporting rate) and the age-standardized rate was calculated with the indirect method in terms of World Standard Population (http://www3.who.int/whosis/discussion_papers/htm/paper31.htm). All analyses were conducted using software EPI 2000.
RESULTS
During 1991-2000, 504604 death cases were reported in DSPs population. The reported death rate fluctuated between 507.67 and 546.60 per 100000 populations in 1991-2000. The adjusted death rate remained relatively stable in 1991-1997 and increased gradually after 1997. But the age-standardized death rate decreased slightly during the 10 years.
Eighty six thousand five hundred and fifty six patients died from tumor in the 10 years, accounting for 17.15% of total death cases reported in DSPs population. The reported, adjusted and age-standardized death rate for tumor increased from 79.86, 95.57 and 118.74 per 100000 in 1991 to 104.91, 135.30 and 145.63 in 2000 respectively, with a steady increase on average of 3.08%, 3.94% and 2.29% per year. Tumor contributed 15.65% of all deaths in 1991, and 19.23% in 2000. Tumor ranked the third of death cause in all death cases during 1991-1998, and went up to the second rank in 1999-2000.
One thousand six hundred and nineteen deaths were attributed to pancreatic cancer during the 10 years, accounting for 1.87% of all deaths due to tumors. The reported, adjusted and age-standardized mortality rate increased by 5.53%, 6.41% and 4.57% annually, from 1.46, 1.75, 2.18 per 100000 populations in 1991 to 2.38, 3.06, and 3.26 per 100000 populations in 2000. Pancreatic cancer accounted for 1.83% of all deaths due to tumor in 1991 and 2.26% in 2000, with the 6-8th rank for men and the 9-10th for women. The details and the time trend are shown in Table 2.
Table 2 Mortality rate of pancreatic cancer during 1991-2000 in China (1/100000).
| Year | Death number | Reported death rate | Adjusted death rate | Age-standardized death rate | Deaths due to tumor (%)a |
|---|---|---|---|---|---|
| 1991 | 151 | 1.46 | 1.75 | 2.18 | 1.83 |
| 1992 | 139 | 1.39 | 1.60 | 1.92 | 1.66 |
| 1993 | 129 | 1.34 | 1.54 | 1.80 | 1.51 |
| 1994 | 142 | 1.43 | 1.63 | 1.90 | 1.69 |
| 1995 | 145 | 1.60 | 1.85 | 2.12 | 1.79 |
| 1996 | 161 | 1.65 | 1.91 | 2.14 | 1.75 |
| 1997 | 168 | 1.66 | 1.92 | 2.18 | 1.86 |
| 1998 | 183 | 2.06 | 2.66 | 2.92 | 2.10 |
| 1999 | 186 | 2.16 | 2.78 | 2.96 | 2.23 |
| 2000 | 215 | 2.38 | 3.06 | 3.26 | 2.26 |
The death rate of pancreatic cancer was closely related to age. The majority (69.62%) of the deaths of pancreatic cancer were seen in the age group of 60 years and more, while fewer cases (3.95%) were found among people aged less than 40 years. Table 3 also shows the changing trend of annual mortality in all age groups during the 10 years. The annual mortality rates in the 10 years fluctuated around 2 per 100000 populations in the age group of 45 to 54 years, but the rates were higher than 10 per 100000 populations in the group aged 65 to 84 years, approximately 5-fold difference between these groups. Around 2-fold increase was found in the mortality in the last few years compared with that at the beginning of 1990’s in people aged over 65 years.
Table 3 Reported death rate of pancreatic cancer by age dur-ing 1991-2000 in China (1/100000).
| Age group | 1991 | 1992 | 1993 | 1994 | 1995 | 1996 | 1997 | 1998 | 1999 | 2000 |
|---|---|---|---|---|---|---|---|---|---|---|
| 0- | 0.00 | 0.00 | 0.00 | 0.00 | 0.00 | 0.00 | 0.00 | 0.00 | 0.00 | 0.00 |
| 15- | 0.19 | 0.00 | 0.05 | 0.00 | 0.06 | 0.00 | 0.05 | 0.00 | 0.00 | 0.00 |
| 25- | 0.22 | 0.11 | 0.00 | 0.11 | 0.12 | 0.06 | 0.16 | 0.19 | 0.26 | 0.06 |
| 35- | 0.51 | 0.14 | 0.89 | 0.64 | 0.46 | 0.36 | 0.41 | 1.15 | 0.63 | 0.53 |
| 45- | 2.70 | 2.06 | 2.44 | 0.95 | 1.45 | 1.76 | 2.38 | 2.50 | 2.84 | 1.65 |
| 55- | 6.49 | 6.71 | 4.01 | 6.58 | 6.94 | 6.73 | 6.99 | 6.78 | 6.37 | 7.27 |
| 65- | 9.18 | 10.74 | 9.49 | 9.17 | 9.98 | 11.86 | 11.17 | 13.11 | 16.55 | 18.87 |
| 75- | 10.53 | 10.01 | 11.76 | 14.23 | 18.13 | 13.17 | 11.03 | 18.45 | 16.45 | 23.36 |
| 85+ | 17.82 | 7.74 | 6.89 | 13.01 | 6.32 | 16.36 | 14.79 | 15.98 | 9.08 | 17.10 |
| Total | 1.46 | 1.39 | 1.34 | 1.43 | 1.60 | 1.65 | 1.66 | 2.06 | 2.15 | 2.37 |
Of all the reported death cases of pancreatic cancer between 1991 and 2000, 975 were diagnosed in men and 644 in women. The mortality rates of pancreatic cancer by gender are presented in Table 4. The data showed that all the reported, adjusted and age-standardized rates in males increased during the 10 years, from 1.86, 2.23, and 2.94 per 100000 populations in 1991 to 2.70, 3.48, and 3.87 per 100000 populations in 2000, with an increase on average of 4.23%, 5.07% and 3.10% per year respectively. All these rates in female increased from 1.05, 1.25, and 1.49 to 2.04, 2.63 and 2.68 per 100000 populations, with an annual average increase of 7.66%, 8.61% and 6.74%. The male to female standardized death rate ratios decreased from 1.97 in 1991 to 1.44 in 2000.
Table 4 Mortality rate of pancreatic cancer by gender during 1991-2000 in China (1/100000).
| Year | Male | Female | ||||||
|---|---|---|---|---|---|---|---|---|
| Death number | Reported death rate | Adjusted death rate | Age-standardized rate | Death number | Reported death rate | Adjusted death rate | Age-standardized rate | |
| 1991 | 98 | 1.86 | 2.23 | 2.94 | 53 | 1.05 | 1.25 | 1.49 |
| 1992 | 97 | 1.90 | 2.19 | 2.77 | 42 | 0.86 | 0.99 | 1.13 |
| 1993 | 81 | 1.66 | 1.90 | 2.36 | 48 | 1.02 | 1.17 | 1.29 |
| 1994 | 79 | 1.56 | 1.78 | 2.24 | 63 | 1.29 | 1.47 | 1.62 |
| 1995 | 94 | 2.04 | 2.36 | 2.87 | 51 | 1.15 | 1.33 | 1.44 |
| 1996 | 90 | 1.82 | 2.10 | 2.47 | 71 | 1.48 | 1.72 | 1.85 |
| 1997 | 98 | 1.89 | 2.20 | 2.61 | 70 | 1.41 | 1.63 | 1.76 |
| 1998 | 106 | 2.34 | 3.02 | 3.45 | 77 | 1.77 | 2.28 | 2.40 |
| 1999 | 108 | 2.44 | 3.15 | 3.57 | 78 | 1.83 | 2.36 | 2.40 |
| 2000 | 124 | 2.70 | 3.48 | 3.87 | 91 | 2.04 | 2.63 | 2.68 |
The distribution of pancreatic cancer differed among the administrative districts (Table 5). The reported death rates in Northeast and East China were higher than those in the other 5 districts. After adjusted by the under-reporting rates for different districts, the rates of Northeast and East China were still higher than the latter (Figure 1).
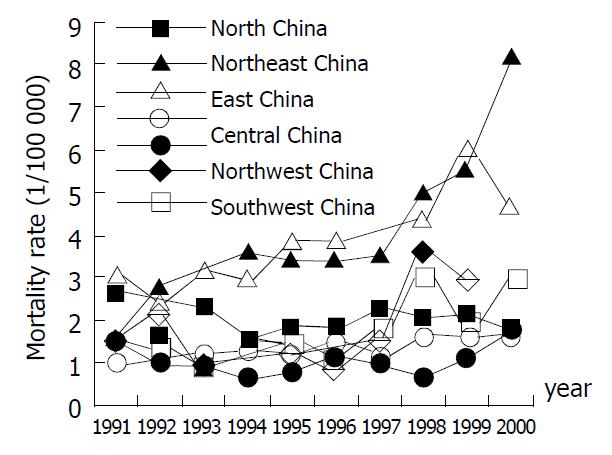
Figure 1 The adjusted mortality rate of pancreatic cancer by different districts, China, 1991-2000.
Table 5 Reported death rate of pancreatic cancer by the ad-ministrative district of DSPs, China, 1991-2000 (1/100000).
| Year China | North China | Northeast China | East China | Central China | South China | Northwest China | Southwest China |
|---|---|---|---|---|---|---|---|
| 1991 | 2.22 | 1.23 | 2.52 | 0.85 | 1.26 | 1.28 | 1.14 |
| 1992 | 1.43 | 2.43 | 2.10 | 0.86 | 0.90 | 1.93 | 1.15 |
| 1993 | 2.01 | 0.70 | 2.75 | 0.95 | 0.74 | 0.76 | 0.71 |
| 1994 | 1.27 | 3.18 | 2.62 | 1.13 | 0.60 | 0.88 | 0.92 |
| 1995 | 1.67 | 3.30 | 3.33 | 1.01 | 0.73 | 0.91 | 1.08 |
| 1996 | 1.68 | 3.37 | 3.34 | 1.27 | 1.07 | 0.67 | 0.78 |
| 1997 | 2.08 | 3.39 | 3.01 | 0.96 | 0.89 | 1.17 | 1.37 |
| 1998 | 1.80 | 4.26 | 4.04 | 1.31 | 0.51 | 1.61 | 1.85 |
| 1999 | 1.83 | 4.72 | 5.51 | 1.28 | 0.89 | 1.29 | 1.15 |
| 2000 | 1.55 | 6.96 | 4.31 | 1.26 | 1.48 | 0.73 | 1.79 |
The distribution of pancreatic cancer was variable among rural and urban areas as well. The reported mortality rates in the urban areas were much higher than those in the rural areas. After adjusted by the differential under-reporting rates, the adjusted rates in the urban areas were still higher than those in the rural areas. And the death rates of pancreatic cancer displayed an increasing trend for both rural and urban areas during the period of 1991-2000 (Table 6). In 1991 the reported death rate of pancreatic cancer was 3.37 per 100000 populations in the urban areas and 0.91 in the rural areas, and the adjusted death rates were 3.97 and 1.09, respectively. In 2000, the correspondent rates were 5.53 and 1.54, 7.32 and 1.97, respectively. Between 1991 and 2000, the reported and adjusted death rates increased by 5.02% and 7.03% per year in the urban areas and 6.02% and 6.80% in the rural areas, respectively.
Table 6 Mortality rate of pancreatic cancer by areas during 1991-2000 in China (1/100000).
| Year | Reported death rate | Adjusted death rate | ||||
|---|---|---|---|---|---|---|
| Urban | Rural | Ratio of urban to rural | Urban | Rural | Ratio of urban to rural | |
| 1991 | 3.37 | 0.91 | 3.70 | 3.97 | 1.09 | 3.64 |
| 1992 | 3.00 | 0.92 | 3.26 | 3.37 | 1.06 | 3.18 |
| 1993 | 3.25 | 0.81 | 4.01 | 3.65 | 0.93 | 3.93 |
| 1994 | 3.50 | 0.84 | 4.17 | 3.84 | 0.96 | 4.00 |
| 1995 | 3.63 | 0.99 | 3.67 | 4.28 | 1.14 | 3.75 |
| 1996 | 4.12 | 0.88 | 4.68 | 4.86 | 1.01 | 4.81 |
| 1997 | 3.80 | 1.02 | 3.73 | 4.47 | 1.18 | 3.79 |
| 1998 | 3.77 | 1.56 | 2.42 | 4.99 | 2.00 | 2.50 |
| 1999 | 3.89 | 1.61 | 2.42 | 5.15 | 2.07 | 2.49 |
| 2000 | 5.53 | 1.54 | 3.59 | 7.32 | 1.97 | 3.72 |
Figure 2 shows the dynamic trend of mortality rate of pancreatic cancer and other common tumors. The increasing trend of pancreatic cancer paralleled the slight variation seen in rectal and colonic cancer, while the death rates of hepatic, stomach and lung cancers changed more remarkablely.
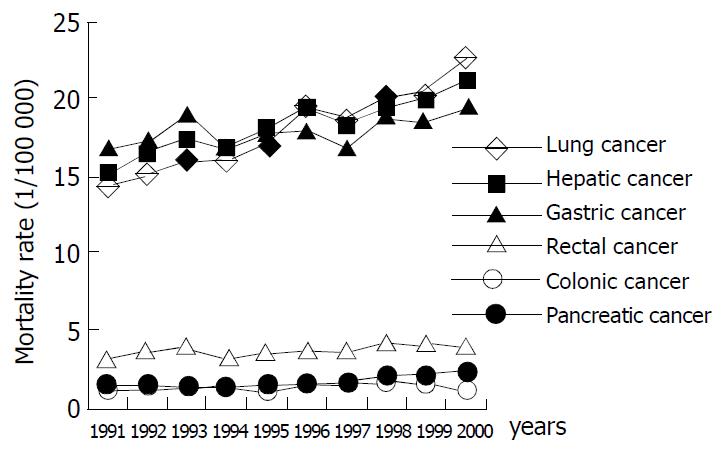
Figure 2 The trend of reported mortality of pancreatic cancer and some major cancers in DSP, China, 1991-2000.
DISCUSSION
Our data analysis was performed based on the data of demography and death, collected through DSPs over the period from 1991 to 2000. The DSPS data were of good representative ness due to their selection by probability sampling and their rigorous management[8] and therefore the results derived from surveillance population can be inferred to health status of national population. The assessment of indicators used for data quality evaluation, including the United Nations Integrated Index on Population, the proportion of cases with uncertain death cause, the diagnosis evidence of pancreatic cancer and the under-reporting rate, demonstrates that these data are reliable and the mortality rate of pancreatic cancer derived from the DSPs data might be used to estimate the death level over the whole community. However, the mortality rates reported in this study might be lower in view of the impact of technology development in the diagnosis of pancreatic cancer and its nonspecific clinical symptoms.
Pancreatic cancer may be one of the diseases that are correlated with industrialization. Reports from the studies on the mortality of pancreatic cancer worldwide in 1990 suggested that majority deaths (66%) occurred in developed countries[10]. WHO reported [11] the age-standardized mortality rates of pancreatic cancer in Western developed countries such as the United States, the United Kingdom, Australia, and Japan, ranged from 6 to 8 per 100000 in males, and 4 to 6 in females, which were about 2-4 times higher than that in China (about 2 to 3 per 100000 in males and 1 to 3 in females) in the same period. But in these countries, the mortality rate of pancreatic cancer, both in males and females, have leveled off and even dropped by the end of last century. And in some Asian countries, such as South Korea and Singapore, the age-standardized rates of pancreatic cancer are also higher than those in China, even though not reaching the peak yet[11]. In addition, we have seen a rapid increasing of death rates of pancreatic cancer in China, particularly among those aged over 65 years in the recent decade. The reported, adjusted and age-standardized death rates of pancreatic cancer have increased by 62.33%, 74.86% and 49.54% respectively. This is, to some extent, explained by the improved diagnosis and cancer death registration since pancreatic cancer is difficult to be diagnosed and classified[31], but it is also probably attributed to the increased risk factors associated with industrialization, such as diet- and smoking-related factors as well as life-style changes[21,22]. At present, little is known about the etiology of pancreatic cancer. Cigarette smoking is the only firmly established factor[17,25-28], with a 1. 2- to 3.1-fold increase in risk. Smoking, however, cannot by itself totally explain the increasing trends. There is less certainty concerning the risks associated with a range of dietary factors. Some studies have reported an increased risk with higher consumption of meat, protein and cholesterol and lower consumption of fruits and vegetables[27-30].
The role of life-style and dietary factors[27-30] in the etiology of pancreatic cancer is also supported by the higher mortality rates observed in the urban areas. Of course, the higher rates in the urban areas could be partly attributed to the improved diagnosis. Also our data showed that the death rates of pancreatic cancer were not identical in different administrative districts. The mortality rate was considerably higher in Northeast and East China than that in the other 5 districts, and the reasons led to this difference need to be discussed further, but a partial reason might be associated with higher level of industrialization and urbanization in these areas.
The mortality rate of pancreatic cancer was strongly related to age in our study. Our study indicated that the majority of death cases of pancreatic cancer occurred in the age group of 60 years or older, and the patients aged less than 45 years only accounted for 3.95%, almost the same as the results in other studies[12-17]. Similar to the other studies[11,14,18-20], our data have also found the gender difference between male and female. And the mortality from pancreatic cancer in males was higher than that in females, but the male to female mortality rate ratio showed a decreased trend in the period of 1991-2000.
Our study indicated that the increasing trend of mortality rate of pancreatic cancer paralleled that of rectal cancer. And other studies have also shown that there are remarkable similarities between the increased incidence of pancreas cancer and breast cancer in women and prostate cancer in men, and bowel cancer in both sexes over approximately the same period[23,24]. Dietary- and smoking- factors as the common risk factors may be relevant to the similarly increased trends of breast[33], prostate[32], bowel[34] and pancreatic cancers.
It is suggested that with the entry into an aging society and urbanization in China, the peak mortality of pancreatic cancer arrive soon in the next few decades. Therefore, it is crucial to carry out further studies on the etiology of pancreatic cancer and set up screening indicators earlier to reduce the number of deaths from pancreatic cancer.
Footnotes
Edited by Yuan HT and Wang XL
References
| 5. | Qian MF, Wang XH, Ma XY, Lei TH, Yao KY. Aresearch on the epidemiologic trend and mortality with cancer in Jiashan County. Zhongguo zhongliu. 2001;10:381-383. [PubMed] [DOI] [Cited in This Article: ] |
|---|
| 6. | Tan YD, Jin YS, Lu XJ, Zhu YH. The change of death spectrum for major malignancies in Xiaoshan from 1970s to 1990s. Zhejiang Zhongliu. 2000;6:128-129. [PubMed] [DOI] [Cited in This Article: ] |
|---|
| 7. | Men BY, Li SY, Wang Y. [A comparison between the results of cancer mortalities in 1972-1975 and in 1992-1994 in a rural area of Shanxi Province, China]. Zhonghua Liuxingbingxue Zazhi. 1997;18:160-163. [PubMed] [DOI] [Cited in This Article: ] |
|---|
| 13. | Tan HP, Smith J, Garberoglio CA. Pancreatic adenocarcinoma: an update. J Am Coll Surg. 1996;183:164-184. [PubMed] [DOI] [Cited in This Article: ] |
|---|
| 20. | Karlson BM, Ekbom A, Josefsson S, McLaughlin JK, Fraumeni JF, Nyrén O. The risk of pancreatic cancer following pancreatitis: an association due to confounding. Gastroenterology. 1997;113:587-592. [PubMed] [DOI] [Cited in This Article: ] |
|---|
| 21. | Chinese Academy of Preventive Medicine, Dept. of Disease Con-trol of Ministry of Health, P. R. China, Chinese Association of Smoking or Health, Office of Committee of the National Patri-otic Health Campaign. Smoking and health in China, 1996 na-tional prevalence survey of smoking pattern. Beijing, China: China Science and Technology Press. 1997;2-4. [PubMed] [DOI] [Cited in This Article: ] |
|---|
| 23. | Stephens FO. The increased incidence of cancer of the pancreas: is there a missing dietary factor Can it be reversed. Aust N Z J Surg. 1999;69:331-335. [PubMed] [DOI] [Cited in This Article: ] |
|---|
| 28. | Baghurst PA, McMichael AJ, Slavotinek AH, Baghurst KI, Boyle P, Walker AM. A case-control study of diet and cancer of the pancreas. Am J Epidemiol. 1991;134:167-179. [PubMed] [DOI] [Cited in This Article: ] |
|---|
| 29. | Farrow DC, Davis S. Diet and the risk of pancreatic cancer in men. Am J Epidemiol. 1990;132:423-431. [PubMed] [DOI] [Cited in This Article: ] |
|---|
| 30. | Norell SE, Ahlbom A, Erwald R, Jacobson G, Lindberg-Navier I, Olin R, Törnberg B, Wiechel KL. Diet and pancreatic cancer: a case-control study. Am J Epidemiol. 1986;124:894-902. [PubMed] [DOI] [Cited in This Article: ] |
|---|
| 32. | Shirai T, Asamoto M, Takahashi S, Imaida K. Diet and prostate cancer. Toxicology. 2002;181-182:89-94. [PubMed] [DOI] [Cited in This Article: ] |
|---|
| 33. | Wolff MS, Britton JA, Wilson VP. Environmental risk factors for breast cancer among African-American women. Cancer. 2003;97:289-310. [PubMed] [DOI] [Cited in This Article: ] |
|---|