DLProf Viewer User Guide (original) (raw)
This section describes each of the available views in the DLProf Viewer.
3.1. Terms and Definitions
| Term | Definition |
|---|---|
| Aggregation | The rollup of metrics, given an iteration start, iteration stop, and key node. |
| Op Node | A node in the graph where an operation is performed on the incoming tensor. |
| Model, Graph, Network |
3.2. Pane Overview
The DLProf Viewer user interface is divided into two panes:
| Pane | Definintion |
|---|---|
| Content Pane | Otherwise known as the VIEWS pane, this is where you will see all of the different pieces of the profiled neural network. |
| Details Pane | This pane is to display additional details about the information selected in the content pane. Let’s say you’re looking at the Kernel Summary panel in the content pane, and you want to see more information about the kernels. Click on the  button (tooltip = ‘Show Kernel Details’). The detailed kernel information will appear in the Details Pane. Click the ‘X’ button to remove the details pane. button (tooltip = ‘Show Kernel Details’). The detailed kernel information will appear in the Details Pane. Click the ‘X’ button to remove the details pane. |
3.3. Navigation Bar
This standard navigation bar is a navigation header that is placed at the top of the viewer. It contains a few buttons like most standard web sites. It does not scroll off the screen so these buttons are always available.

Some screen shots in this documentation might have a pulldown menu called Domain in the Navigation Bar. This feature has been removed from the DLProf Viewer.
UI Controls
| Control | Definition |
|---|---|
| NVIDIA DLProf Viewer button | This is the branding button. When clicked, the user is navigated to the Dashboard view. |
| View | This dropdown provides a list of available views. Clicking on a name in the dropdown loads that view in the main display panel. Available views are: Dashboard Op Type Summary Group Ops Ops and Kernels Kernels by Iteration Kernels by Op Iterations GPUs (when more than one GPU exists in profile run) |
| Aggregation (optional) | This optional dropdown appears when a network has been re-aggregated (ie, aggregated more than once). An aggregation is a combination of iteration start, iteration stop, and key node. The iter stop and iter stop values are listed in the dropdown as seen above. To see the corresponding key node, click the dropdown and hover over each aggregation in the list.. Aggregations can be created in the Iterations view. The workflow and user interface controls are documented in the Iterations view section. |
| Help / Deep Learning Profiler | This link navigates users to the online version of the DLProf User Guide. |
| Help / Viewer | This link navigates users to the online version of this document |
| Help / Contact Us | Let us know! If you have a comment, question, or suggestion, click this link. It will launch your default email software with the TO address already filled in. Just fill in the Subject line, type your email message, then click send. |
3.4. Content Pane
3.4.1. Dashboard
The Dashboard view provides a high level summary of the performance results in a panelized view. This view serves as a starting point in analyzing the results and provides several key metrics.
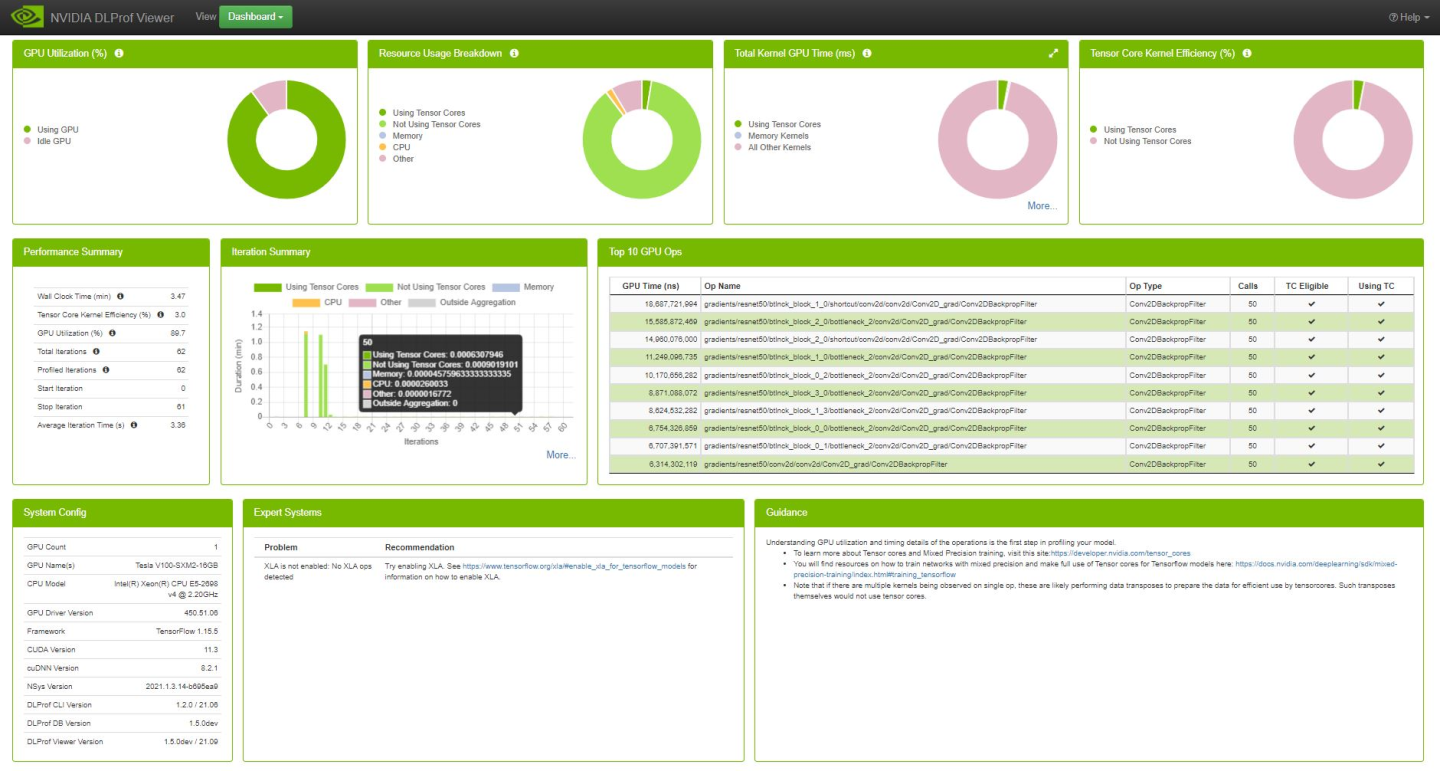
3.4.1.1. GPU Utilization Panel
The GPU Idle panel visually indicates the percentage of GPU utilization time during execution of aggregated iterations. Hovering over a slice in the chart will show the numeric percentage.
Fields
| Legend Label | Definition |
|---|---|
| Using GPU | The average GPU utilization percentage across all GPUs. |
| Idle GPU | The average GPU idle percentage across of all GPUs. |
UI Controls
| Control | Definition |
|---|---|
| Legend Label | Toggle between hiding and showing legend entry in chart. |
| More... | Show drop-down menu of more views (only visible when more than one GPU was used during profiling). |
3.4.1.2. Resource Usage Breakdown Panel
The panel provides a breakdown of profile activity into resource categories.

Fields
| Legend Label | Definition |
|---|---|
| Using Tensor Cores | Accumulated duration of all kernels using tensor cores. |
| Not Using Tensor Cores | Accumulated duration of all kernels not using tensor cores. |
| Memory | Accumulated duration of all memory operations. |
| Dataloader | Accumulated duration of dataloader operations. |
| I/O | Accumulated duration of I/O operations. |
| CPU | Accumulated duration of all CPU operations. |
| Other | All time not in any other category. |
UI Controls
| Control | Definition |
|---|---|
| Legend Label | Toggle between hiding and showing legend entry in chart. |
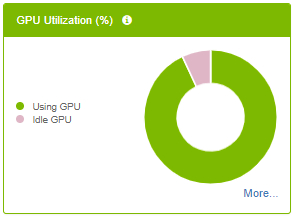
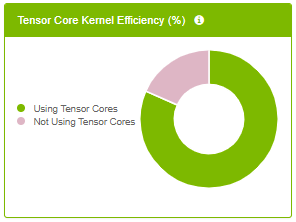
3.4.1.3. Total Kernel GPU Time Panel
The panel provides key metrics about the kernels in the network aggregated over the specific iteration range.
- Hovering over a slice in the chart will show the aggregated GPU time.
- Clicking a legend item will toggle its visualization in the chart.
Fields
| Legend Label | Definition |
|---|---|
| Using Tensor Cores | Aggregates the total GPU time for all kernels using Tensor Cores. |
| Memory Kernels | Aggregates the total GPU time for all memory-related kernels. |
| All Other Kernels | Aggregates the total GPU time for all remaining kernel types. |
UI Controls
| Control | Definition |
|---|---|
|
Show Kernel Details panel in Details Pane. |
| Legend Label | Toggle between hiding and showing legend entry in chart. |
| More... | Show drop-down menu of more views. |
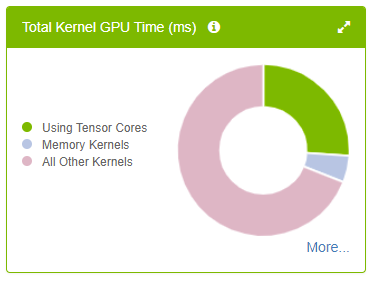
3.4.1.4. Tensor Core Kernel Efficiency Panel
- Hovering over a slice in the chart will show the percentage.
- Clicking a legend item will toggle its visualization in the chart.
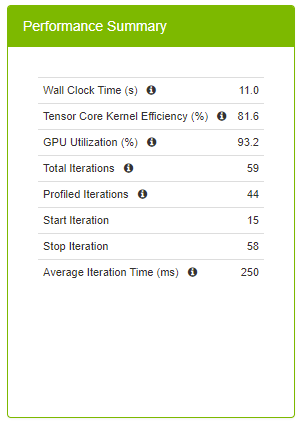
Performance Summary Panel
The Performance Summary panel provides top level key metrics about the performance data aggregated over the specific iteration range. A helpful tooltip text will appear when hovering over the ‘i’ icon.
| Field | Definition |
|---|---|
| Wall Clock Time | This is the total run time for the aggregation range, and is defined as the time between the start time of the first op in the starting iteration on the CPU and the end time of the last op in the final iteration on either the CPU or GPU, whichever timestamp is greatest. |
| Tensor Core Kernel Efficiency % | This high level metric represents the utilization of Tensor Core enabled kernels. Tensor Core operations can provide a performance improvement and should be used when possible. This metric is calculated by: [Total GPU Time for Tensor Core kernels] / [Total GPU Time for Tensor Core Eligible Ops] A 100% Tensor Core Utilization means that all eligible Ops are running only Tensor Core enabled kernels on the GPU. A 50% Tensor Core Utilization can mean anything from all eligible Ops are running Tensor Core kernels only half of the time to only half of all eligible Ops are running Tensor Core kernels only. This metric should be used with the Op Summary Panel to determine the quality of Tensor Core usage. Higher is better. |
| GPU Utilization % | Average GPU utilization across all GPUs. Higher is better. |
| Total Iterations | The total number of iterations found in the network. |
| Profiled Iterations | The total number of iterations used to aggregate the performance results. This number is calculated using ‘Start Iteration’ and ‘Stop Iteration’. |
| Start Iteration | The starting iteration number used to generate performance results. |
| Stop Iteration | The ending iteration number used to generate performance results. |
| Average Iteration Time | The average iteration time is the total Wall Time divided by the number of iterations. |
3.4.1.6. Iteration Summary panel
This panel visually displays iterations. Users can quickly see how many iterations are in the model, the iterations that were aggregated/profiled, and the durations of tensor core kernels in each iteration. The colors on this panel match the colors on all the other dashboard panels.
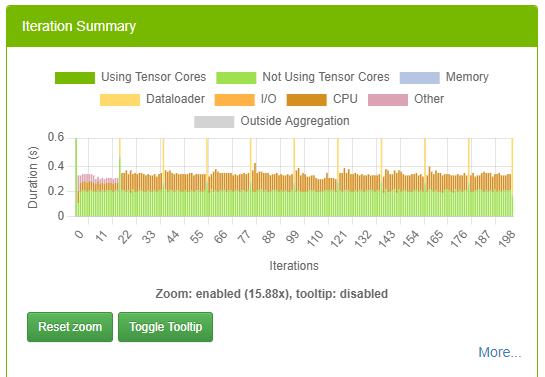
For more information on this panel, see Iterations View.
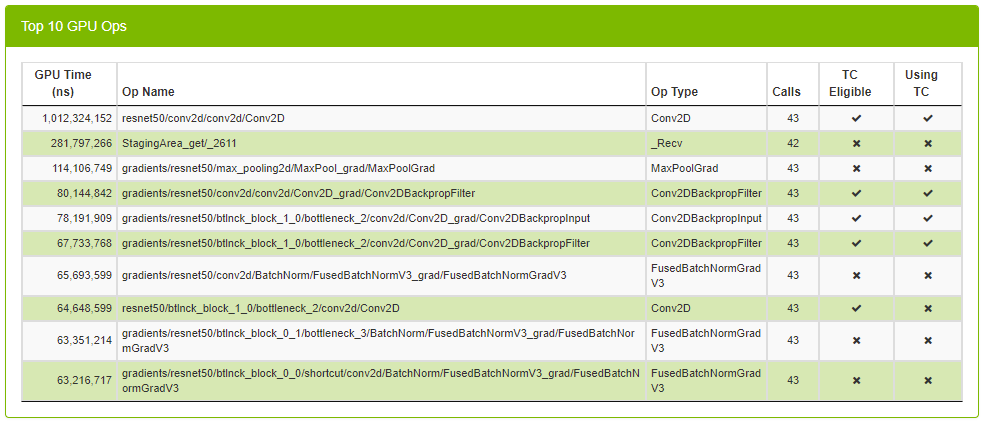
3.4.1.7. Top 10 GPU Ops Panel
Top 10 GPU Ops table shows the top 10 operations with the largest execution times on the GPU. This table comes pre-sorted with the order of each row in descending GPU Time. The table is not sortable or searchable.
| Column | Definition |
|---|---|
| GPU Time | Shows total GPU time of all kernels across all GPUs. |
| Op Name | The name of the op. |
| Direction | The fprop/bprop direction of the op. (only visible on PyTorch runs). |
| Op Type | The type of the op. |
| Calls | The number of times the op was called. |
| TC Eligible | A true/false field indicating whether or not the op is eligible to use Tensor Core kernels. |
| Using TC | A true/false field indicating whether or not one of the kernels launched in this op is using Tensor Cores. |
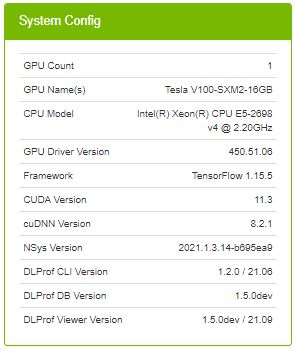
3.4.1.8. System Configuration Panel
| Field | Definition |
|---|---|
| Profile Name | (Optional) Helpful label to describe the profiled network. The value in this field corresponds to the value supplied in the --profile_name command line argument in DLProf. |
| GPU Count | The number of GPU devices found on the computer during training. |
| GPU Name(s) | A list of the GPU devices found on the computer during training. |
| CPU Model | The model of the CPU on the computer during training. |
| GPU Driver Version | The version of the driver used for NVIDIA Graphics GPU. |
| Framework | The framework used to generate profiling data (eg, TensorFlow, PyTorch). |
| CUDA Version | The version of the CUDA parallel computing platform. |
| cuDNN Version | The version of CUDA Deep Neural Network used during training. |
| NSys Version | The version of Nsight Systems used during training. |
| DLProf Version | The version of the Deep Learning Profiler used to generate the data visualized in the DLProf Viewer. |
| DLProf DB Version | The version of the DLProf database. |
| DLProf Viewer Version | The version of the DLProf Viewer. |
3.4.1.9. Expert Systems panel
The Expert Systems panel displays common issues detected in the profiled network and provides potential solutions and suggestions to address the issues. The panel will only show issues that have been detected by DLProf. For a full list of potential issues that DLProf looks for, see the Expert Systems section in the Deep Learning Profiler User Guide.
Clicking on the double-green arrows shows additional information about the detected problem.
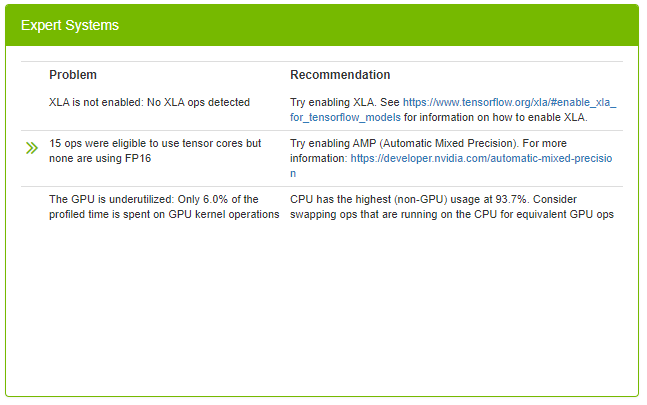
| Column | Definition |
|---|---|
| Problem | The description of the scenario that DLProf detected when profiling the network. |
| >> | (Optional) When present, clicking on the double arrows will display a new view displaying the problem in detail. |
| Recommendation | A recommendation or actionable feedback, a tangible suggestion that the user can do to improve the network. Clicking on a hyperlink inside the recommendation will open a new tab in the browser. |
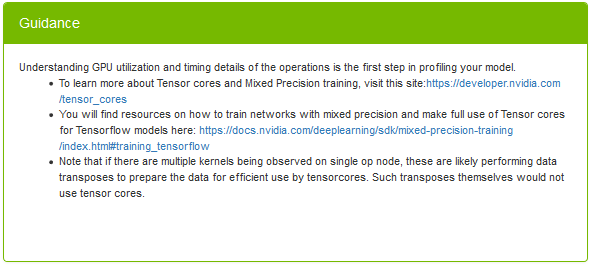
3.4.1.10. Guidance Panel
This panel provides static guidance to the user to help the user learn more about Tensor Cores, Mixed Precision training. The panel has hyperlinks for further reading. Clicking on a hyperlink inside the Guidance Panel will open a new tab in the browser.
3.4.2. Op Type Summary
This table aggregates metrics over all op types and enables users to see the performance of all the ops in terms of its types, such as Convolutions, Matrix Multiplications, etc.
See this description for all the features available in all DataTables.
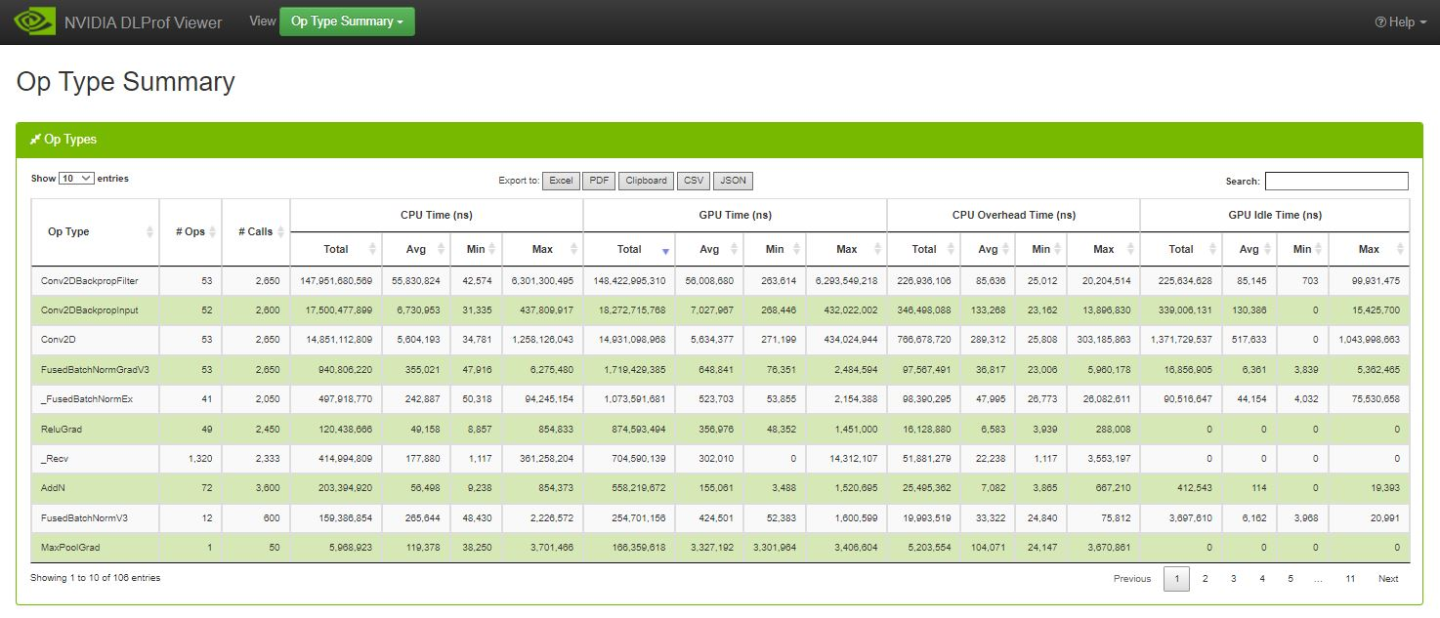
Op Type Data Table
| Column name | Description |
|---|---|
| Op Type | The operation type. |
| No. Ops | The number of ops that have the Op Type above. |
| No. Calls | Number of instances that the operation was called / executed. |
| Total CPU Time (ns) | The total CPU time of all instances of this op type. |
| Avg. CPU Time (ns) | The average CPU time of all instances of this op type. |
| Min CPU Time (ns) | The minimum CPU time found amongst all instances of this op type. |
| Max CPU Time (ns) | The maximum CPU time found amongst all instances of this op type. |
| Total GPU Time (ns) | The total GPU time of all instances of this op type. |
| Avg. GPU Time (ns) | The average GPU time of all instances of this op type. |
| Min GPU Time (ns) | The minimum GPU time found amongst all instances of this op type. |
| Max GPU Time (ns) | The maximum GPU time found amongst all instances of this op type. |
| Total CPU Overhead Time (ns) | The total CPU overhead of all instances of this op type. |
| Avg. CPU Overhead Time (ns) | The average CPU overhead of all instances of this op type. |
| Min CPU Overhead Time (ns) | The minimum CPU overhead found amongst all instances of this op type. |
| Max CPU Overhead Time (ns) | The maximum CPU overhead found amongst all instances of this op type. |
| Total GPU Idle Time (ns) | The total GPU idle time of all instances of this op type. |
| Avg. GPU Idle Time (ns) | The average GPU idle time of all instances of this op type. |
| Min GPU Idle Time (ns) | The minimum GPU idle time found amongst all instances of this op type. |
| Max GPU Idle Time (ns) | The maximum GPU idle time found amongst all instances of this op type. |
3.4.3. Group Ops
This view displays all operations in a hierarchical view. This new view is based on the ‘group node report’ provided by the DLProf CLI. Whereas the textual report provided by the CLI is a CSV file, this view is interactive by supporting filtering, sorting, and pagination. This information is interactive, it provides a powerful mechanism to quickly find ops and groups that consume too much duration.
See this description for all the features available in all DataTables.
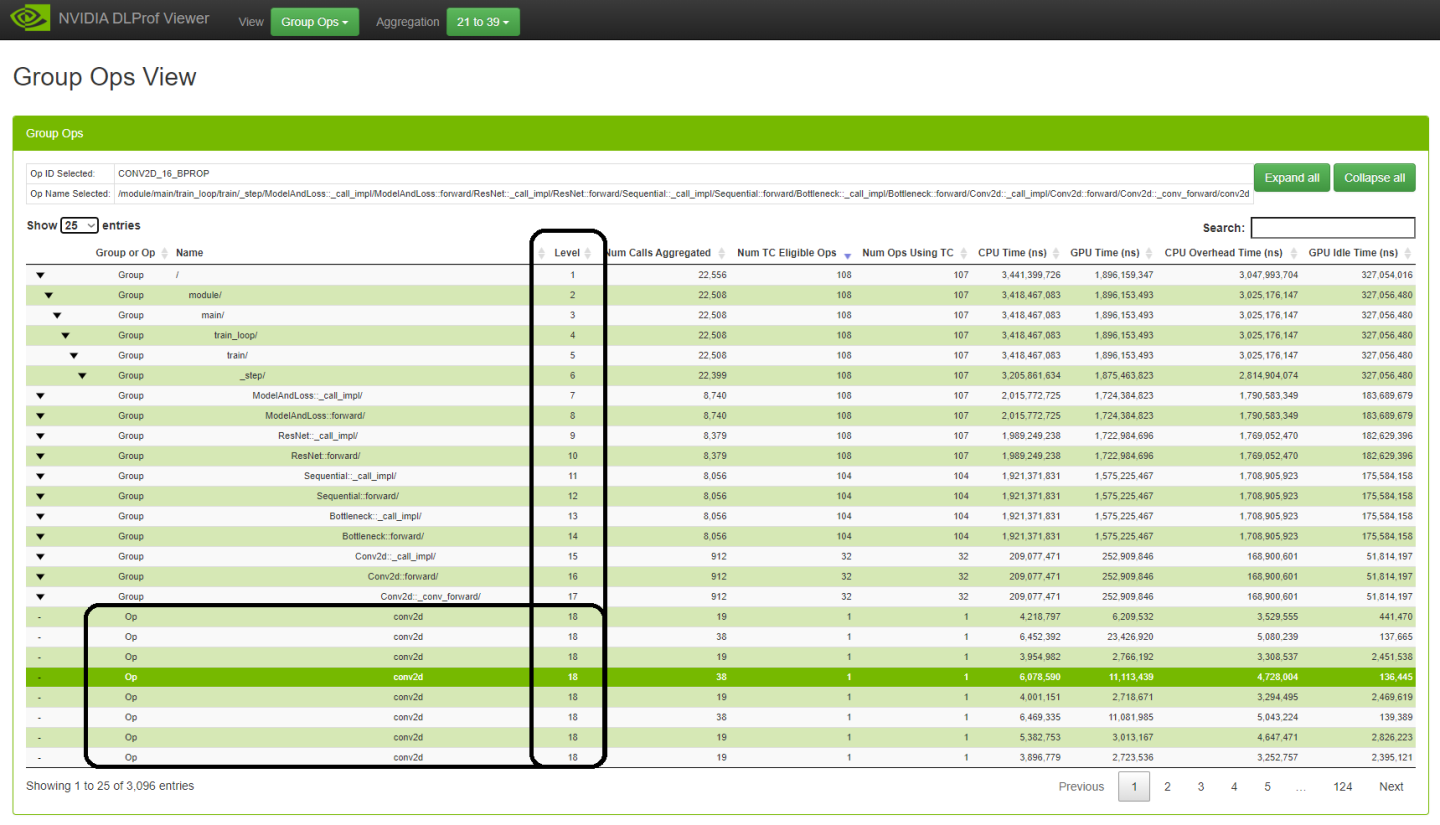
The intersection of box black highlighting boxes above depicts the first eight of 32 ops in the level 17 group called ‘Conv2d::_conv_forward’. The values in the upper levels of the network graph are the sums of all the ops in the lower levels.
Definitions
| Column | Definition |
|---|---|
| Group | An entity in the tree that represents a collection of ops. |
| Op | A normal operation in the network graph. |
| Level | Represents the depth of the group or op. Level one is the root. The higher the level value the deeper/lower the group or op is in the network graph. |
 or or  |
Depict whether Group Op is Expanded or Collapsed. The indentation of the arrows depicts the level (or depth) of the group. Note: Note: There is a bug in the 3rd party treetable control whereby a group level 7 or higher appears in column one. |
| Group or Op | One of two values: Group or Op. |
| Name | The name of the selected row. A group has an appending slash. The indentation depicts the level (or depth) of the name in the network graph. |
| Level | Represents the depth of the group or op. |
| All other columns | If an op, the values represent counts and durations for that individual op . If a group, the values represent a summation of all the encapsulated ops |
UI Controls
| Control | Definition |
|---|---|
| Expand All Collapse All | Expand or collapse all Groups. Expand All will show those Groups and Ops at level one. Collapse All will show all Groups and Ops. |
Selection Panel
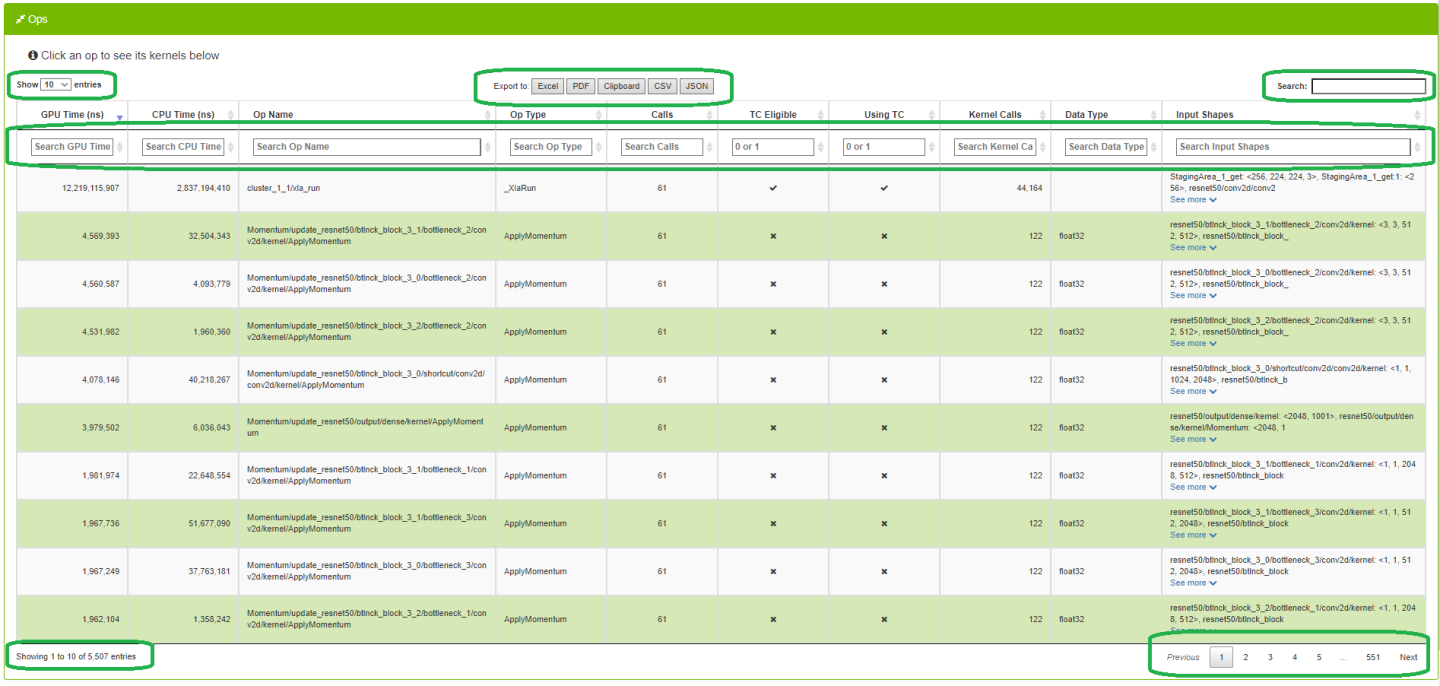
3.4.4. Ops and Kernels
This view enables users to view, search, sort all ops and their corresponding kernels in the entire network.
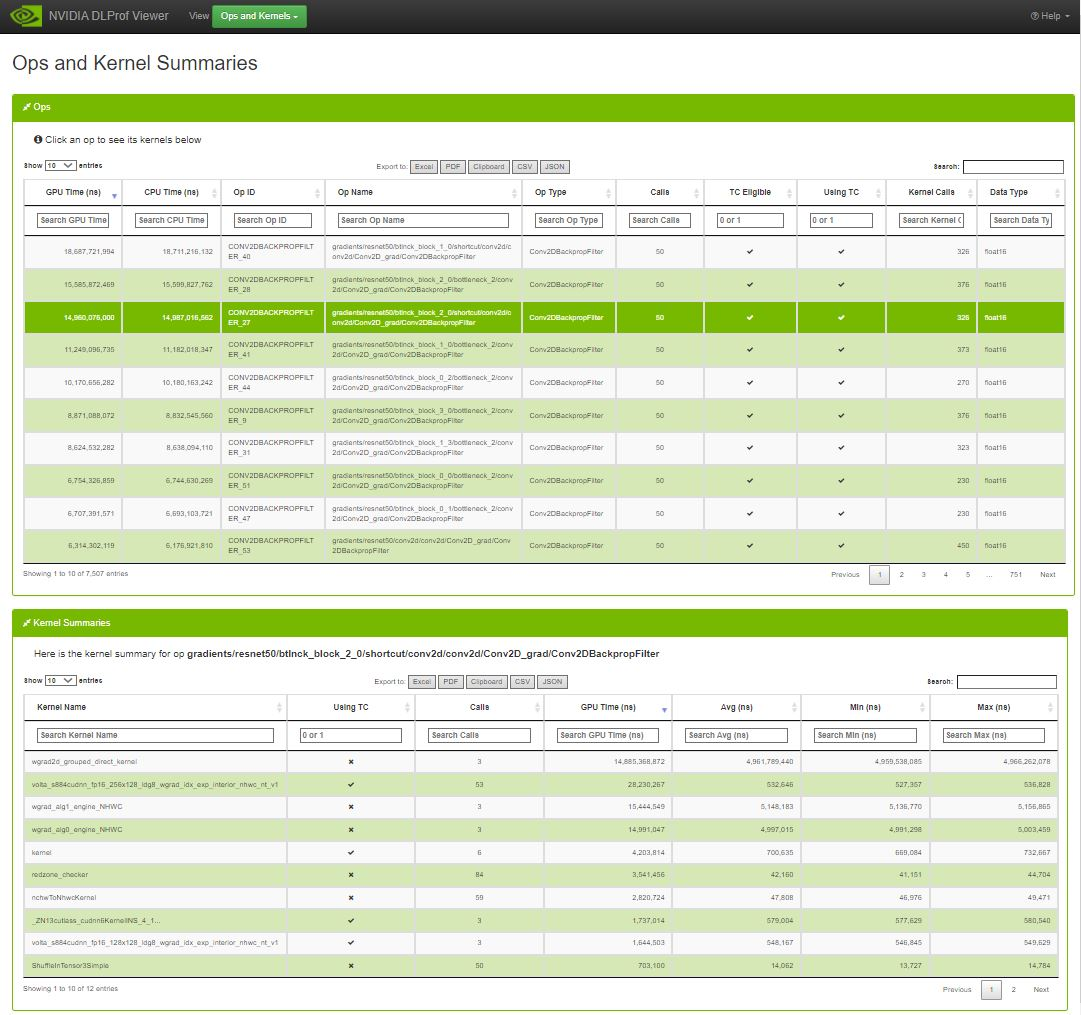
3.4.4.1. Ops Data Table
When a row is selected in the Ops table, a summary of each kernel for that op is displayed in the bottom table.
See this description for all the features available in all DataTables.
| Entry | Description |
|---|---|
| GPU Time (ns) | Cumulative time executing all GPU kernels launched for the op. |
| CPU Time (ns) | Cumulative time executing all op instances on the CPU. |
| Op Name | The name of the op. |
| Direction | The fprop/bprop direction of the op. (only visible on PyTorch runs). |
| Op Type | The operation of the op. |
| Calls | The number of times the op was called. |
| TC Eligible | A true/false field indicating whether or not the op is eligible to use Tensor Core kernels. To filter, type ‘1’ for true, and ‘0’ for false. |
| Using TC | A true/false field indicating whether or not one of the kernels launched in this op is using Tensor Cores. To filter, type ‘1’ for true, and ‘0’ for false. |
| Kernel Calls | The number of kernels launched in the op. |
| Data Type | The data type of this op (eg, float16, int64, int32) |
| Stack Trace | The stack trace of the op. (only visible on PyTorch runs). If the contents of this cell is more than 100 characters, a ‘See More’ hyperlink appears. When clicked, the full contents of the cell appears. When the cell is expanded, the hyperlink text is changed to ‘See Less’. When clicked, the cell collapses back to the first 100 characters. |
3.4.4.2. Kernel Summaries Data Table
See this description for all the features available in all DataTables.
Kernels Summary table
| Entry | Description |
|---|---|
| Kernel name | The full name of the kernel. |
| Using TC | A true/false field indicating whether or not the kernel is actually using a Tensor Core. To filter, type ‘1’ for true, and ‘0’ for false. |
| Calls | The number of times this kernel was launched. |
| GPU Time (ns) | The aggregate duration of each time the kernel was launched. |
| Avg (ns) | The average duration of each time this kernel was launched. |
| Min (ns) | The minimum duration of all kernel launches. |
| Max (ns) | The maximum duration of all kernel launches. |
3.4.5. Kernels by Iteration
The Kernels by Iterations view shows operations and their execution time for every iteration. At a glance, you can compare iterations with respect to time as well as Kernels executed.
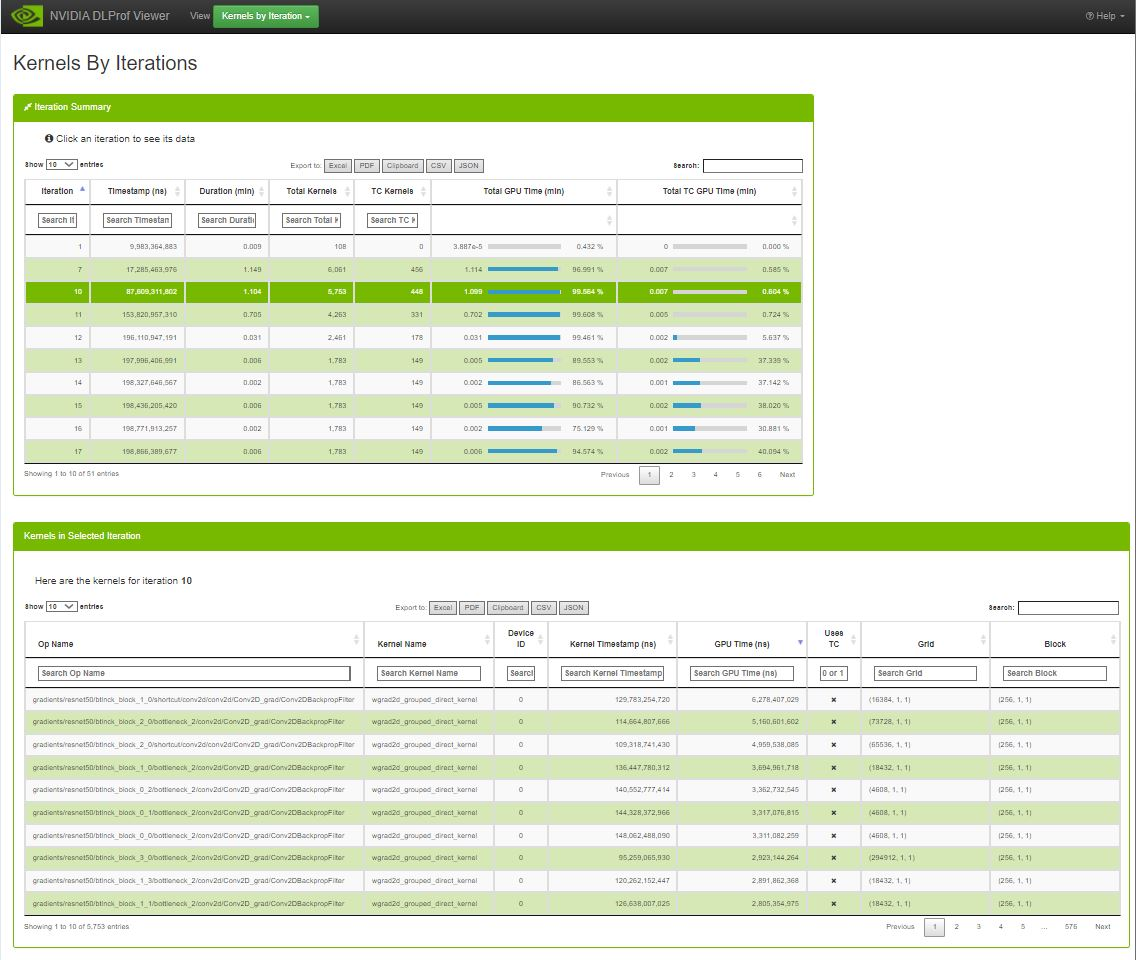
3.4.5.1. Iteration Summary Data Table
To see the kernels for a specific iteration, click a row in the top table. The ‘Kernels in Selected Iteration’ table will be filled with the kernels from the selection iteration.
See this description for all the features available in all DataTables.
| Column | Description |
|---|---|
| Iteration | The iteration interval numbers. |
| Timestamp | The exact time when this iteration started. |
| Duration | The length of time it took for this iteration to execute. Units on this column are dynamic. |
| Total Kernels | The number of GPU kernels called during this iteration. |
| TC Kernels | The number of GPU Tensor Core kernels called during the iteration. |
| Average GPU Time (μs) | Average execution time for all kernels across all GPUs during the iteration. The contents of this cell are broken into multiple pieces: The value is the average execution time of this iteration across all GPUs. The progress meter visually indicates how much of this iteration executed on the GPU. The percentage is the average GPU time of all kernels across all GPUs over the total iteration time. Hovering over this cell displays a tooltip text with helpful information. Units on this column are dynamic. |
| Average TC GPU Time (μs) | Average execution time for all Tensor Core kernels across all GPUs during the iteration. The contents of this cell are broken into multiple pieces: The value is the average execution time of Tensor Core kernels during this iteration across all GPUs. The progress meter visually indicates how much of this iteration executed Tensor Core kernels. The percentage is the average GPU time of kernels using Tensor Core across all GPUs over the total iteration time. Hovering over this cell displays a tooltip text with helpful information. Units on this column are dynamic. |
3.4.5.2. Kernels in Selected Iteration
See this description for all the features available in all DataTables.
| Column | Description |
|---|---|
| Op Name | The name of the op that launched the kernel. |
| Kernel Name | The name of the kernel. |
| Device ID | the device ID of the kernel. |
| Kernel Timestamp (ns) | The timestamp for when the CUDA API call was made for this kernel in the CPU thread. Useful to see the order in which the kernels were called. |
| GPU Time (ns) | The time spent executing the kernel on the GPU. |
| Users TC | A true/false field indicating whether or not the kernel uses Tensor Cores. To filter, type ‘1’ for true, and ‘0’ for false. |
| Grid | The grid size of the kernel. |
| Block | The block size of the kernel. |
3.4.6. Kernels by Op
The Kernels by Op view is a variation of the Kernels by Iterations view. It has the capability to filter the list of kernels by iterations and op.
See this description for all the features available in all DataTables.
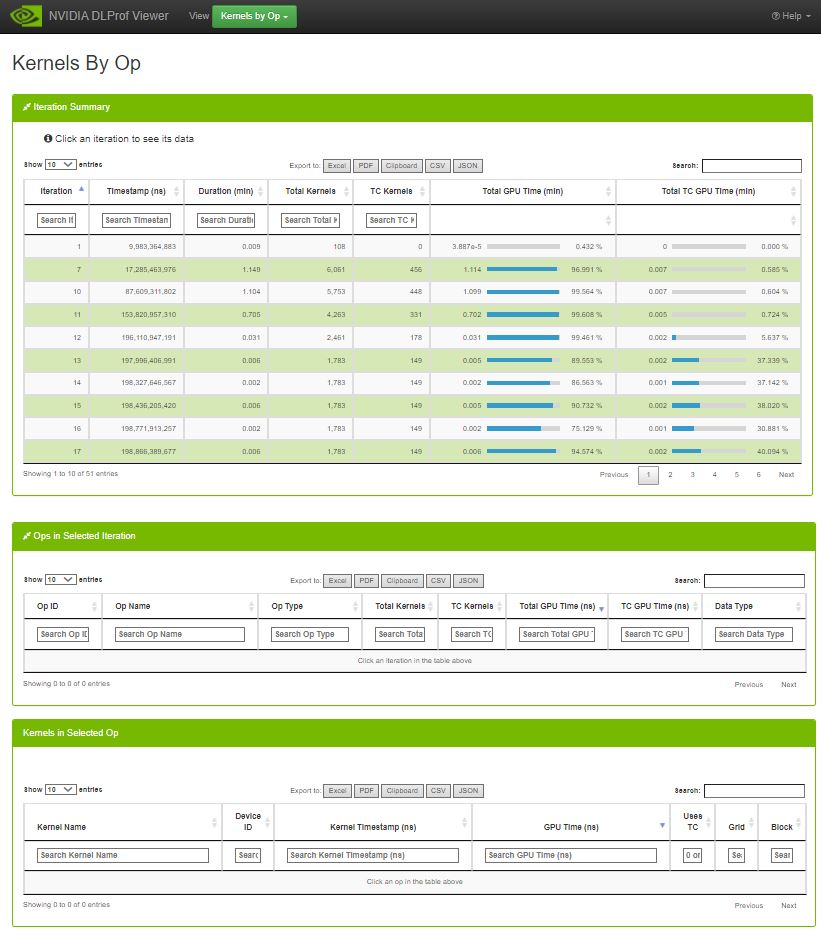
3.4.6.1. Iteration Summary Data Table
Selecting an iteration in the Iteration Summary table will populate the Ops in Selected Iteration table with all the profile data for the ops from the selected iteration. Selecting an op in the Ops in Selected Iteration table will populate the Kernels in Selected Op table with the list of kernels and timing data executed for the selected Op and Iteration.
See this description for all the features available in all DataTables.
| Column | Description |
|---|---|
| Iteration | The iteration interval numbers |
| Timestamp | The exact time when this iteration started. |
| Duration | The length of time it took for this iteration to execute. Units on this column are dynamic. |
| Total Kernels | The number of GPU kernels called during this iteration. |
| TC Kernels | The number of GPU Tensor Core kernels called during the iteration. |
| Total GPU Time (μs) | Total execution time for all kernels across all GPUs during the iteration. The contents of this cell are broken into multiple pieces: The value is the average execution time of this iteration across all GPUs. The progress meter visually indicates how much of this iteration executed on the GPU. The percentage is the average GPU time of all kernels across all GPUs over the total iteration time. Hovering over this cell displays a tooltip text with helpful information. Units on this column are dynamic. |
| Total TC GPU Time (μs) | Total execution time for all Tensor Core kernels across all GPUs during the iteration. The contents of this cell are broken into multiple pieces: The value is the average execution time of Tensor Core kernels during this iteration across all GPUs. The progress meter visually indicates how much of this iteration executed Tensor Core kernels. The percentage is the average GPU time of kernels using Tensor Core across all GPUs over the total iteration time. Hovering over this cell displays a tooltip text with helpful information. Units on this column are dynamic. |
3.4.6.2. Ops in Selected Iteration Table
Ops in Selected Iteration
See this description for all the features available in all DataTables.
| Column | Description |
|---|---|
| Op Name | The name of the op that launched the kernel. |
| Direction | The fprop/bprop direction of the op. (only visible on PyTorch runs). |
| Op Type | The type of the op. |
| Total Kernels | The number of GPU kernels called during this iteration. |
| TC Kernels | The number of GPU Tensor Core kernels called during the iteration. |
| Total GPU Time (ns) | Cumulative execution time for all kernels on the GPU during the op. |
| TC GPU Time (ns) | Cumulative execution time for all Tensor Core kernels on the GPU during the op. |
| Data Type | The data type of this op (eg, float16, int64, int32). |
| Stack Trace | The stack trace of the op. (only visible on PyTorch runs) If the contents of this cell is more than 100 characters, a ‘See More’ hyperlink appears. When clicked, the full contents of the cell appears. When the cell is expanded, the hyperlink text is changed to ‘See Less’. When clicked, the cell collapses back to the first 100 characters. |
3.4.6.3. Kernels Selected Iteration / Op Combination Table
Kernels in Selected Iteration / Op combination
See this description for all the features available in all DataTables.
| Column | Description |
|---|---|
| Kernel Name | The name of the kernel. |
| Device ID | The device ID of the kernel. |
| Kernel Timestamp (ns) | The timestamp for when the CUDA API call was made for this kernel in the CPU thread. Useful to see the order in which the kernels were called. |
| GPU Time (ns) | The time spent executing the kernel on the GPU. |
| Uses TC | A true/false field indicating whether or not the kernel uses Tensor Cores. To filter, type ‘1’ for true, and ‘0’ for false. |
| Grid | The grid size of the kernel. |
| Block | The block size of the kernel. |
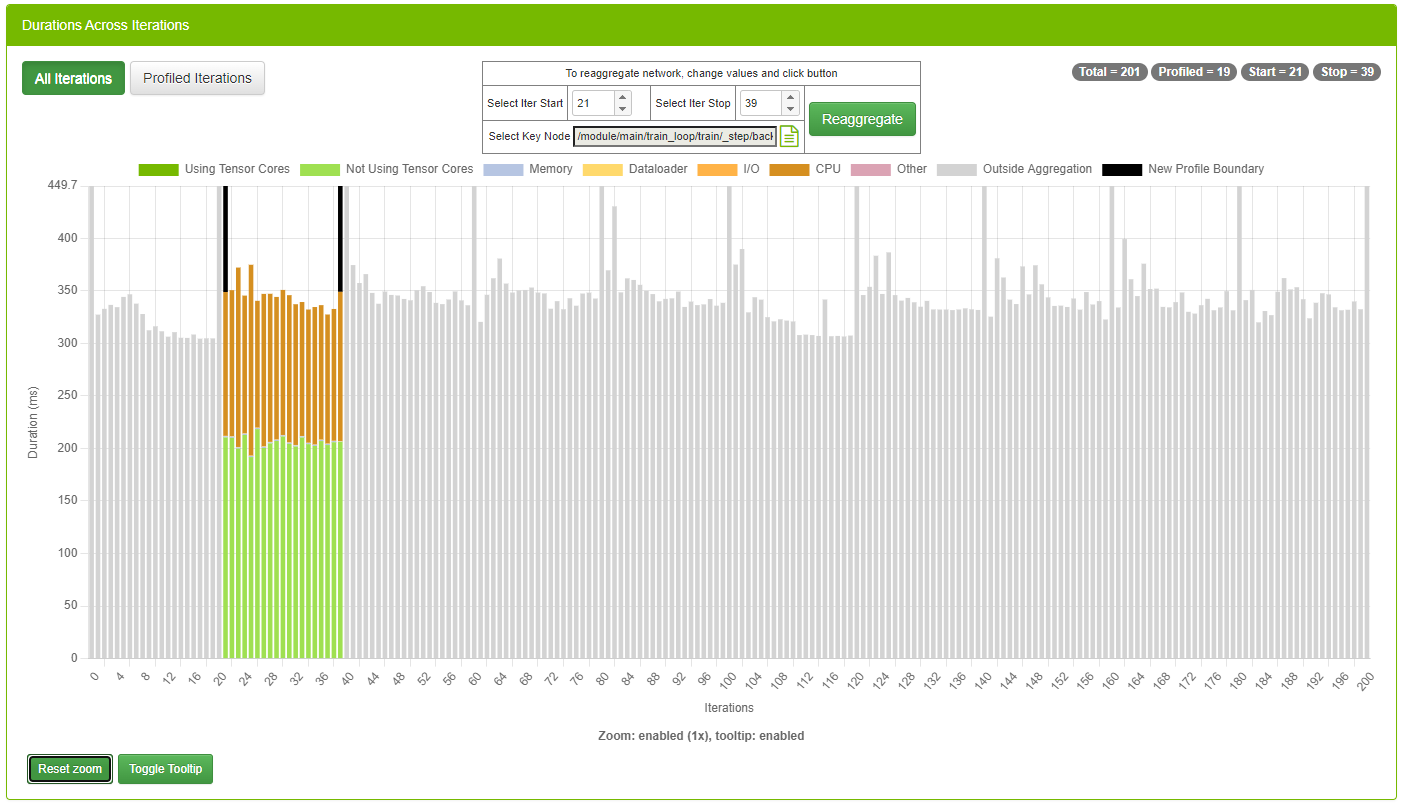
3.4.7. Iterations view
This view displays iterations visually. Users can quickly see how many iterations are in the model, the iterations that were aggregated/profiled, and the accumulated durations of tensor core kernels in each iteration.
Fields
| Field | Definition |
|---|---|
| X-Axis | The iterations of the model. |
| Y-Axis | Duration of iterations. The unit of this axis is dynamic (e.g., ms, ns, s, etc). |
| Zoom and Tooltip Label | Near the bottom/center, this label displays the current zoom factor, and the toggle state of the tooltip window. |
| Badges | In the top right, four badges display iteration specifics of the profiled network. Total Profiled Start Stop The values inside the start and stop badges come directly from DLProf: see the --iter_start and --iter_stop command line options. |
| Legend | Dark Green: Accumulated duration of all kernels using tensor cores Light Green: Accumulated duration of all kernels not using tensor cores Blue: Accumulated duration of all memory operations Dark Orange: Accumulated duration of all CPU operations Orange: Accumulated duration of all I/O operations. Light Orange: Accumulated duration of all dataloder operations. Pink: All time not in any other category. Gray: Duration of iteration outside the profile. Black: User-positioned aggregation boundary. See ‘Select Iter Start’ and ‘Select Iter Stop’ below. |
UI Controls
| Control | Definition |
|---|---|
| Toggle Buttons | All Iterations: Show all the iterations in the entire network Profiled Iterations: Zooms in to only show the iterations that were profiled |
| Chart Controls | Reset Zoom: Resets zoom back to 1.0x Toggle Tooltip: Shows/hides the tooltip window when hovering over bars on the bar chart. |
| Hover | When mouse hovers over an iteration, a popup window appears displaying the values of all the constituents of the iteration. |
| Chart Mouse Wheel | Mouse wheel up: Zoom in Mouse wheel down: Zoom out |
| Chart pan | Click and drag the chart to move it up or down. |
| Select Iter Start | Specification of a new “iteration start” value. Used for re-aggregating the data inside the viewer. The value can be changed by typing into the field, by clicking the up/down arrow spinners, or by hovering the cursor over the field and spinning the mouse wheel. When this value changes, the left black bar will move accordingly. |
| Select Iter Stop | Specification of a new “iteration stop” value. Used for re-aggregating the data inside the viewer. The value can be changed by typing into the field, by clicking the up/down arrow spinners, or by hovering the cursor over the field and spinning the mouse wheel. When this value changes, the right black bar will move accordingly. |
| Select Key Node | The existing key node value is displayed in a read-only field. Sometimes key nodes can be very long. If a long key node is selected, the first few characters of the key node will appear in the field. The entire length of the key node field will appear when the cursor hovers over the field. Click the Key Node Picker button to view and pick a new key node. See the dialog below. |
| Reaggregate | Instructs the DLProf back-end server to reaggregate the network with the specified parameters. |
Workflow
Sometimes the original aggregation parameters on the DLProf command-line specified an iteration start value, an iteration stop value, or even key node that yielded a suboptimal representation of the network’s profile (such as including warm-up nodes). This feature allows the user to change those values and re-aggregate. Here is an example:
- Notice in the Iterations View screenshot above:
- Iteration eight contains no work, and
- Iteration nine through fifteen (among others) contain way too much work. The aggregation values throughout the viewer contain those ops and kernels and potentially skews the results.
- You can change the iteration start and iteration stop values in a number of ways: typing and clicking the up and down spinners. The best way is to hover over the field and spin the mouse wheel.
- Some platforms do not have a default key node for a neural network. Sometimes the predefined key node is suboptimal. By clicking on the ‘Select Key Node’ picker, a key node can be selected. This is a full-featured panel that allows for filtering, sorting, and pagination to find a Key Node. See the view called Ops and Kernels for more details.
Note:
Note: There are fewer columns here than in the view, but the usability is the same.
 4. Once any of these three fields change, click the Reaggregate button. A confirmation dialog is displayed:
 5. After confirmation, a message is sent to the back-end DLProf server to reaggregate the profile with these values. This reaggregation process could potentially take minutes, so the following panel appears above all panels:
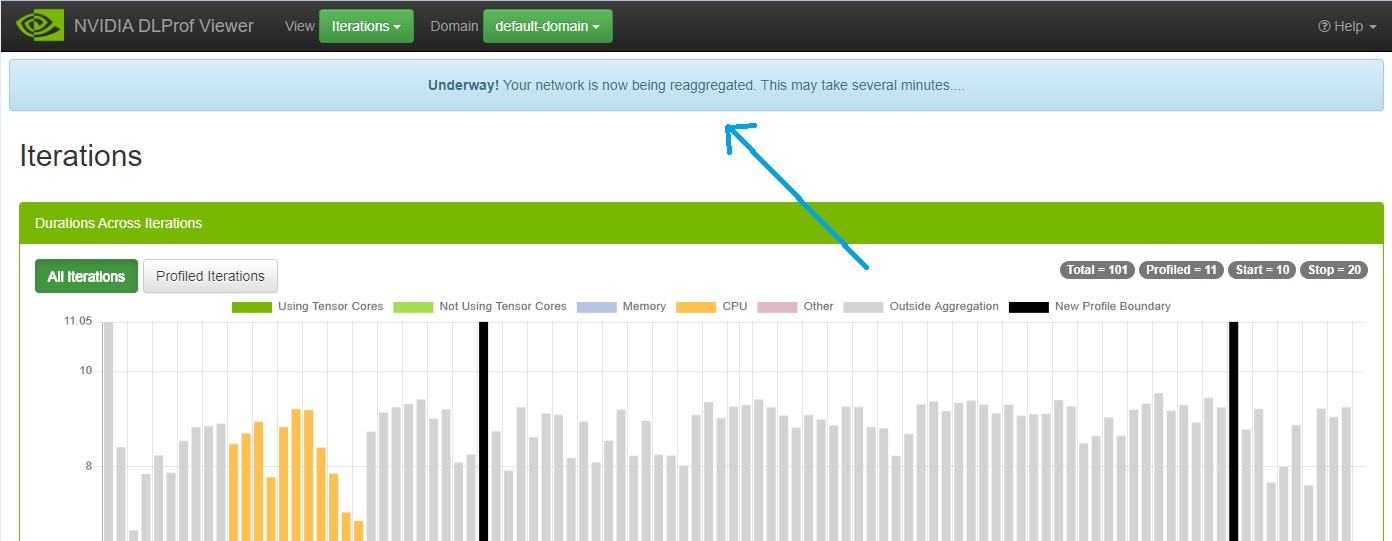
The viewer is fully functional while the re-aggregation is taking place. The “Underway!” panel will remain in view above all other views and panels until reaggregation is complete.
Note:
Note: Do not click the browser’s BACK or REFRESH button. If either are accidentally, the “Underway!” panel will no longer appear. The re-aggregation will continue regardless.
6. When the reaggregation is complete, a “Success!” panel will appear like this: 7. At this point, clicking the REFRESH button will load all the newly reaggregated data into the viewer. If it’s not already there, the dropdown called Aggregation is displayed in the Navigation Bar:
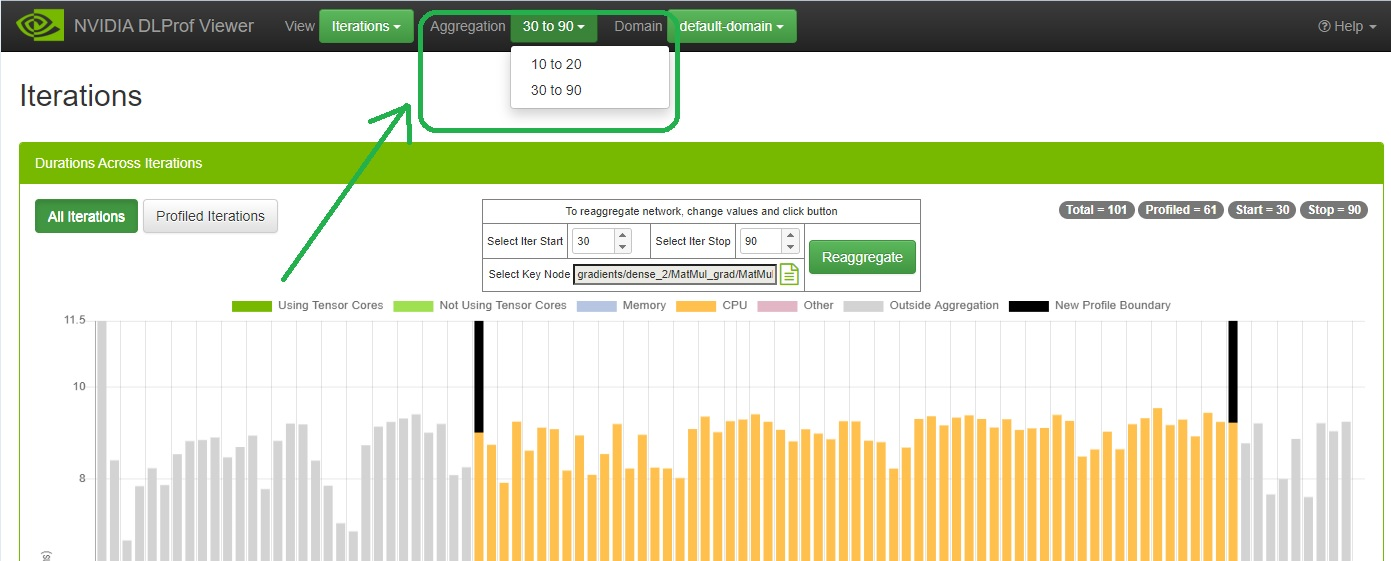
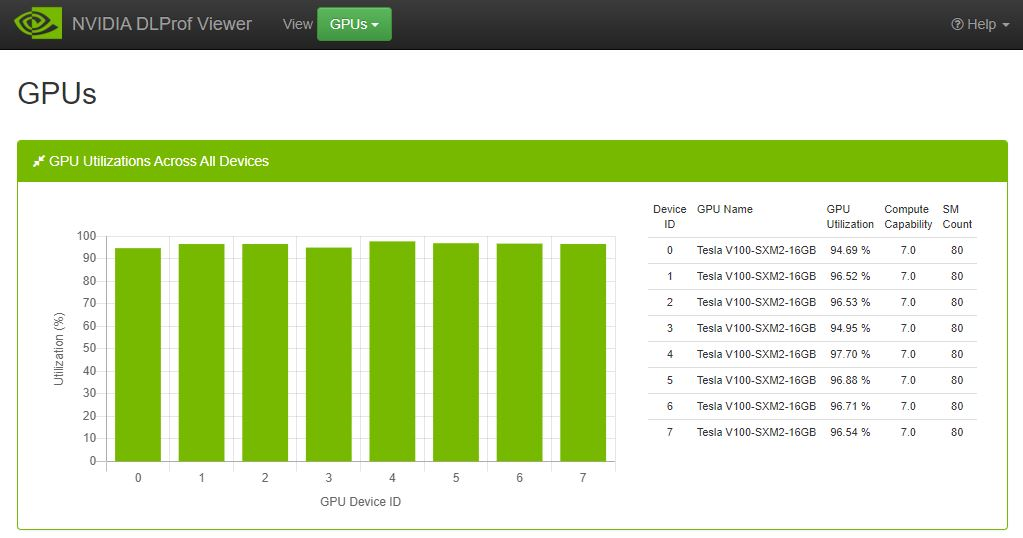
3.4.8. GPUs View
This view shows the utilization of all GPUs during the profile run. It is broken down into two different but related elements:
- Bar Chart - Quick visualization where you can see the GPU utilization for every GPU used during the profile. This view appears only when more than one GPU is used in a profile.
- Table - This table shows a little more detail about each GPU device, including its name, Compute Capability, and SM count.
3.4.9. Details Pane
This pane shows more details about a particular area of the system.
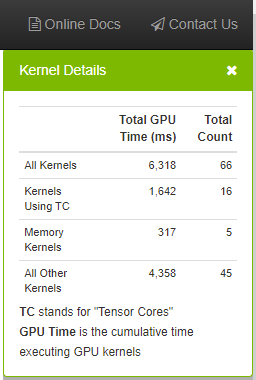
3.4.9.1. Kernel Details Panel
This panel provides key metrics about the kernels in the network aggregated over the specific iteration range.
Fields
| Field | Definition |
|---|---|
| All Kernels | Aggregates the total GPU time and count for all kernels in the network. |
| Kernels Using TC | Aggregates the total GPU time and count for all kernels using Tensor Cores. |
| Memory Kernels | Aggregates the total GPU time and count for all memory kernels. |
| All Other Kernels | Aggregates the total GPU time and count for all remaining kernel types. |
UI Controls
| Control | Definition |
|---|---|
| X | Closes the Details Pane. |
3.5. Using Data Tables
DataTables are used in many views in the DLProf Viewer. The features in DataTables enable users to quickly find information. Below is a screenshot to see the location of the features, followed by a table describing the functionality of each feature.
| Data Table Feature | Definition |
|---|---|
| Showing label | The label under the table (bottom left) will show a real-time count of rows in the table. |
| Search text box | Filter results by text search. Typing in this field will display only those rows that contain the text in the box. Adding or removing text in the Search box will update the “Showing…” label. |
| Column search | Typing into the text box under most column headers will display only those rows with the entered text. This is powerful since users can enter search criteria for multiple columns to zero-in on interesting rows. Columns with ‘x’ and ‘check mark’ are boolean fields. Users can enter "1" to show those rows with a ‘check mark’, and ‘0’ to show only those rows with ‘x’. |
| Sort toggle button | Clicking on a column header will sort the table. When clicked, all rows are sorted either ascending or descending. The initial sort on most numeral columns are descending. |
| Show Entries dropdown | This dropdown allows the user to display 10, 25, 50, or 100 rows. Changing the setting will update the “Showing…” label. |
| Pagination buttons | Previous, next, and page# navigation. Allows users to quickly page through large data sets. Uses ‘Show Entries’ setting and updates the “Showing…” label. |
| Export to buttons | Allows users to easily export the data in the datatable to well known formats. An optional profile name is displayed in the header of all exports when the--profile_name command-line argument is used in DLProf. Warning: A slight delay occurs when any of these buttons are clicked on large networks. Enable pop-ups in your browser to export to PDF. |