numpy.linspace — NumPy v1.13 Manual (original) (raw)
numpy. linspace(start, stop, num=50, endpoint=True, retstep=False, dtype=None)[source]
Return evenly spaced numbers over a specified interval.
Returns num evenly spaced samples, calculated over the interval [start, _stop_].
The endpoint of the interval can optionally be excluded.
| Parameters: | start : scalar The starting value of the sequence. stop : scalar The end value of the sequence, unless endpoint is set to False. In that case, the sequence consists of all but the last of num + 1evenly spaced samples, so that stop is excluded. Note that the step size changes when endpoint is False. num : int, optional Number of samples to generate. Default is 50. Must be non-negative. endpoint : bool, optional If True, stop is the last sample. Otherwise, it is not included. Default is True. retstep : bool, optional If True, return (samples, step), where step is the spacing between samples. dtype : dtype, optional The type of the output array. If dtype is not given, infer the data type from the other input arguments. New in version 1.9.0. |
|---|---|
| Returns: | samples : ndarray There are num equally spaced samples in the closed interval[start, stop] or the half-open interval [start, stop)(depending on whether endpoint is True or False). step : float, optional Only returned if retstep is True Size of spacing between samples. |
See also
Similar to linspace, but uses a step size (instead of the number of samples).
Samples uniformly distributed in log space.
Examples
np.linspace(2.0, 3.0, num=5) array([ 2. , 2.25, 2.5 , 2.75, 3. ]) np.linspace(2.0, 3.0, num=5, endpoint=False) array([ 2. , 2.2, 2.4, 2.6, 2.8]) np.linspace(2.0, 3.0, num=5, retstep=True) (array([ 2. , 2.25, 2.5 , 2.75, 3. ]), 0.25)
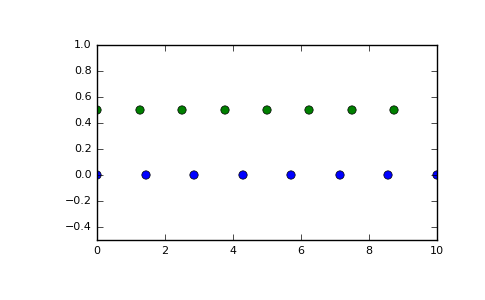
Graphical illustration:
import matplotlib.pyplot as plt N = 8 y = np.zeros(N) x1 = np.linspace(0, 10, N, endpoint=True) x2 = np.linspace(0, 10, N, endpoint=False) plt.plot(x1, y, 'o') [<matplotlib.lines.Line2D object at 0x...>] plt.plot(x2, y + 0.5, 'o') [<matplotlib.lines.Line2D object at 0x...>] plt.ylim([-0.5, 1]) (-0.5, 1) plt.show()
(Source code, png, pdf)