numpy.logspace — NumPy v1.13 Manual (original) (raw)
numpy. logspace(start, stop, num=50, endpoint=True, base=10.0, dtype=None)[source]
Return numbers spaced evenly on a log scale.
In linear space, the sequence starts at base ** start(base to the power of start) and ends with base ** stop(see endpoint below).
| Parameters: | start : float base ** start is the starting value of the sequence. stop : float base ** stop is the final value of the sequence, unless _endpoint_is False. In that case, num + 1 values are spaced over the interval in log-space, of which all but the last (a sequence of length num) are returned. num : integer, optional Number of samples to generate. Default is 50. endpoint : boolean, optional If true, stop is the last sample. Otherwise, it is not included. Default is True. base : float, optional The base of the log space. The step size between the elements inln(samples) / ln(base) (or log_base(samples)) is uniform. Default is 10.0. dtype : dtype The type of the output array. If dtype is not given, infer the data type from the other input arguments. |
|---|---|
| Returns: | samples : ndarray num samples, equally spaced on a log scale. |
See also
Similar to linspace, with the step size specified instead of the number of samples. Note that, when used with a float endpoint, the endpoint may or may not be included.
Similar to logspace, but with the samples uniformly distributed in linear space, instead of log space.
Similar to logspace, but with endpoints specified directly.
Notes
Logspace is equivalent to the code
y = np.linspace(start, stop, num=num, endpoint=endpoint) ... power(base, y).astype(dtype) ...
Examples
np.logspace(2.0, 3.0, num=4) array([ 100. , 215.443469 , 464.15888336, 1000. ]) np.logspace(2.0, 3.0, num=4, endpoint=False) array([ 100. , 177.827941 , 316.22776602, 562.34132519]) np.logspace(2.0, 3.0, num=4, base=2.0) array([ 4. , 5.0396842 , 6.34960421, 8. ])
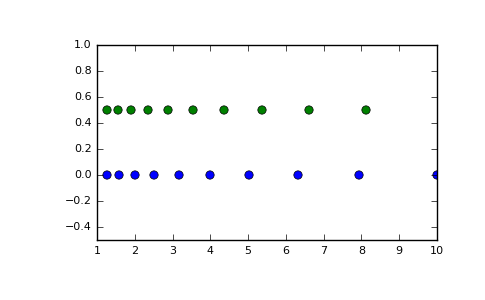
Graphical illustration:
import matplotlib.pyplot as plt N = 10 x1 = np.logspace(0.1, 1, N, endpoint=True) x2 = np.logspace(0.1, 1, N, endpoint=False) y = np.zeros(N) plt.plot(x1, y, 'o') [<matplotlib.lines.Line2D object at 0x...>] plt.plot(x2, y + 0.5, 'o') [<matplotlib.lines.Line2D object at 0x...>] plt.ylim([-0.5, 1]) (-0.5, 1) plt.show()
(Source code, png, pdf)