scipy.special.ncfdtr — SciPy v1.16.0 Manual (original) (raw)
scipy.special.ncfdtr(dfn, dfd, nc, f, out=None) = <ufunc 'ncfdtr'>#
Cumulative distribution function of the non-central F distribution.
The non-central F describes the distribution of,
\[Z = \frac{X/d_n}{Y/d_d}\]
where \(X\) and \(Y\) are independently distributed, with\(X\) distributed non-central \(\chi^2\) with noncentrality parameter nc and \(d_n\) degrees of freedom, and \(Y\)distributed \(\chi^2\) with \(d_d\) degrees of freedom.
Parameters:
dfnarray_like
Degrees of freedom of the numerator sum of squares. Range (0, inf).
dfdarray_like
Degrees of freedom of the denominator sum of squares. Range (0, inf).
ncarray_like
Noncentrality parameter. Range [0, inf).
farray_like
Quantiles, i.e. the upper limit of integration.
outndarray, optional
Optional output array for the function results
Returns:
cdfscalar or ndarray
The calculated CDF. If all inputs are scalar, the return will be a float. Otherwise it will be an array.
Notes
This function calculates the CDF of the non-central f distribution using the Boost Math C++ library [1].
The cumulative distribution function is computed using Formula 26.6.20 of[2]:
\[F(d_n, d_d, n_c, f) = \sum_{j=0}^\infty e^{-n_c/2} \frac{(n_c/2)^j}{j!} I_{x}(\frac{d_n}{2} + j, \frac{d_d}{2}),\]
where \(I\) is the regularized incomplete beta function, and\(x = f d_n/(f d_n + d_d)\).
Note that argument order of ncfdtr is different from that of the similar cdf method of scipy.stats.ncf: f is the last parameter of ncfdtr but the first parameter of scipy.stats.ncf.cdf.
References
[2]
Milton Abramowitz and Irene A. Stegun, eds. Handbook of Mathematical Functions with Formulas, Graphs, and Mathematical Tables. New York: Dover, 1972.
Examples
import numpy as np from scipy import special from scipy import stats import matplotlib.pyplot as plt
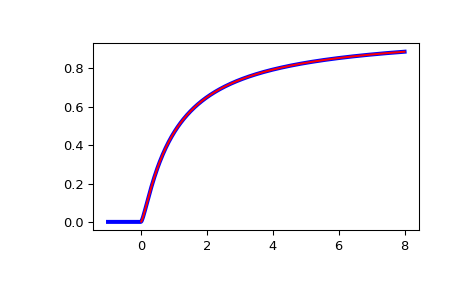
Plot the CDF of the non-central F distribution, for nc=0. Compare with the F-distribution from scipy.stats:
x = np.linspace(-1, 8, num=500) dfn = 3 dfd = 2 ncf_stats = stats.f.cdf(x, dfn, dfd) ncf_special = special.ncfdtr(dfn, dfd, 0, x)
fig = plt.figure() ax = fig.add_subplot(111) ax.plot(x, ncf_stats, 'b-', lw=3) ax.plot(x, ncf_special, 'r-') plt.show()