melSpectrogram - Mel spectrogram - MATLAB (original) (raw)
Syntax
Description
[S](#mw%5F917dd01c-5621-4427-96e1-e635ae331460) = melSpectrogram([audioIn](#mw%5F0dc6a5ee-2946-4bf9-a083-c1a82c065dd9),[fs](#mw%5F8f6e7550-167a-43fb-b7c9-2cc735f60004)) returns the mel spectrogram of the audio input at sample rate fs. The function treats columns of the input as individual channels.
[S](#mw%5F917dd01c-5621-4427-96e1-e635ae331460) = melSpectrogram([audioIn](#mw%5F0dc6a5ee-2946-4bf9-a083-c1a82c065dd9),[fs](#mw%5F8f6e7550-167a-43fb-b7c9-2cc735f60004),[Name=Value](#namevaluepairarguments)) specifies options using one or more name-value arguments.
[[S](#mw%5F917dd01c-5621-4427-96e1-e635ae331460),[F](#mw%5F1a935748-1e88-4255-a851-48e139aa1893),[T](#mw%5F6ea99f88-797f-4f72-8ea6-40a92f952f23)] = melSpectrogram(___) returns the center frequencies of the bands in Hz and the location of each window of data in seconds. The location corresponds to the center of each window. You can use this output syntax with any of the previous input syntaxes.
melSpectrogram(___) plots the mel spectrogram on a surface in the current figure.
Examples
Use the default settings to calculate the mel spectrogram for an entire audio file. Print the number of bandpass filters in the filter bank and the number of frames in the mel spectrogram.
[audioIn,fs] = audioread('Counting-16-44p1-mono-15secs.wav');
S = melSpectrogram(audioIn,fs);
[numBands,numFrames] = size(S); fprintf("Number of bandpass filters in filterbank: %d\n",numBands)
Number of bandpass filters in filterbank: 32
fprintf("Number of frames in spectrogram: %d\n",numFrames)
Number of frames in spectrogram: 1551
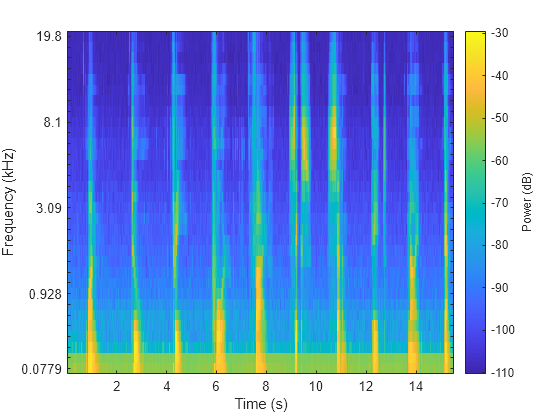
Plot the mel spectrogram.
melSpectrogram(audioIn,fs)
Calculate the mel spectrums of 2048-point periodic Hann windows with 1024-point overlap. Convert to the frequency domain using a 4096-point FFT. Pass the frequency-domain representation through 64 half-overlapped triangular bandpass filters that span the range 62.5 Hz to 8 kHz.
[audioIn,fs] = audioread('FunkyDrums-44p1-stereo-25secs.mp3');
S = melSpectrogram(audioIn,fs, ... 'Window',hann(2048,'periodic'), ... 'OverlapLength',1024, ... 'FFTLength',4096, ... 'NumBands',64, ... 'FrequencyRange',[62.5,8e3]);
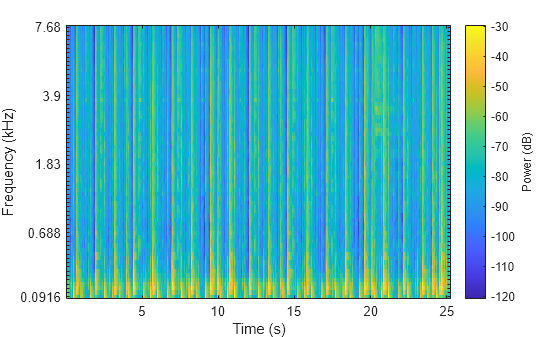
Call melSpectrogram again, this time with no output arguments so that you can visualize the mel spectrogram. The input audio is a multichannel signal. If you call melSpectrogram with a multichannel input and with no output arguments, only the first channel is plotted.
melSpectrogram(audioIn,fs, ... 'Window',hann(2048,'periodic'), ... 'OverlapLength',1024, ... 'FFTLength',4096, ... 'NumBands',64, ... 'FrequencyRange',[62.5,8e3])
melSpectrogram applies a frequency-domain filter bank to audio signals that are windowed in time. You can get the center frequencies of the filters and the time instants corresponding to the analysis windows as the second and third output arguments from melSpectrogram.
Get the mel spectrogram, filter bank center frequencies, and analysis window time instants of a multichannel audio signal. Use the center frequencies and time instants to plot the mel spectrogram for each channel.
[audioIn,fs] = audioread('AudioArray-16-16-4channels-20secs.wav');
[S,cF,t] = melSpectrogram(audioIn,fs);
S = 10*log10(S+eps); % Convert to dB for plotting
for i = 1:size(S,3) figure(i) surf(t,cF,S(:,:,i),'EdgeColor','none'); xlabel('Time (s)') ylabel('Frequency (Hz)') view([0,90]) title(sprintf('Channel %d',i)) axis([t(1) t(end) cF(1) cF(end)]) end


Input Arguments
Audio input, specified as a column vector or matrix. If specified as a matrix, the function treats columns as independent audio channels.
Data Types: single | double
Input sample rate in Hz, specified as a positive scalar.
Data Types: single | double
Name-Value Arguments
Specify optional pairs of arguments asName1=Value1,...,NameN=ValueN, where Name is the argument name and Value is the corresponding value. Name-value arguments must appear after other arguments, but the order of the pairs does not matter.
Before R2021a, use commas to separate each name and value, and enclose Name in quotes.
Example: FFTLength=1024
Window applied in time domain, specified as a real vector. The number of elements in the vector must be in the range [1,size([audioIn](#mw%5F0dc6a5ee-2946-4bf9-a083-c1a82c065dd9),1)]. The number of elements in the vector must also be greater than OverlapLength.
Data Types: single | double
Analysis window overlap length in samples, specified as an integer in the range[0, (numel([Window](#mw%5F6d275a77-872b-4a12-9da2-77e2501934e8)) - 1)].
Data Types: single | double
Number of points used to calculate the DFT, specified as a positive integer greater than or equal to the length of Window. If unspecified,FFTLength defaults to the length ofWindow.
Data Types: single | double
Number of mel bandpass filters, specified as a positive integer.
Data Types: single | double
Frequency range over which to compute the mel spectrogram in Hz, specified as a two-element row vector of monotonically increasing values in the range [0,[fs](#mw%5F8f6e7550-167a-43fb-b7c9-2cc735f60004)/2].
Data Types: single | double
Type of mel spectrogram, specified as "power" or"magnitude".
Data Types: char | string
Apply window normalization, specified as true orfalse. When WindowNormalization is set totrue, the power (or magnitude) in the mel spectrogram is normalized to remove the power (or magnitude) of the time domainWindow.
Data Types: char | string
Type of filter bank normalization, specified as "bandwidth","area", or "none".
Data Types: char | string
Mel style, specified as "oshaughnessy" or"slaney".
Data Types: char | string
Apply base 10 logarithm to the returned mel spectrogram, specified astrue or false.
Data Types: logical
Output Arguments
Mel spectrogram, returned as a column vector, matrix, or 3-D array. The dimensions of S are_L_-by-_M_-by-N, where:
- L is the number of frequency bins in each mel spectrum.NumBands and fs determine_L_.
- M is the number of frames the audio signal is partitioned into.
size([audioIn](#mw%5F0dc6a5ee-2946-4bf9-a083-c1a82c065dd9),1), the length ofWindow, and OverlapLength determine_M_. - N is the number of channels such that N =
size(`audioIn`,2).
Trailing singleton dimensions are removed from the outputS.
Data Types: single | double
Center frequencies of mel bandpass filters in Hz, returned as a row vector with length size([S](#mw%5F917dd01c-5621-4427-96e1-e635ae331460),1).
Data Types: single | double
Location of each analysis window of audio in seconds, returned as a row vector length size([S](#mw%5F917dd01c-5621-4427-96e1-e635ae331460),2). The location corresponds to the center of each window.
Data Types: single | double
Algorithms
The melSpectrogram function follows the general algorithm to compute a mel spectrogram as described in [1].

In this algorithm, the audio input is first buffered into frames ofnumel([Window](#mw%5F6d275a77-872b-4a12-9da2-77e2501934e8)) number of samples. The frames are overlapped by OverlapLength number of samples. The specifiedWindow is applied to each frame, and then the frame is converted to frequency-domain representation with FFTLength number of points. The frequency-domain representation can be either magnitude or power, specified bySpectrumType. If WindowNormalization is set totrue, the spectrum is normalized by the window. Each frame of the frequency-domain representation passes through a mel filter bank. The spectral values output from the mel filter bank are summed, and then the channels are concatenated so that each frame is transformed to a NumBands-element column vector.
The mel filter bank is designed as half-overlapped triangular filters equally spaced on the mel scale. NumBands controls the number of mel bandpass filters.FrequencyRange controls the band edges of the first and last filters in the mel filter bank. FilterBankNormalization specifies the type of normalization applied to the individual bands.

The mel scale can be in the O'Shaughnessy style, which follows [2], or the Slaney style, which follows [3].
References
[1] Rabiner, Lawrence R., and Ronald W. Schafer. Theory and Applications of Digital Speech Processing. Upper Saddle River, NJ: Pearson, 2010.
[2] O'Shaughnessy, Douglas.Speech Communication: Human and Machine. Reading, MA: Addison-Wesley Publishing Company, 1987.
[3] Slaney, Malcolm. "Auditory Toolbox: A MATLAB Toolbox for Auditory Modeling Work." Technical Report, Version 2, Interval Research Corporation, 1998.
Extended Capabilities
Version History
Introduced in R2019a
The WindowLength parameter has been removed from themelSpectrogram function. Use the Window parameter instead.
In releases prior to R2020b, you could only specify the length of a time-domain window. The window was always designed as a periodic Hamming window. You can replace instances of the code
S = melSpectrogram(audioin,fs,WindowLength=1024);
With this code:
S = melSpectrogram(audioIn,fs,Window=hamming(1024,"periodic"));
Set the ApplyLog name-value argument to true to apply a base 10 logarithm to the spectrogram.
Set the MelStyle name-value argument to "slaney" to use the Slaney-style mel scale.
melSpectrogram supports optimized C/C++ code generation using single instruction, multiple data (SIMD) instructions.
The WindowLength parameter will be removed from themelSpectrogram function in a future release.