confusionchart - Create confusion matrix chart for classification problem - MATLAB (original) (raw)
Create confusion matrix chart for classification problem
Syntax
Description
confusionchart([trueLabels](#mw%5F9bd7b59f-d199-41f7-b335-f865d77d9498),[predictedLabels](#mw%5F5137e07d-024a-40bc-a9c6-0924f7839f63)) creates a confusion matrix chart from true labels trueLabels and predicted labels predictedLabels and returns a ConfusionMatrixChart object. The rows of the confusion matrix correspond to the true class and the columns correspond to the predicted class. Diagonal and off-diagonal cells correspond to correctly and incorrectly classified observations, respectively. Use cm to modify the confusion matrix chart after it is created. For a list of properties, see ConfusionMatrixChart Properties.
confusionchart([m](#mw%5F9e5e1149-cc8f-4e1f-84ff-12f3b304613b)) creates a confusion matrix chart from the numeric confusion matrix m. Use this syntax if you already have a numeric confusion matrix in the workspace.
confusionchart([m](#mw%5F9e5e1149-cc8f-4e1f-84ff-12f3b304613b),[classLabels](#mw%5F46b4cb42-5041-4943-9ea0-aef16bb3a0f0)) specifies class labels that appear along the _x_-axis and _y_-axis. Use this syntax if you already have a numeric confusion matrix and class labels in the workspace.
confusionchart([parent](#mw%5F58c53d12-c3c1-4fe8-b606-f6a109982a64),___) creates the confusion chart in the figure, panel, or tab specified by parent.
confusionchart(___,[Name,Value](#namevaluepairarguments)) specifies additional ConfusionMatrixChart properties using one or more name-value pair arguments. Specify the properties after all other input arguments. For a list of properties, see ConfusionMatrixChart Properties.
[cm](#mw%5F2b3beb6f-870d-443d-9ae6-5790b776b580) = confusionchart(___) returns the ConfusionMatrixChart object. Use cm to modify properties of the chart after creating it. For a list of properties, see ConfusionMatrixChart Properties.
Examples
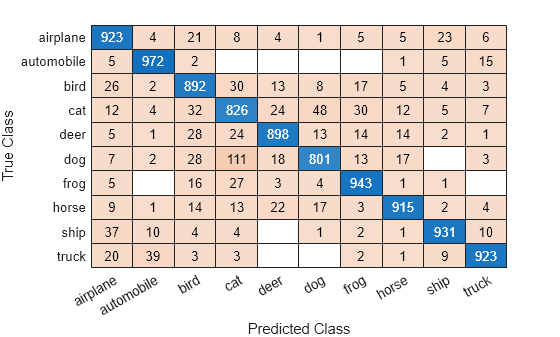
Load a sample of predicted and true labels for a classification problem. trueLabels is the true labels for an image classification problem and predictedLabels is the predictions of a convolutional neural network.
load('Cifar10Labels.mat','trueLabels','predictedLabels');
Create a confusion matrix chart.
figure cm = confusionchart(trueLabels,predictedLabels);

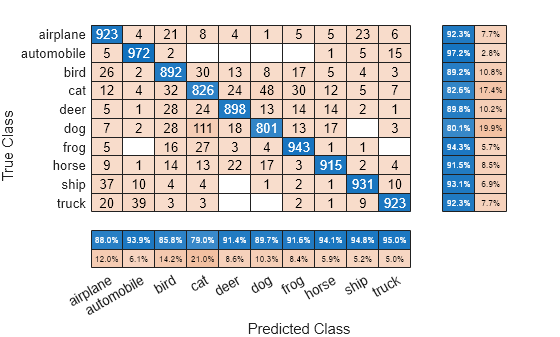
Modify the appearance and behavior of the confusion matrix chart by changing property values. Add column and row summaries and a title. A column-normalized column summary displays the number of correctly and incorrectly classified observations for each predicted class as percentages of the number of observations of the corresponding predicted class. A row-normalized row summary displays the number of correctly and incorrectly classified observations for each true class as percentages of the number of observations of the corresponding true class.
cm.ColumnSummary = 'column-normalized'; cm.RowSummary = 'row-normalized'; cm.Title = 'CIFAR-10 Confusion Matrix';

You can use confusionchart to create a confusion matrix chart from a numeric confusion matrix.
Load a sample confusion matrix m and the associated class labels classLabels.
load('Cifar10ConfusionMat.mat','m','classLabels'); m
m = 10×10
923 4 21 8 4 1 5 5 23 6 5 972 2 0 0 0 0 1 5 15 26 2 892 30 13 8 17 5 4 3 12 4 32 826 24 48 30 12 5 7 5 1 28 24 898 13 14 14 2 1 7 2 28 111 18 801 13 17 0 3 5 0 16 27 3 4 943 1 1 0 9 1 14 13 22 17 3 915 2 4 37 10 4 4 0 1 2 1 931 10 20 39 3 3 0 0 2 1 9 923
classLabels = 10×1 categorical airplane automobile bird cat deer dog frog horse ship truck
Create a confusion matrix chart from the numeric confusion matrix and the class labels.
cm = confusionchart(m,classLabels);
Load a sample of predicted and true labels for a classification problem. trueLabels are the true labels for an image classification problem and predictedLabels are the predictions of a convolutional neural network. Create a confusion matrix chart with column and row summaries.
load('Cifar10Labels.mat','trueLabels','predictedLabels'); figure cm = confusionchart(trueLabels,predictedLabels, ... 'ColumnSummary','column-normalized', ... 'RowSummary','row-normalized');
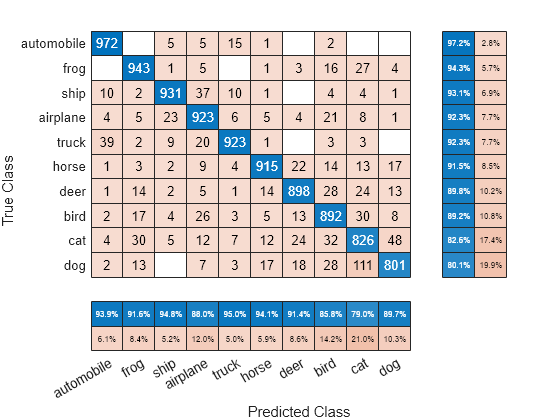
To sort the classes of the confusion matrix by class-wise recall (true positive rate), normalize the cell values across each row, that is, by the number of observations that have the same true class. Sort the classes by the corresponding diagonal cell values and reset the normalization of the cell values. The classes are now sorted such that the percentages in the blue cells in the row summaries to the right are decreasing.
cm.Normalization = 'row-normalized'; sortClasses(cm,'descending-diagonal'); cm.Normalization = 'absolute';
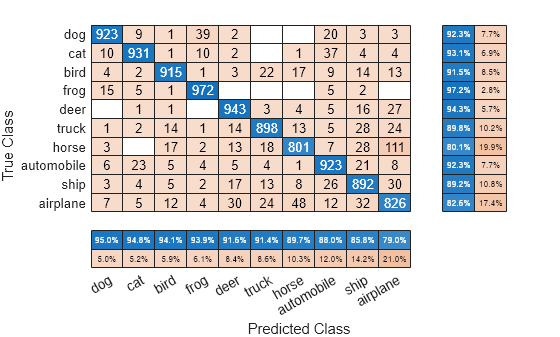
To sort the classes by class-wise precision (positive predictive value), normalize the cell values across each column, that is, by the number of observations that have the same predicted class. Sort the classes by the corresponding diagonal cell values and reset the normalization of the cell values. The classes are now sorted such that the percentages in the blue cells in the column summaries at the bottom are decreasing.
cm.Normalization = 'column-normalized'; sortClasses(cm,'descending-diagonal'); cm.Normalization = 'absolute';
Input Arguments
True labels of classification problem, specified as a categorical vector, numeric vector, string vector, character array, cell array of character vectors, or logical vector. If trueLabels is a vector, then each element corresponds to one observation. If trueLabels is a character array, then it must be two-dimensional with each row corresponding to the label of one observation.
Predicted labels of classification problem, specified as a categorical vector, numeric vector, string vector, character array, cell array of character vectors, or logical vector. If predictedLabels is a vector, then each element corresponds to one observation. If predictedLabels is a character array, then it must be two-dimensional with each row corresponding to the label of one observation.
Confusion matrix, specified as a matrix. m must be square and its elements must be positive integers. The element m(i,j) is the number of times an observation of the ith true class was predicted to be of the jth class. Each colored cell of the confusion matrix chart corresponds to one element of the confusion matrix m.
Class labels of the confusion matrix chart, specified as a categorical vector, numeric vector, string vector, character array, cell array of character vectors, or logical vector. If classLabels is a vector, then it must have the same number of elements as the confusion matrix has rows and columns. If classLabels is a character array, then it must be two-dimensional with each row corresponding to the label of one class.
Parent container, specified as a Figure, Panel,Tab, TiledChartLayout, or GridLayout object.
Name-Value Arguments
Specify optional pairs of arguments asName1=Value1,...,NameN=ValueN, where Name is the argument name and Value is the corresponding value. Name-value arguments must appear after other arguments, but the order of the pairs does not matter.
Before R2021a, use commas to separate each name and value, and enclose Name in quotes.
Example: cm = confusionchart(trueLabels,predictedLabels,'Title','My Title Text','ColumnSummary','column-normalized')
Title of the confusion matrix chart, specified as a character vector or string scalar.
Example: cm = confusionchart(__,'Title','My Title Text')
Example: cm.Title = 'My Title Text'
Column summary of the confusion matrix chart, specified as one of the following:
| Option | Description |
|---|---|
| 'off' | Do not display a column summary. |
| 'absolute' | Display the total number of correctly and incorrectly classified observations for each predicted class. |
| 'column-normalized' | Display the number of correctly and incorrectly classified observations for each predicted class as percentages of the number of observations of the corresponding predicted class. The percentages of correctly classified observations can be thought of as class-wise precisions (or positive predictive values). |
| 'total-normalized' | Display the number of correctly and incorrectly classified observations for each predicted class as percentages of the total number of observations. |
Example: cm = confusionchart(__,'ColumnSummary','column-normalized')
Example: cm.ColumnSummary = 'column-normalized'
Row summary of the confusion matrix chart, specified as one of the following:
| Option | Description |
|---|---|
| 'off' | Do not display a row summary. |
| 'absolute' | Display the total number of correctly and incorrectly classified observations for each true class. |
| 'row-normalized' | Display the number of correctly and incorrectly classified observations for each true class as percentages of the number of observations of the corresponding true class. The percentages of correctly classified observations can be thought of as class-wise recalls (or true positive rates). |
| 'total-normalized' | Display the number of correctly and incorrectly classified observations for each true class as percentages of the total number of observations. |
Example: cm = confusionchart(__,'RowSummary','row-normalized')
Example: cm.RowSummary = 'row-normalized'
Normalization of cell values, specified as one of the following:
| Option | Description |
|---|---|
| 'absolute' | Display the total number of observations in each cell. |
| 'column-normalized' | Normalize each cell value by the number of observations that has the same predicted class. |
| 'row-normalized' | Normalize each cell value by the number of observations that has the same true class. |
| 'total-normalized' | Normalize each cell value by the total number of observations. |
Modifying the normalization of cell values also affects the colors of the cells.
Example: cm = confusionchart(__,'Normalization','total-normalized')
Example: cm.Normalization = 'total-normalized'
Limitations
- MATLAB® code generation is not supported for
ConfusionMatrixChartobjects.
More About
A standalone visualization is a chart designed for a special purpose that works independently from other charts. Unlike other charts such as plot and surf, a standalone visualization has a preconfigured axes object built into it, and some customizations are not available. A standalone visualization also has these characteristics:
- It cannot be combined with other graphics elements, such as lines, patches, or surfaces. Thus, the
holdcommand is not supported. - The
gcafunction can return the chart object as the current axes. - You can pass the chart object to many MATLAB functions that accept an axes object as an input argument. For example, you can pass the chart object to the
titlefunction.
Tips
- If you have one-hot (one-of-N) data, use onehotdecode to prepare your data for use with
confusionchart. For example, suppose you have true labelstargetsand predicted labelsoutputs, with observations in columns. You can create a confusion matrix chart using
numClasses = size(targets,1);
trueLabels = onehotdecode(targets,1:numClasses,1);
predictedLabels = onehotdecode(outputs,1:numClasses,1);
confusionchart(trueLabels,predictedLabels) - If you have Statistics and Machine Learning Toolbox™, you can create a confusion matrix chart for tall arrays. For details, seeconfusionchart (Statistics and Machine Learning Toolbox) andConfusion Matrix for Classification Using Tall Arrays (Statistics and Machine Learning Toolbox).
Version History
Introduced in R2018b
You can now customize the titles and labels of ConfusionMatrixChart objects:
- Specify labels for the row (_y_-axis) and column (_x_-axis) values using theRowDisplayLabels and ColumnDisplayLabels properties.
- Interpret text labels, such as titles and axis labels, with TeX markup, LaTeX markup, or no markup using the Interpreter property.
Before R2025a: All confusion charts have the interpreter set to'tex'for title and axis labels and 'none' for tick labels. - Display labels for the true positive rate (TPR), false negative rate (FNR), positive predictive value (PPV), and false discovery rate (FDR) on the row and column summaries using the SummaryLabelsVisible property.