drise - Explain object detection network predictions using D-RISE - MATLAB (original) (raw)
Explain object detection network predictions using D-RISE
Since R2024a
Syntax
Description
[scoreMap](#mw%5F6930a7ca-338b-4651-a144-9289e32f2c98) = drise([detector](#mw%5F7c7e0be2-35d7-4224-87bb-ecfd5d0d9fe8),[I](#mw%5Ffa897d0a-4afe-464a-b723-f425ffbc8bb4)) returns a saliency map for the specified image I and object detection network detector. The function calculates the saliency map by using the detector randomized input sampling for explanation (D-RISE) algorithm. This function requires Deep Learning Toolbox™ Verification Library and Computer Vision Toolbox™.
[scoreMap](#mw%5F6930a7ca-338b-4651-a144-9289e32f2c98) = drise([customDetection](#mw%5F7c6975c4-3eca-4396-8171-6c8a7ace536e),[I](#mw%5Ffa897d0a-4afe-464a-b723-f425ffbc8bb4)) specifies a custom detection function.
[scoreMap](#mw%5F6930a7ca-338b-4651-a144-9289e32f2c98) = drise(___,[bboxIn](#mw%5Fdc5cb455-ab8c-4f25-98cf-640fec5bd1fc),[labelIn](#mw%5F922b3dce-482c-48bb-855a-d0cbc8028e27)) also specifies the bounding boxes bboxIn and labelslabelIn corresponding to the detections you want to explain.
[[scoreMap](#mw%5F6930a7ca-338b-4651-a144-9289e32f2c98),[bboxOut](#mw%5Fd196c5ac-7165-4c99-b6ef-50af2f8f72e5),[scores](#mw%5Fabdeb355-71d6-4e5a-9dd2-a2e777ec9c13),[labelOut](#mw%5Fa09de477-65cc-4efd-8da6-68de0a3b99ac)] = drise([detector](#mw%5F7c7e0be2-35d7-4224-87bb-ecfd5d0d9fe8),[I](#mw%5Ffa897d0a-4afe-464a-b723-f425ffbc8bb4)) also returns the bounding boxes bboxOut, scoresscores, and labels labelOut made by the object detector network.
___ = drise(___,[Name=Value](#namevaluepairarguments)) specifies options using one or more name-value arguments in addition to any combination of input and output arguments from the previous syntaxes.
Examples
Load a YOLO v2 object detector trained to detect vehicles.
s = load("yolov2VehicleDetector.mat"); detector = s.detector;
Read in a test image. This image comes from the Caltech Cars 1999 and 2001 data sets, created by Pietro Perona. The image is used with permission.
img = imread("testCar.png"); img = im2single(img);
Detect vehicles in the test image by using the trained YOLO v2 detector. Pass the test image and the detector as input to the detect function. The detect function returns the bounding boxes and the detection scores.
[bboxes,scores,labels] = detect(detector,img); figure annotatedImage = insertObjectAnnotation(img,"rectangle",bboxes,scores); imshow(annotatedImage)

Use the drise function to create saliency maps explaining the detections made by the YOLO v2 object detector.
scoreMap = drise(detector,img);
Plot the saliency map over the image. Areas highlighted in red are more significant in the detection than areas highlighted in blue.
tiledlayout(1,2,TileSpacing="tight")
for i = 1:2 nexttile annotatedImage = insertObjectAnnotation(img,"rectangle",bboxes(i,:),scores(i)); imshow(annotatedImage) hold on imagesc(scoreMap(:,:,i),AlphaData=0.5) title("DRISE Map: Detection " + i) hold off end
colormap jet

Load a YOLO v2 object detector pretrained to detect vehicles.
s = load('yolov2VehicleDetector.mat'); detector = s.detector;
Read in a test image. This image comes from the Caltech Cars 1999 and 2001 data sets, created by Pietro Perona. The image is used with permission.
img = imread("testCar.png"); img = im2single(img);
Specify the target detections you want to understand.
targetBbox = [125 64 116 85]; targetLabel = 1;
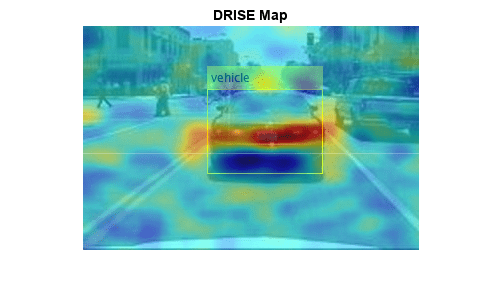
Use the drise function and the target bounding boxes and labels to create saliency maps explaining the detections made by the YOLO v2 object detector.
scoreMap = drise(detector,img,targetBbox,targetLabel);
Plot the saliency map over the image. Areas highlighted in red are more significant in the detection than areas highlighted in blue.
figure annotatedImage = insertObjectAnnotation(img,"rectangle",targetBbox,"vehicle"); imshow(annotatedImage) hold on imagesc(scoreMap,AlphaData=0.5) title("DRISE Map") hold off colormap jet
Load a YOLO v2 object detector pretrained to detect vehicles.
s = load('yolov2VehicleDetector.mat'); detector = s.detector;
Read in a test image. This image comes from the Caltech Cars 1999 and 2001 data sets, created by Pietro Perona. The image is used with permission.
img = imread("testCar.png"); img = im2single(img);
Detect vehicles in the test image by using the trained YOLO v2 detector. Pass the test image and the detector as input to the detect function. The detect function returns the bounding boxes and the detection scores.
[bboxes,scores,labels] = detect(detector,img); figure annotatedImage = insertObjectAnnotation(img,"rectangle",bboxes,scores); imshow(annotatedImage)

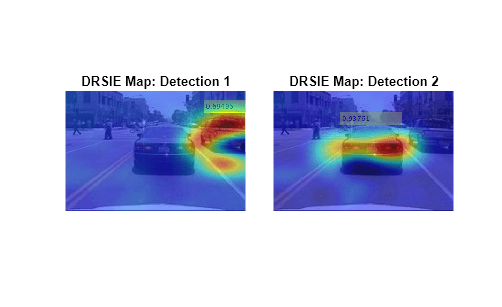
Use the drise function to create saliency maps explaining the detections made by the YOLO v2 object detector. To increase the number of mask images that the function uses to generate the saliency maps, set the number of samples to 16,384. Use a mask resolution of 8-by-8 pixels and a mask probability of 0.85. With the increase in the number of samples, the drise function takes longer to run. To track the progress, return the verbose output.
scoreMap = drise(detector,img, ... NumSamples=16384, ... MaskResolution=[8 8], ... MaskProbability=0.85, ... MiniBatchSize=256, ... Verbose=true);
Computing target detections...Explaining 2 detections. Number of mini-batches to process: 64 .......... .......... .......... .......... .......... (50 mini-batches) .......... .... (64 mini-batches) Total time = 62.6secs.
Plot the saliency map over the image. Areas highlighted in red are more significant in the detection than areas highlighted in blue.
tiledlayout(1,2,TileSpacing="tight")
for i = 1:2 nexttile annotatedImage = insertObjectAnnotation(img,"rectangle",bboxes(i,:),scores(i)); imshow(annotatedImage) hold on imagesc(scoreMap(:,:,i),AlphaData=0.5) title("DRSIE Map: Detection " + i); hold off end colormap jet
Load a YOLO v2 object detector pretrained to detect vehicles.
s = load("yolov2VehicleDetector.mat"); detector = s.detector;
Read in a test image. This image comes from the Caltech Cars 1999 and 2001 data sets, created by Pietro Perona. The image is used with permission.
img = imread("testCar.png"); img = im2single(img);
You can create saliency maps for an object detector that you call using a function handle. The function handle must take exactly one input argument, which is the image, and return exactly three output arguments: the bounding boxes, the class probabilities, and the objectness score.
Modify the YOLO v2 detector to create a custom detector. You can use the function handle input to specify additional name-value arguments to the detect method. Return all detected bounding boxes by setting SelectStrongest to false.
function [bboxes,classProbs,objectness] = customDetector(detector,img)
[bboxes,,,intermediates] = detect(detector,img,SelectStrongest=false);
if isa(intermediates,"cell") classProbs = cellfun(@(x)getFields(x,"ClassProbabilities"), ... intermediates,UniformOutput=false);
objectness = cellfun(@(x)getFields(x,"ObjectnessScores"), ...
    intermediates,UniformOutput=false);
else classProbs = intermediates.ClassProbabilities; objectness = intermediates.ObjectnessScores; end end
function z = getFields(x,fieldName) if ~isempty(x) z = x.(fieldName); else z = []; end end
Specify target detections to understand. For a function handle input, you must specify a numeric value corresponding to the index of the class label.
targetBbox = [125 64 116 85]; targetLabel = 1;
Generate the saliency map.
scoreMap = drise(@(img)customDetector(detector,img),img,targetBbox,targetLabel);
Plot the results.
figure annotatedImage = insertObjectAnnotation(img,"rectangle",targetBbox,"vehicle"); imshow(annotatedImage) hold on imagesc(scoreMap,AlphaData=0.5) title("DRISE Map: Custom Detector") hold off colormap jet

Input Arguments
Input image, specified as a real-valued_H_-by-W_-by-C array, where_H, W, and C are the height, width, and channel size of the image, respectively.
The image must be a real, nonsparse grayscale or RGB image.
The channel size in each image must be equal to the network input channel size. For example, C must be 1 for a grayscale image and 3 for an RGB image.
Data Types: single | double | int8 | int16 | int32 | int64 | uint8 | uint16 | uint32 | uint64
Input bounding boxes, specified as a real-valued _M_-by-4 matrix, where M is the number of detections. Specify each bounding box as a four-element row vector in the form [x y width _height_], where:
- x is the _x_-coordinate of the upper-left corner of the bounding box.
- y is the _y_-coordinate of the upper-left corner of the bounding box.
- width is the width of the bounding box.
- height is the height of the bounding box.
Data Types: single | double | int8 | int16 | int32 | int64 | uint8 | uint16 | uint32 | uint64
Input labels, specified as an integer-valued column vector, a categorical array, or a string array. This input must have a size of M_-by-1, where_M is the number of detections. When you specify a function handle input, you must specify this input as an integer-valued column vector.
Data Types: single | double | int8 | int16 | int32 | int64 | uint8 | uint16 | uint32 | uint64 | string | categorical
Custom detection options, specified as a function handle. The custom detection function must take a single input image and return three outputs:
- Bounding boxes, returned as an _M_-by-4 array of positive, real numbers where M is the number of detections.
- Class probabilities, returned as an_M_-by-C array of positive, real numbers corresponding to the class probabilities for each detection, where_C_ is the number of classes. If your detector does not return class probabilities, then return an empty array,
[ ], instead. - Objectness score, returned as a _M_-by-1 vector corresponding to the probability an object is present in each detection. If your detector does not return objectness scores, then return an empty array,
[ ], instead.
Use this input to specify additional options for the detect function, to use other built-in detectors such as an ssdObjectDetector, or to use detectors from other frameworks.
If the function takes a batch of images as input, then the output must be a_N_-by-1 cell array, where N is the number of images. Each element of the cell must include the bounding boxes, class probabilities, and objectness score for the corresponding image.
Data Types: function_handle
Name-Value Arguments
Specify optional pairs of arguments asName1=Value1,...,NameN=ValueN, where Name is the argument name and Value is the corresponding value. Name-value arguments must appear after other arguments, but the order of the pairs does not matter.
Example: Threshold=0.75,Verbose=true sets the detection threshold to 0.75 and enables verbose output.
Detection threshold, specified as a scalar in the range [0, 1]. The software removes detections whose scores are lower than this value. The default value is 0.5 when you specify detector as a yolov2ObjectDetector (Computer Vision Toolbox), yolov3ObjectDetector (Computer Vision Toolbox), or yolov4ObjectDetector (Computer Vision Toolbox) object. The default value is 0.25 when you specifydetector as a yoloxObjectDetector (Computer Vision Toolbox) object.
This argument applies only if your function syntax does not include thecustomDetection input.
Data Types: single | double | int8 | int16 | int32 | int64 | uint8 | uint16 | uint32 | uint64
Number of samples, specified as a positive integer. This value specifies the number of mask images that the function uses to generate the saliency map. A larger number of samples yields better results but requires more computation time.
Data Types: single | double | int8 | int16 | int32 | int64 | uint8 | uint16 | uint32 | uint64
Mask resolution, specified as a positive integer or a two-element row vector of positive integers. If you specify a single positive integer k then the function uses a map with resolution [k _k_].
The function uses bilinear interpolation to upscale the mask to the size of the image. A small mask resolution returns a masked image with fewer but larger occluded regions. A large mask resolution returns a masked image with more but smaller occluded regions.
Data Types: single | double | int8 | int16 | int32 | int64 | uint8 | uint16 | uint32 | uint64
Mask probability, specified as a scalar in the range [0, 1].
Each pixel in the mask is randomly populated with either 0 or 1, where the probability of 1 is set by the mask probability value. A value of 1 means that the pixel is not masked and none of the image is occluded.
Data Types: single | double | int8 | int16 | int32 | int64 | uint8 | uint16 | uint32 | uint64 | logical
Size of the mini-batch, specified as a positive integer.
The mini-batch size specifies the number of masked images that are passed to the detector at a time. Larger mini-batch sizes lead to faster computation, at the cost of more memory.
Data Types: single | double | int8 | int16 | int32 | int64 | uint8 | uint16 | uint32 | uint64
Option to enable verbose output, specified as a numeric or logical1 (true) or 0 (false). When you set this input to 1 (true), the function returns the progress of the D-RISE algorithm by indicating which mini-batch the function is processing and the total number of mini-batches. The function also returns the amount of time computation takes.
Data Types: single | double | int8 | int16 | int32 | int64 | uint8 | uint16 | uint32 | uint64 | logical
Output Arguments
Saliency map, returned as a numeric matrix or numeric array. Areas in the map with higher positive values correspond to regions of input data that contribute positively to the detection.
If the image has multiple detections, scoreMap is specified as a 3-D array, and the _i_th element, scoreMap(:,:,i), corresponds to the saliency map for the _i_th detection.
Data Types: double
Location of objects detected within the input image or images, returned as an_M_-by-4 matrix. M is the number of bounding boxes in an image.
Each row of bboxOut contains a four-element vector of the form [x y width _height_]. This vector specifies the upper-left corner and size of that corresponding bounding box in pixels.
Detection confidence scores, returned as an _M_-by-1 vector.M is the number of bounding boxes in an image. A higher score indicates higher confidence in the detection.
Labels for bounding boxes, returned as an _M_-by-1 categorical array. M is the number of labels in an image.
References
[1] Petsiuk, Vitali, Rajiv Jain, Varun Manjunatha, Vlad I. Morariu, Ashutosh Mehra, Vicente Ordonez, and Kate Saenko. “Black-Box Explanation of Object Detectors via Saliency Maps.” Preprint, submitted June 10, 2021. https://arxiv.org/abs/2006.03204.
Version History
Introduced in R2024a
See Also
Functions
- detect (Computer Vision Toolbox) | gradCAM | imageLIME | occlusionSensitivity
Objects
- yolov2ObjectDetector (Computer Vision Toolbox) | yolov3ObjectDetector (Computer Vision Toolbox) | yolov4ObjectDetector (Computer Vision Toolbox) | yoloxObjectDetector (Computer Vision Toolbox)
Topics
- Object Detection Using YOLO v2 Deep Learning (Computer Vision Toolbox)
- Grad-CAM Reveals the Why Behind Deep Learning Decisions