networkDistributionDiscriminator - Deep learning distribution discriminator - MATLAB (original) (raw)
Deep learning distribution discriminator
Since R2023a
Syntax
Description
[discriminator](#mw%5Fd04b634b-1bab-47ba-a909-b7a98736c2ff) = networkDistributionDiscriminator([net](#mw%5Fc7f31e75-f6ce-410b-b665-d2310e5d7300%5Fsep%5Fmw%5F3ffb42b3-6af7-4c22-82b3-4fb0f6a399f2),[XID](#mw%5F6ccb0ad6-c46d-4406-a97f-d49c06dd9222),[XOOD](#mw%5F2d62f622-742f-47c4-a066-f1df2a1107d1),[method](#mw%5Fb441c325-fdbe-44eb-80bf-7b3cfee192a3)) returns a distribution discriminator using the method specified bymethod.
You can use the discriminator to classify observations as in-distribution (ID) and out-of-distribution (OOD). OOD data refers to data that is sufficiently different from the data you use to train the network, which can cause the network to behave unexpectedly. For more information, see In-Distribution and Out-of-Distribution Data.
The networkDistributionDiscriminator function first finds distribution confidence scores using the method you specify in method. The function then finds a threshold that best separates the ID and OOD distribution confidence scores. You can classify any observation with a score below the threshold as OOD. For more information about how the function computes the threshold, see Algorithms. You can find the threshold using a set of ID data, a set of OOD data, or both.
To determine whether new data is ID or OOD, pass discriminator as an input to the isInNetworkDistribution function.
To find the distribution confidence scores, pass discriminator as an input to the distributionScores function. For more information about distribution confidence scores, see Distribution Confidence Scores.
[discriminator](#mw%5Fd04b634b-1bab-47ba-a909-b7a98736c2ff) = networkDistributionDiscriminator([net](#mw%5Fc7f31e75-f6ce-410b-b665-d2310e5d7300%5Fsep%5Fmw%5F3ffb42b3-6af7-4c22-82b3-4fb0f6a399f2),[XID](#mw%5F6ccb0ad6-c46d-4406-a97f-d49c06dd9222),[],[method](#mw%5Fb441c325-fdbe-44eb-80bf-7b3cfee192a3)) returns a distribution discriminator using only the ID data. TheThreshold property of discriminator contains the threshold such that the discriminator attains a true positive rate greater than the value of the TruePositiveGoal name-value argument. For more information, see Algorithms.
[discriminator](#mw%5Fd04b634b-1bab-47ba-a909-b7a98736c2ff) = networkDistributionDiscriminator([net](#mw%5Fc7f31e75-f6ce-410b-b665-d2310e5d7300%5Fsep%5Fmw%5F3ffb42b3-6af7-4c22-82b3-4fb0f6a399f2),[],[XOOD](#mw%5F2d62f622-742f-47c4-a066-f1df2a1107d1),[method](#mw%5Fb441c325-fdbe-44eb-80bf-7b3cfee192a3)) returns a distribution discriminator using only the OOD data. TheThreshold property of discriminator contains the threshold such that the discriminator attains a false positive rate less than the value of the FalsePositiveGoal name-value argument. For more information, see Algorithms.
[discriminator](#mw%5Fd04b634b-1bab-47ba-a909-b7a98736c2ff) = networkDistributionDiscriminator(___,[Name=Value](#namevaluepairarguments)) returns a discriminator with additional options specified by one or more name-value arguments.
Examples
Load a pretrained classification network.
load("digitsClassificationMLPNetwork.mat");
Load ID data. Convert the data to a dlarray object.
XID = digitTrain4DArrayData; XID = dlarray(XID,"SSCB");
Modify the ID training data to create an OOD set.
Create a discriminator. The function finds the threshold that best separates the two distributions of data by maximizing the true positive rate and minimizing the false positive rate.
method = "baseline"; discriminator = networkDistributionDiscriminator(net,XID,XOOD,method)
discriminator = BaselineDistributionDiscriminator with properties:
   Method: "baseline"
  Network: [1×1 dlnetwork]
Threshold: 0.9743
Load a pretrained classification network.
load("digitsClassificationMLPNetwork.mat");
Load ID data. Convert the data to a dlarray object.
XID = digitTrain4DArrayData; XID = dlarray(XID,"SSCB");
Create a discriminator using only the ID data. Set the method to "energy" with a temperature of 10. Specify the true positive goal as 0.975. To specify the true positive goal, you must specify ID data and not specify the false positive goal.
method = "energy"; discriminator = networkDistributionDiscriminator(net,XID,[],method, ... Temperature=10, ... TruePositiveGoal=0.975)
discriminator = EnergyDistributionDiscriminator with properties:
     Method: "energy"
    Network: [1×1 dlnetwork]
Temperature: 10
  Threshold: 23.5541
Load a pretrained classification network.
load("digitsClassificationMLPNetwork.mat");
Create OOD data. In this example, the OOD data is 1000 images of random noise. Each image is 28-by-28 pixels, the same size as the input to the network. Convert the data to a dlarray object.
XOOD = rand([28 28 1 1000]); XOOD = dlarray(XOOD,"SSCB");
Create a discriminator. Specify the false positive goal as 0.025. To specify the false positive goal, you must specify OOD data and not specify the true positive goal.
method = "baseline"; discriminator = networkDistributionDiscriminator(net,[],XOOD,method, ... FalsePositiveGoal=0.025)
discriminator = BaselineDistributionDiscriminator with properties:
   Method: "baseline"
  Network: [1×1 dlnetwork]
Threshold: 0.9998
Load a pretrained regression network.
load("digitsRegressionMLPNetwork.mat")
Load ID data. Convert the data to a dlarray object.
XID = digitTrain4DArrayData; XID = dlarray(XID,"SSCB");
Modify the ID training data to create an OOD set.
Create a discriminator. For regression tasks, set the method to "hbos". When using the HBOS method, you can specify additional options. Set the variance cutoff to 0.0001 and use the penultimate layer to compute the HBOS distribution scores.
method = "hbos"; discriminator = networkDistributionDiscriminator(net,XID,XOOD,method, ... VarianceCutoff=0.0001, ... LayerNames="relu_2")
discriminator = HBOSDistributionDiscriminator with properties:
        Method: "hbos"
       Network: [1×1 dlnetwork]
    LayerNames: "relu_2"
VarianceCutoff: 1.0000e-04
     Threshold: -54.1225
Load a pretrained classification network.
load('digitsClassificationMLPNetwork.mat');
Load ID data. Convert the data to a dlarray object and count the number of observations.
XID = digitTrain4DArrayData; XID = dlarray(XID,"SSCB"); numObservations = size(XID,4);
Modify the ID training data to create an OOD set.
Create a discriminator. The function finds the threshold that best separates the two distributions of data.
method = "baseline"; discriminator = networkDistributionDiscriminator(net,XID,XOOD,method);
Test the discriminator on the ID and OOD data using the isInNetworkDistribution function. The isInNetworkDistribution function returns a logical array indicating which observations are ID and which observations are OOD.
Xdata = cat(4,XID,XOOD);
trueClass = [true(numObservations,1); false(numObservations,1)]; predictedClass = isInNetworkDistribution(discriminator,Xdata);
Calculate the accuracy for the ID and OOD observations.
accuracy = sum(trueClass == predictedClass)/numel(trueClass)
Create a confusion chart for the ID and OOD data.
cm = confusionchart(trueClass,predictedClass);
Display the underlying class labels.
ans = 2×1 logical array
0 1
Specify the row and column display labels in the same order.
displayLabels = ["OOD" "ID"];
cm.RowDisplayLabels = displayLabels; cm.ColumnDisplayLabels = displayLabels;

Use the distributionScores function to find the distribution scores for the ID and OOD data.
scores = distributionScores(discriminator,Xdata);
Use rocmetrics to plot a ROC curve to show how well the model is at separating the data into ID and OOD.
rocObj = rocmetrics(trueClass,scores,1); plot(rocObj)

Load a pretrained classification network.
load("digitsClassificationMLPNetwork.mat");
Load the digit sample data and create an image datastore. The imageDatastore function automatically labels the images based on folder names.
digitDatasetPath = fullfile(matlabroot,'toolbox','nnet','nndemos', ... 'nndatasets','DigitDataset'); imds = imageDatastore(digitDatasetPath, ... 'IncludeSubfolders',true,'LabelSource','foldernames');
Create the minibatchqueue object.
- Specify a mini-batch size of 64.
- Preprocess the mini-batches using the
preprocessMiniBatchfunction, listed at the end of this example. - Convert the output to a
dlarrayobject. - Specify that the output data has format
"SSCB"(spatial, spatial, channel, batch).
mbq = minibatchqueue(imds, ... MiniBatchSize=64, ... MiniBatchFcn=@preprocessMiniBatch, ... OutputAsDlarray=true, ... MiniBatchFormat="SSCB");
Create a discriminator using the minibatchqueue object containing ID data. Set the method to "baseline" and the VerbosityLevel to "detailed".
method = "baseline"; discriminator = networkDistributionDiscriminator(net,mbq,[],method,VerbosityLevel="detailed");
Processing in-distribution data: Computing distribution scores... .......... .......... .......... .......... .......... (50 mini-batches) .......... .......... .......... .......... .......... (100 mini-batches) .......... .......... .......... .......... .......... (150 mini-batches) ....... (157 mini-batches) Done. Computing threshold...Done.
**Mini-Batch Preprocessing Function
The preprocessMiniBatch function preprocesses the data using the following steps:
- Extract the image data from the incoming cell array and concatenate the data into a numeric array.
- Rescale the images to the range
[0 1].
function X = preprocessMiniBatch(dataX) X = cat(4,dataX{1:end}); X = rescale(X,InputMin=0,InputMax=1); end
Input Arguments
Neural network, specified as a dlnetwork object.
In-distribution (ID) data, specified as a formatted dlarray object, a minibatchqueue object that returns formatteddlarray objects, or [].For more information about dlarray formats, see the fmt input argument of dlarray.
At least one of the XID andXOOD input arguments must be nonempty.
For more information about ID and OOD data, see In-Distribution and Out-of-Distribution Data.
Out-of-distribution (OOD) data, specified as a formatted dlarray object, a minibatchqueue object that returns formatteddlarray objects, or [].For more information about dlarray formats, see the fmt input argument of dlarray.
At least one of the XID andXOOD input arguments must be nonempty.
For more information about ID and OOD data, see In-Distribution and Out-of-Distribution Data.
Method for computing the distribution confidence scores, specified as one of these values:
"baseline"— Use maximum softmax activations as the distribution confidence scores [1]. This method creates a BaselineDistributionDiscriminator object."odin"— Use rescaled softmax activations as distribution confidence scores (also known as the ODIN method) [2]. Set the scale by specifying theTemperature name-value argument. This method creates an ODINDistributionDiscriminator object."energy"— Use scaled, energy-based distribution confidence scores [3]. Set the scale by specifying theTemperature name-value argument. This method creates an EnergyDistributionDiscriminator object."hbos"— Use histogram-based outlier scores (also known as the HBOS method) [4] as distribution confidence scores. The function computes the scores by constructing histograms for the principal component features for each layer that you specify in the LayerNames name-value argument. Use the VarianceCutoff name-value argument to control the number of principal component features the software uses. To use this method, XID must be nonempty. This method creates a HBOSDistributionDiscriminator object.
For more information about each method, see Distribution Confidence Scores.
Note
Specifying method as"baseline", "odin", or"energy" is valid only for single-output networks with a softmax layer as the final layer. For example, specifying net as a single-output classification network. You can specify method as"hbos" for any network.
Data Types: char | string
Name-Value Arguments
Specify optional pairs of arguments asName1=Value1,...,NameN=ValueN, where Name is the argument name and Value is the corresponding value. Name-value arguments must appear after other arguments, but the order of the pairs does not matter.
Before R2021a, use commas to separate each name and value, and enclose Name in quotes.
Example: TruePositiveGoal=0.99,Temperature=10
True positive goal, specified as a scalar in the range [0, 1]. The software returns the threshold that correctly classifies at least this proportion of the ID data as ID.
Dependency
If you specify a true positive goal, then XID must be nonempty and you cannot specify FalsePositiveGoal. If you specify a nonempty XOOD value, then the software uses only XID to compute the threshold.
If you do not specify the TruePositiveGoal and FalsePositiveGoal name-value arguments and provide nonemptyXID and XOOD values, then the function does not use the default values and instead optimizes over the true positive rate and false positive rate to find the optimal threshold. For more information, see Algorithms.
Data Types: single | double | int8 | int16 | int32 | int64 | uint8 | uint16 | uint32 | uint64
False positive goal, specified as a scalar in the range [0, 1]. The software returns the threshold that incorrectly classifies at most this proportion of the OOD data as ID.
Dependency
If you specify a false positive goal, then XOOD must be nonempty and you must not specify TruePositiveGoal. If you specify a nonempty XID value, then the software uses only XOOD to compute the threshold.
If you do not specify the TruePositiveGoal and FalsePositiveGoal name-value arguments and provide nonemptyXID and XOOD values, then the function does not use the default values and instead optimizes over the true positive rate and false positive rate to find the optimal threshold. For more information, see Algorithms.
Data Types: single | double | int8 | int16 | int32 | int64 | uint8 | uint16 | uint32 | uint64
Temperature scaling for the ODIN and energy methods, specified as a positive scalar. The temperature controls the scaling of the softmax scores when the function computes the distribution confidence scores. For more information, see Distribution Confidence Scores.
Dependency
To enable this input, specify method as"odin" or "energy".
Data Types: single | double | int8 | int16 | int32 | int64 | uint8 | uint16 | uint32 | uint64
Layer names for the HBOS method, specified as a string scalar, character vector, string array, or cell array of character vectors. The default value is the first layer specified in the OutputNames property of net.
The software computes the distribution confidence scores using the principal components from all of the specified layers. For more information, see Density-Based Methods.
Note
To compute the histograms, the software must first compute the principal component features for each layer. Computing the principal components can be slow for layers with a large output size and can cause you to run out of memory. If you run out of memory, try specifying layers with a smaller output size. For more information, see Density-Based Methods.
Dependency
To enable this input, specify method as"hbos".
Data Types: char | string | cell
Variance cutoff for the HBOS method, specified as a scalar in the range [0, 1].
The variance cutoff controls the number of principal component features that the software uses to compute the distribution confidence scores. Using a greater number of features takes more computation time. The closer the VarianceCutoff value is to1, the fewer principal components the software uses to compute the scores. For more information, see Density-Based Methods.
Dependency
To enable this input, specify method as"hbos".
Data Types: single | double | int8 | int16 | int32 | int64 | uint8 | uint16 | uint32 | uint64
Verbosity level of the Command Window output, specified as one of these values:
"off"— Do not display progress information."summary"— Display a summary of the progress information."detailed"— Display detailed information about the progress. This option prints the mini-batch progress. If you do not specify the input data as aminibatchqueueobject, then the"detailed"and"summary"options print the same information.
Output Arguments
Distribution discriminator, returned as a BaselineDistributionDiscriminator, ODINDistributionDiscriminator, EnergyDistributionDiscriminator, or HBOSDistributionDiscriminator object.
The function returns this output as a BaselineDistributionDiscriminator, ODINDistributionDiscriminator, EnergyDistributionDiscriminator, or HBOSDistributionDiscriminator object when you specify method as"baseline", "odin", "energy", or "hbos", respectively.
The Threshold property of discriminator contains the threshold for separating the ID and OOD data. To access the threshold value, call discriminator.Threshold.
More About
In-distribution (ID) data refers to any data that you use to construct and train your model. Additionally, any data that is sufficiently similar to the training data is also said to be ID.
Out-of-distribution (OOD) data refers to data that is sufficiently different to the training data. For example, data collected in a different way, at a different time, under different conditions, or for a different task than the data on which the model was originally trained. Models can receive OOD data when you deploy them in an environment other than the one in which you train them. For example, suppose you train a model on clear X-ray images but then deploy the model on images taken with a lower-quality camera.
OOD data detection is important for assigning confidence to the predictions of a network. For more information, see OOD Data Detection.
OOD data detection is a technique for assessing whether the inputs to a network are OOD. For methods that you apply after training, you can construct a discriminator which acts as an additional output of the trained network that classifies an observation as ID or OOD.
The discriminator works by finding a distribution confidence score for an input. You can then specify a threshold. If the score is less than or equal to that threshold, then the input is OOD. Two groups of metrics for computing distribution confidence scores are softmax-based and density-based methods. Softmax-based methods use the softmax layer to compute the scores. Density-based methods use the outputs of layers that you specify to compute the scores. For more information about how to compute distribution confidence scores, see Distribution Confidence Scores.
These images show how a discriminator acts as an additional output of a trained neural network.
Example Data Discriminators
Distribution confidence scores are metrics for classifying data as ID or OOD. If an input has a score less than or equal to a threshold value, then you can classify that input as OOD. You can use different techniques for finding the distribution confidence scores.
Algorithms
The function creates a discriminator using the trained network. The discriminator behaves as an additional output of the network and classifies an observation as ID or OOD using a threshold. For more information, see OOD Data Detection.
To compute the distribution threshold, the function first computes the distribution confidence scores using the method that you specify in the method input argument. For more information, see Distribution Confidence Scores. The software then finds the threshold that best separates the scores of the ID and OOD data. To find the threshold, the software optimizes over these values:
- True positive goal — Number of ID observations that the discriminator correctly classifies as ID. To optimize for this value, the ID data XID must be nonempty and you must specify TruePositiveGoal. If you specify TruePositiveGoal as
p, then the software finds the threshold above which the proportion of ID confidence scores isp. This process is equivalent to finding the 100(1-p)-th percentile for the ID confidence scores. - False positive goal — Number of OOD observations that the discriminator incorrectly classifies as ID. To optimize for this value, the OOD data XOOD must be nonempty and you must specify FalsePositiveGoal. If you specify FalsePositiveGoal as
p, then the software finds the threshold above which the proportion of OOD confidence scores isp. This process is equivalent to finding the 100p-th percentile for the OOD confidence scores.
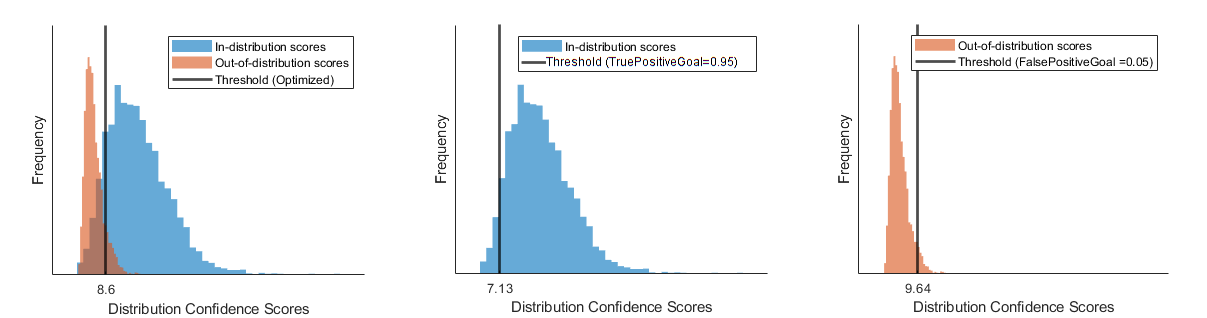
If you provide ID and OOD data and do not specify TruePositiveGoal orFalsePositiveGoal, then the software finds the threshold that maximizes the balanced accuracy 12(TPR+(1−FPR)). If you provide only ID data, then the software optimizes using onlyTruePositiveGoal, whose default is 0.95. If you provide only OOD data, then the software optimizes using only FalsePositiveGoal, whose default is 0.05.
This figure illustrates the different thresholds that the software chooses if you optimize over both the true positive rate and false positive rate, just the true positive rate, or just the false positive rate.
References
[1] Shalev, Gal, Gabi Shalev, and Joseph Keshet. “A Baseline for Detecting Out-of-Distribution Examples in Image Captioning.” In_Proceedings of the 30th ACM International Conference on Multimedia_, 4175–84. Lisboa Portugal: ACM, 2022. https://doi.org/10.1145/3503161.3548340.
[2] Shiyu Liang, Yixuan Li, and R. Srikant, “Enhancing The Reliability of Out-of-distribution Image Detection in Neural Networks” arXiv:1706.02690 [cs.LG], August 30, 2020, http://arxiv.org/abs/1706.02690.
[3] Weitang Liu, Xiaoyun Wang, John D. Owens, and Yixuan Li, “Energy-based Out-of-distribution Detection” arXiv:2010.03759 [cs.LG], April 26, 2021, http://arxiv.org/abs/2010.03759.
[4] Markus Goldstein and Andreas Dengel. "Histogram-based outlier score (hbos): A fast unsupervised anomaly detection algorithm." KI-2012: poster and demo track 9 (2012).
[5] Jingkang Yang, Kaiyang Zhou, Yixuan Li, and Ziwei Liu, “Generalized Out-of-Distribution Detection: A Survey” August 3, 2022, http://arxiv.org/abs/2110.11334.
[6] Lee, Kimin, Kibok Lee, Honglak Lee, and Jinwoo Shin. “A Simple Unified Framework for Detecting Out-of-Distribution Samples and Adversarial Attacks.” arXiv, October 27, 2018. http://arxiv.org/abs/1807.03888.
Extended Capabilities
Usage notes and limitations:
- To load a discriminator object for code generation, use the coder.loadNetworkDistributionDiscriminator function.
- Requires the MATLAB® Coder™ Interface for Deep Learning support package. If this support package is not installed, use the Add-On Explorer. To open the Add-On Explorer, go to the MATLAB® Toolstrip and click Add-Ons > Get Add-Ons.
Usage notes and limitations:
- To load a discriminator object for code generation, use the coder.loadNetworkDistributionDiscriminator function.
- Requires the GPU Coder™ Interface for Deep Learning support package. If this support package is not installed, use the Add-On Explorer. To open the Add-On Explorer, go to the MATLAB® Toolstrip and click Add-Ons > Get Add-Ons.
Usage notes and limitations:
- This function runs on the GPU if its inputs meet either or both of these conditions:
- Any values of the network learnable parameters are
dlarrayobjects with underlying data of typegpuArray. To see the learnables for a networknet, callnet.Learnables.Value. - Any of the data is a
dlarrayobject with underlying data of typegpuArray.
- Any values of the network learnable parameters are
For more information, see Run MATLAB Functions on a GPU (Parallel Computing Toolbox).
Version History
Introduced in R2023a
The networkDistributionDiscriminator function now support networks with multiple inputs.
Set the VerbosityLevel option to view progress information. The software displays progress information in the Command Window. You can set theVerbosityLevel to "off","summary", or "detailed".
Detect out-of-distribution data using minibatchqueue objects. You can use minibatchequeue objects to create, preprocess, and manage mini-batches of data, and to automatically convert your data to adlarray object.