Format Tabular Data in Apps - MATLAB & Simulink (original) (raw)
Table arrays are useful for storing tabular data as MATLAB® variables. For example, you can call the readtable function to create a table array from a spreadsheet. You can use aTable UI component to display table array data in apps and to take advantage of interactive editing features for certain data types. Only App Designer apps and figures created with the uifigure function support using table arrays in a Table UI component.
If you are using App Designer to display tabular data, first create aTable UI component in Design View. Then, use the examples on this page to format the data and to set properties of the Table UI component inCode View. For more information about using tables in App Designer, see Add Tables to App Designer Apps.
To see a fully coded example app that uses some of these data types in a table component, see Create Interactive Table in an App.
Numeric Data
In a Table UI component, numeric data displays as right-justified values.
fig = uifigure; tdata = table([10; 1; 5],[12; 7; 38]); uit = uitable(fig,'Data',tdata); uit.Position(3) = 200; uit.RowName = 'numbered';

Logical Data
Logical values display as check boxes. true values are checked, whereas false values are unchecked. When the ColumnEditable property of theTable UI component istrue, the user can select and clear the check boxes in the app.
fig = uifigure; tdata = table([true; true; false]); uit = uitable(fig,'Data',tdata); uit.Position(3) = 130; uit.RowName = 'numbered';

Categorical Data
categorical values can appear as drop-down lists or as text. The categories appear in drop-down lists when theColumnEditable property of theTable UI component istrue. Otherwise, the categories display as text without a drop-down list.
fig = uifigure; cnames = categorical({'Blue';'Red'},{'Blue','Red'}); w = [400; 700]; tdata = table(cnames,w,'VariableNames',{'Color','Wavelength'}); uit = uitable(fig,'Data',tdata,'ColumnEditable',true);
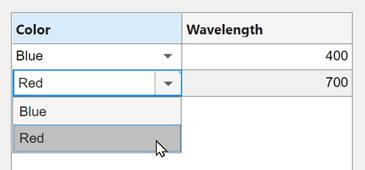
If the categorical array is not protected, users can add new categories in the running app by typing in the cell.
Datetime Data
datetime values display according to theFormat property of the corresponding table variable (a datetime array).
fig = uifigure; dates = datetime([2016,01,17; 2017,01,20],'Format','MM/dd/uuuu'); m = [10; 9]; tdata = table(dates,m,'VariableNames',{'Date','Measurement'}); uit = uitable(fig,'Data',tdata);
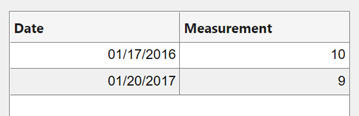
To change the format, use dot notation to set theFormat property of the table variable. Then, replace the data in the Table UI component.
tdata.Date.Format = 'dd/MM/uuuu'; uit.Data = tdata;

When the ColumnEditable property of theTable UI component istrue, users can change date values in the app. When the column is editable, the app expects input values that conform to the Format property of thedatetime array. If the user enters an invalid date, the value displayed in the table isNaT.
Duration Data
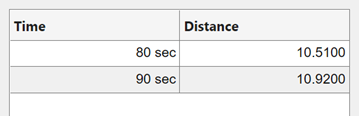
duration values display according to theFormat property of the corresponding table variable (a duration array).
fig = uifigure; mtime = duration([0;0],[1;1],[20;30]); dist = [10.51; 10.92]; tdata = table(mtime,dist,'VariableNames',{'Time','Distance'}); uit = uitable(fig,'Data',tdata);
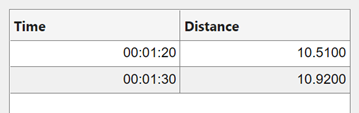
To change the format, use dot notation to set theFormat property of the table variable.
tdata.Time.Format = 's'; uit.Data = tdata;
Cells containing duration values are not editable in the running app, even when ColumnEditable of the Table UI component istrue.
Nonscalar Data
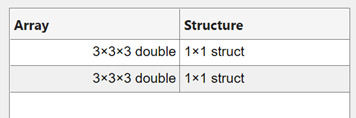
Nonscalar values display in the app the same way as they display in the Command Window. For example, this table array contains 3-D arrays and struct arrays.
fig = uifigure; arr = {rand(3,3,3); rand(3,3,3)}; s = {struct; struct}; tdata = table(arr,s,'VariableNames',{'Array','Structure'}); uit = uitable(fig,'Data',tdata);
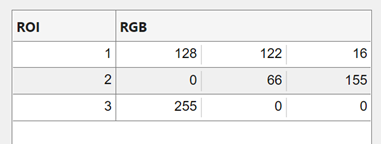
A multicolumn table array variable displays as a combined column in the app, just as it does in the Command Window. For example, theRGB variable in this table array is a 3-by-3 array.
n = [1;2;3]; rgbs = [128 122 16; 0 66 155; 255 0 0]; tdata = table(n,rgbs,'VariableNames',{'ROI','RGB'})
tdata =
3×2 table
ROI           RGB
___    _________________

 1     128    122     16
 2       0     66    155
 3     255      0      0
The Table UI component provides a similar presentation. Selecting an item in the RGB column selects all the subcolumns in that row. The values in the subcolumns are not editable in the running app, even whenColumnEditable property of theTable UI component istrue.
fig = uifigure; uit = uitable(fig,'Data',tdata);
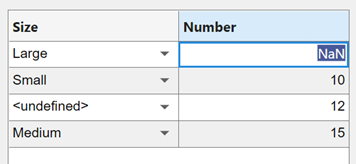
Missing Data Values
Missing values display as indicators according to the data type:
- Missing strings display as
<missing>. - Undefined
categoricalvalues display as<undefined>. - Invalid or undefined numbers or
durationvalues display asNaN. - Invalid or undefined
datetimevalues display asNaT.
If the ColumnEditable property of the Table UI component istrue, then the user can correct the values in the running app.
fig = uifigure; sz = categorical([1; 3; 4; 2],1:3,{'Large','Medium','Small'}); num = [NaN; 10; 12; 15]; tdata = table(sz,num,'VariableNames',{'Size','Number'}); uit = uitable(fig,'Data',tdata,'ColumnEditable',true);